
Active Contour Segmentation based on Approximate Entropy
Application to Cell Membrane Segmentation in Confocal Microscopy
Aymeric Histace
1
, Elizabeth Bonnefoye
1
, Luis Garrido
2
, Bogdan J. Matuszewski
3
and Mark Murphy
4
1
ETIS UMR 8051 CNRS /ENSEA/ Cergy-Pontoise University, 95000 Cergy, France
2
Image Processing Group, Universitat de Barcelona, Barcelona, Spain
3
ADSIP Research Centre, University of Central Lancashire, Preston, U.K.
4
Liverpool John Moores University, Liverpool, U.K.
Keywords:
Image Segmentation, Active Contours, Approximate Entropy, Confocal Microscopy.
Abstract:
Segmentation of cellular structures is of primary interest in cell imaging for cell shape reconstruction and to
provide crucial information about possible cell morphology changes during radiotherapy for instance. From
the particular perspective of predictive oncology, this paper reports on a novel method for membrane segmen-
tation from single channel actin tagged fluorescence confocal microscopy images, which remains a challeng-
ing task. Proposed method is based on the use of the Approximate Entropy formerly introduced by Pincus
embedded within a Geodesic Active Contour approach. Approximate Entropy can be seen as an estimator
of the regularity of a particular sequence of values and, consequently, can be used as an edge detector. In
this prospective study, a preliminary study on Approximate Entropy as an edge detector function is first pro-
posed with a particular focus on the robustness to noise, and some promising membrane segmentation results
obtained on confocal microscopy images are also shown.
1 INTRODUCTION
Segmentation of cellular structures is an essential tool
in cell imaging as it enables measurements which can
be used to track cell divisions or help to reconstruct
corresponding cell lineage tree providing data for cal-
culation of different parameters like cell proliferation
rate for instance.
More specifically, the work presented in this paper
has been carried out in a context of analyzing changes
of cell cytoskeleton properties in a response to ioniz-
ing radiation insult. The final goal of this research
effort is to better understand cell bio-mechanical re-
sponses during cancer radiation therapy by providing
in fine to biologists a Computer-Assisted-Analysis
tool of the microscopy images making easier the pro-
cessing of the large amount of data.
To date, only few methods propose to address seg-
mentation of cell structures in fluorescence confo-
cal microscopy images (FCMI) (Ortiz De Solorzano
et al., 1999; Sarti et al., 2002; Yan et al., 2008; Mos-
aliganti et al., 2009; Zanella et al., 2010; Pop, 2011;
Meziou et al., 2011; Meziou et al., 2012), and if nu-
clei can be considered as a feasible task, membrane
segmentation remains a real challenge because of the
difficulty to find a biological marker making possible
a satisfying emphasis of a constituting protein.
In (Matuszewski et al., 2011), and (Histace et al.,
2013), it is shown that single actin-tagged acquisi-
tions are of real interest for automatic segmentation
of the complete cell cytoskeleton (nuclei, membrane,
cytoplasm) using a single biologic marker: most pre-
cisely, a complete scheme for nuclei segmentation
based on level-set active contour using a fractional en-
tropy descriptor is proposed.
However, because of the strong acquisition noise
and the lack of homogeneity of the biological marker
when diffusing, the cell membrane segmentation on
that particular type of images remains a real chal-
lenge mostly because of the difficulty to extract re-
liable boundary information.
We propose in this paper a prospective study fo-
cusing on this particular task. Most precisely, we in-
troduce “Approximate Entropy” as a possible robust
edge detector and embed it into a Geodesic Active
Contour (GAC) framework for application to segmen-
tation.
The remainder of this paper is organized as fol-
lows: in Section 2, the data used in the experiment
are described; in Section 3, the segmentation method
270
Histace A., Bonnefoye E., Garrido L., Matuszewski B. and Murphy M..
Active Contour Segmentation based on Approximate Entropy - Application to Cell Membrane Segmentation in Confocal Microscopy.
DOI: 10.5220/0004903002700277
In Proceedings of the International Conference on Bio-inspired Systems and Signal Processing (BIOSIGNALS-2014), pages 270-277
ISBN: 978-989-758-011-6
Copyright
c
2014 SCITEPRESS (Science and Technology Publications, Lda.)

is presented: Approximate entropy is introduced and
detailed, and finally embed into a GAC framework
for application to segmentation; Section 4 focuses on
experiments on synthetic images and then on the seg-
mentation of cell membrane in confocal microscopy
images. Conclusion and Perspective are given in Sec-
tion 5.
2 FLUORESCENCE CONFOCAL
MICROSCOPY IMAGES
The data used in this paper were obtained from hu-
man prostate cells (PNT2) which were grown to con-
fluence on glass coverlsips at 37
◦
C/5% CO
2
in modi-
fied Eagles Medium (MEM) supplemented with 10%
bovine calf serum, 1% non-essential amino acids and
1 % L-glutamine solution penicillin (100 IU/mL) and
streptomycin (100 µg/mL). Once confluent cells were
fixed, actin were labelled with phalloidin-FITC ac-
cording to the manufacturers instructions (Invitro-
gen, UK). All imaging was carried out using a Zeiss
LSM510 confocal microscope. Fig. 1 shows some
images extracted at different slice levels from the
3D microconfocal acquisition of the monolayer PNT2
cell culture. The stack volume is defined on the
512×512×98 grid of pixels each 0.21 µm × 0.21 µm
× 0.11 µ in size.
The choice of filament actin (F-actin) marker is
motivated by the fact that F-actin is believed to play
a vital role in cell structure (Hall, 2009). As Actin
is one of the three most existing proteins in hu-
man cytoskeleton, studying its changes and properties
could help discovering weakness of compromised cy-
toskeleton. This could be finally associated with can-
cer evolution. As actin is mostly present in the cy-
toplasm, we can notice that high intensities in slices
of Fig. 1 represent the most important part of actin
on cell boundaries which allows us to find rough cell
membranes whereas darkest areas represent nuclei.
(a) (b)
Figure 1: Examples of actin tagged fluorescence confocal
microscopy images extracted from a 3D microconfocal ac-
quisition of the monolayer PNT2 cell culture.
3 THEORY OF SEGMENTATION
FRAMEWORK
3.1 Approximate Entropy
Considering gradient-based active contour methods,
a real difficulty is still to have an edge detector func-
tion with a strong robustness to noise in order to avoid
false detection, that leads to non satisfying segmenta-
tion (local minimum). Classic gradient operator has
limited performance for instance and since 1990 and
the former work of Perona and Malik (Perona and
Malik, 1990), other boundaries detector have been
proposed like the GVF approach. In this article, be-
cause of the specificity of the considered images (mi-
croconfocal data), we propose to investigate the pos-
sibility of using a regularity estimator as a possible
edge detector.
Regularity was originally measured by exact reg-
ularity statistics, which has mainly centered around
various entropy measures (Shanon, R
´
enyi, Tsallis).
However, accurate entropy calculation requires vast
amounts of data, and the results will be greatly in-
fluenced by system noise, therefore it is not practical
to apply these methods to experimental data. “Ap-
proximate Entropy” (ApEn) was developed by Steve
M. Pincus in 1991 (Pincus, 1991) to handle these
limitations by modifying an exact regularity statistic,
Kolmogorov-Sinai entropy. ApEn was initially devel-
oped to analyze medical data, such as heart rate (Pin-
cus et al., 1991), and later spread its applications in
finance (Pincus and Kalman, 2004), psychology (Pin-
cus and Goldberger, 1994), and human factors engi-
neering (McKinley et al., 2011).
To summarize the mathematical definition of
ApEn: given an array of size N and an integer m,
under the conditions 0 < m ≤ N, a sequence of real
numbers u = (u(1),u(2),...,u(N)), and a real num-
ber r (where r ≥ 0), let the distance between two
sub-sequences x(i) = (u(i),u(i + 1),...,u(i + m − 1))
and x( j) = (u( j),u( j + 1), ..., u( j + m − 1)), be de-
fined as d(x(i),x( j)) = max
p=1,2,...,m
(|u(i + p − 1) −
u( j + p − 1)|). Then let C
m
i
(r) = { number of j ≤
(N − m +1) such that d(x(i),x( j)) ≤ r}/(N − m + 1).
Now define
C
m
(r) =
1
N − m + 1
N−m+1
∑
i=1
C
m
i
(r) (1)
and finally
ApEn(m, r,N) = ln
h
C
m
(r)
C
m+1
(r)
i
(2)
ActiveContourSegmentationbasedonApproximateEntropy-ApplicationtoCellMembraneSegmentationinConfocal
Microscopy
271

ApEn(m, r,N)(u) may be interpreted as a mea-
sure of the maximum frequency at which number se-
quences within u of length m occur compared with se-
quences of length m + 1. High values of ApEn imply
randomness; low values imply order. In (Parker et al.,
1999), authors hypothesis that ApEn may be used to
distinguish useful image information (edges, textures)
from noise. Inspired by the work of Parker et al., this
work focuses on the possibility of using ApEn as an
edge detector embedded into a GAC framework.
3.2 ApEn in a GAC Framework
GAC were introduced as a geometric alternative for
‘snakes’. It is both a geometric model as well
as energy functional minimization. Let the curve
Γ(p) = {x(p),y(p)}, where p ∈ [0, 1] is an arbitrary
parametrization. The GAC model is defined by the
energy functional
E(Γ) =
Z
1
0
g
h
|∇I
Γ(p)
|
i
|Γ
0
(p)|d p (3)
where g() is a positive edge indicator function that
depends on the image I (it gets small values along the
edges and higher values elsewhere), and ∇ the gradi-
ent operator.
Minimization of Eq. (4) is done using the Euler
Lagrange equation as a gradient descent process, and
leads to
∂Γ(p,t)
∂t
=
h
g
|∇I(Γ)|
− (∇g.N)
i
N (4)
where N is the local normal of the curve Γ.
As said in the introduction of this section, the
choice for g() is crucial for the obtaining of satis-
fying segmentation results. Formerly, Perona-Malik
(Perona and Malik, 1990) proposed to define g() as a
negative exponential function such that
g
∇I
= e
−
∇I
k
2
(5)
with k a strictly positive constant to be empirically
defined, depending on the application.
What we propose here is to use ApEn, instead of
the simple gradient operator, for edge detection such
as
g
ApEn(I)
= e
−
ApEn(I)
k
2
(6)
Main idea is to be able to cop with strongly noised
images like the microconfocal images showed in Sec-
tion 2.
In the following, ApEn images are computed us-
ing a classic square-glindind-window approach of
size M such as M × M = N, each line of the M × M
window forming the vector of values used for ApEn
computation. With this strategy, there are as many
computation of ApEn as the total number of pixels in
the image.
4 TESTS AND RESULTS
4.1 Approximate Entropy as an
Edge-detector Function
In this section, we focus our attention on the study of
ApEn as an efficient edge detector function. For this
purpose, we consider the synthetic image showed in
Fig. 2 in which a peanut shape is corrupted by zero-
mean Gaussian noise of standard-deviation 0.5.
(a) (b)
(c)
Figure 2: (a) Original synthetic image, (b) Image corrupted
by a white-Gaussian noise of standard-deviation 0.5, and (c)
corresponding gradient image.
For illustration, Fig. 2.(c) shows the correspond-
ing gradient image: it can be noticed, that with such
an amount of noise, the edge information is com-
pletely lost.
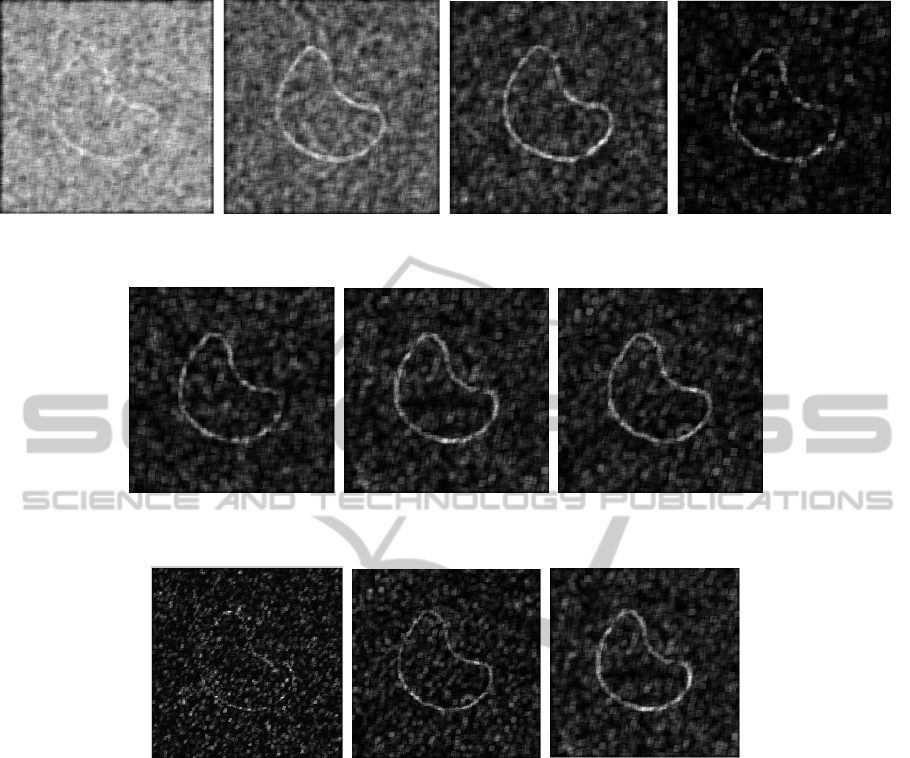
Considering now ApEn, first of all influence of pa-
rameter r is illustrated. m and M are fixed to arbitrary
values, respectively 1 and 9 (following classic values
used for application in EEG or ECG data). Fig. 3
shows obtained results for contour detection applica-
tion. In Fig. 4, for r = 1.5, we considered different
values for m parameter and finally, Fig. 5 illustrates
BIOSIGNALS2014-InternationalConferenceonBio-inspiredSystemsandSignalProcessing
272
(a) (b) (c) (d)
Figure 3: Different ApEn images for (a) r = 0.5, (b) r = 1, (c)r = 1.5 and finally (d) r = 2.
(a) (b) (c)
Figure 4: Different ApEn images for r = 1.5 and (a) m = 1, (b)m = 2, (c) m = 3.
(a) (b) (c)
Figure 5: Different ApEn images for r = 1.5, m = 2 and (a) M = 5, (b) M = 7, (c) M = 9.
different ApEn images for different values of the size
M of the square-window used for ApEn implementa-
tion.
First of all, these different figures illustrate that
ApEn can be considered as a robust edge detector
even in case of a strong corrupting noise. About the
influence of the different parameters, r and M are the
one with most influence. For a value of r too small,
even noise is identified as edge information (see Fig.
3.(a) for instance)) and for a value too important, the
threshold value is too selective. For proposed image
of Fig. 2, r = 1.5 corresponds to the better compro-
mise. Finally parameter m is of less importance, but
m = 2 allows the obtaining of visually slightly better
results.
About parameter M, the size of the square-
window used for computation of ApEn, if this value
has also a strong importance on the edge-detection re-
sults, it also strongly influence the computation time
because on the kernel-filtering strategy used. Best
choice of M should then be based on a compro-
mise between time computation and preciseness of
the edge detection. Nevertheless, with M = 9, N = 81
values of intensity are taken into account for each
computation of ApEn computation of ApEn, which is
statistically more meaningful than with only N = 25
values for instance (M = 5), or even N = 49 (M = 7).
4.2 Segmentation Results on Synthetic
Images
In this section, we now focus on the efficiency of
ApEn when embedded into the GAC framework for
segmentation of the noisy peanut shape of Fig. 2.(b).
For this purpose, we propose to use the classic level-
ActiveContourSegmentationbasedonApproximateEntropy-ApplicationtoCellMembraneSegmentationinConfocal
Microscopy
273
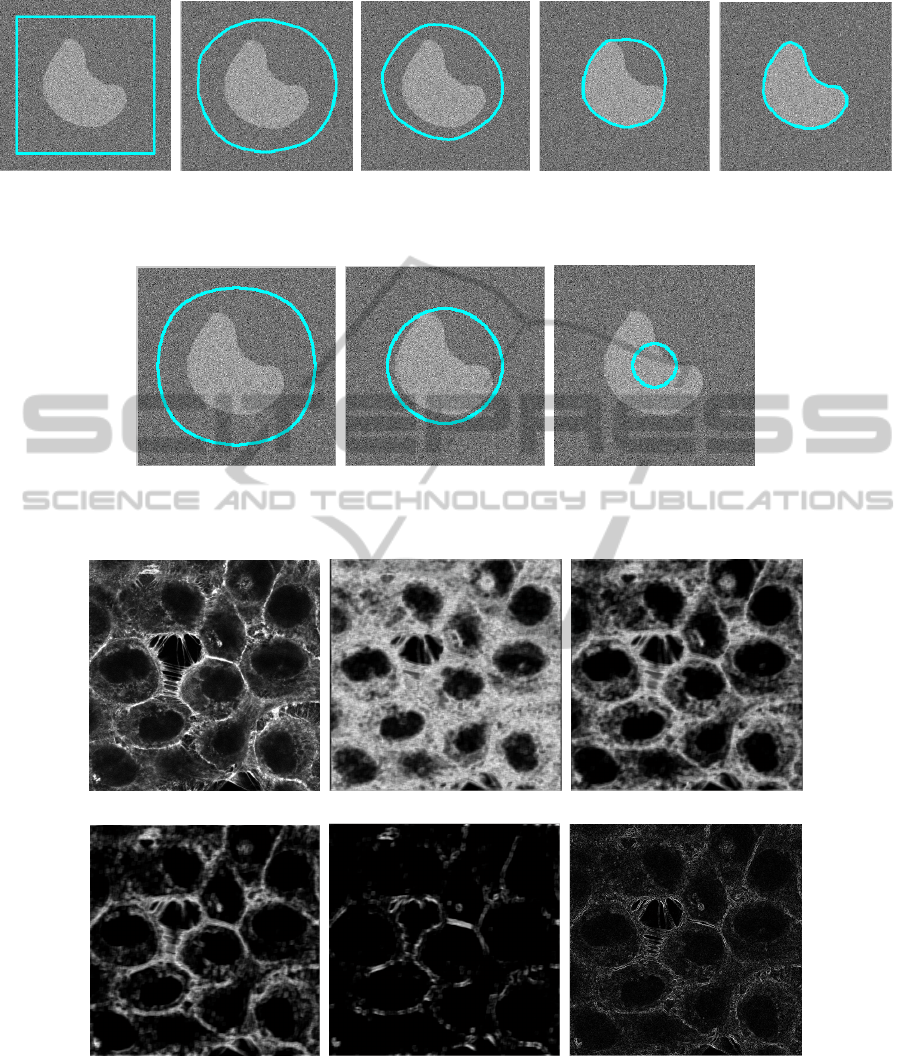
(a) (b) (c) (d) (e)
Figure 6: Segmentation of Fig. 2 using ApEn in a GAC framework. (a) initialization, (b) iteration 100, (c) iteration 200, (d)
iteration (300) and (e) final result.
(a) (b) (c)
Figure 7: Segmentation of Fig. 2 using classic gradient operator of GAC framework. (a) iteration 100, (b) iteration 300, (c)
iteration (450).
(a) (b) (c)
(d) (e) (f)
Figure 8: ApEn images computed on an actin-tagged microscopy image. For these experiments,m = 2, N = 9 and different
values of r are considered : (b) r = 0.05, (c) r = 0.1, (d) r = 0.2 and (e) r = 0.5. Finally (f) is the gradient image obtained on
original image.
set approach of (Osher and Sethian, 1988), in a
fast implementation configuration (Goldenberg et al.,
2001). Initialization of the curve Γ is a squared sur-
rounding the peanut shape. Segmentation result using
ApEn parametrized with r = 1.5, m = 2 and M = 9
(i.e. N = 81) and Eq. (6) is shown Fig. 6.
BIOSIGNALS2014-InternationalConferenceonBio-inspiredSystemsandSignalProcessing
274
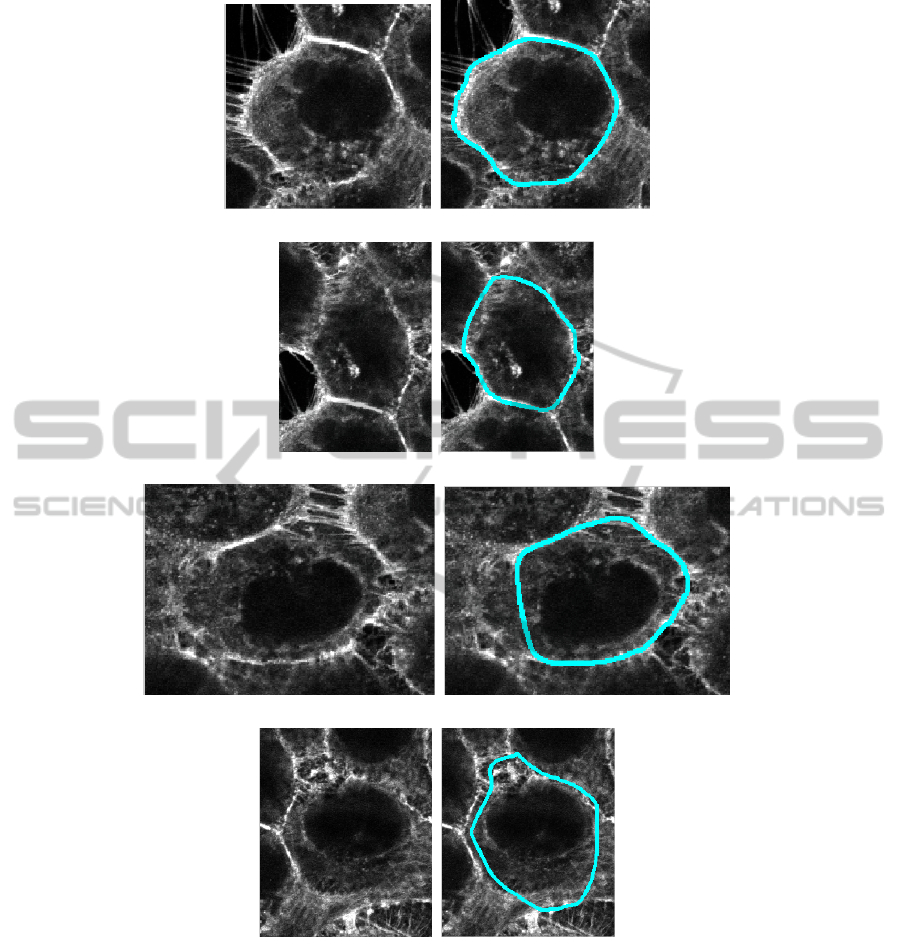
(a) (b)
(c) (d)
(e) (f)
(g) (h)
Figure 9: Several examples of membrane segmentation of cell using the ApEn-GAC algorithm.
For comparison, segmentation result using Eq. (5)
is shown Fig. 7. k parameter was empirically tuned in
order to obtain the best visual possible result (here k =
0.2) even if the final result shows that segmentation is
impossible because of the too strong amount of noise
corrupting original image.
These results demonstrate as a proof of feasibility
that ApEn is of real interest in the framework of ac-
tive contour segmentation, and most precisely when
embedded within a GAC framework. The real ability
of ApEn to detect edge information, even when im-
ages are corrupted with a strong amount of noise, ap-
pears here as a significant advantage when compared
to classic gradient operator.
4.3 Membrane Segmentation in
Confocal Microscopy Images
Coming back to the particular application we focus
on, some previous results are presented in this section.
ActiveContourSegmentationbasedonApproximateEntropy-ApplicationtoCellMembraneSegmentationinConfocal
Microscopy
275

First, Fig. 8 shows ApEn images that were computed
for m = 2, M = 9 (i.e. N = 81) and different values of
r.
It can be noticed in Fig. 8 that again, it exists a
value of r leading to visual interesting results in terms
of the emphasis of cell boundaries: more precisely,
for r = 0.2, a good compromise is obtained between
noise removal and emphasis of cell boundaries (mem-
brane). This result, illustrated in Fig. 8.(d), can be
compared with Fig. 8.(f) showing the classic gradient
image.
About segmentation results using ApEn in GAC
framework, we only present here some first results
obtained on some crops of an original actin-tagged
microscopy image. Initialization strategy is still the
same as the previous one, a square-curve surrounding
the cell to segment (Fig. 9).
These first results are, from our point of view,
quite encouraging when considering the challenging
task. Fig. 9 shows that it is possible to properly seg-
ment cells even in case where visually the boundary
information is not present within the original image
(illustrations (d) and (e) for instance). Same Figure
also shows some limitations of the proposed criterion
that is ApEn when considering subfigure (f). In this
case, the size (M = 9) of the kernel used for the com-
putation of the ApEn image introduced some uncer-
tainty on the precise location of the cell boundary and
lead to an approximative result of segmentation.
5 CONCLUSIONS AND
PERSPECTIVE
In this article, we introduced an original approach for
image segmentation using GAC framework and Ap-
proximate Entropy (ApEn) estimation used as an edge
detector function. Results are presented on both syn-
thetic and real image, focusing for this latter part on
a particular application that is segmentation of cell
boundaries in actin-tagged microconfocal images.
As a proof a feasibility, this contribution is a first
step towards a better understanding of ApEn for a
possible use in image processing and more precisely
as a possible criterion for active contour segmenta-
tion. Compared to the former work of Parker et al.
(Parker et al., 1999) this preliminary study investi-
gates the influence of the different parameters used for
computation of ApEn in an image processing context,
which was not proposed before.
Main forthcoming perspective will consist in
quantitatively estimate the performance of ApEn with
respect to the different parameters r, m, and N (via the
choice made for the size M of the square-window) in
order to possibly go towards an automatic optimiza-
tion of them (r above all). From the application per-
spective, if the first results are quite encouraging, we
must now proposed a more adapted strategy in terms
of initialization in order to be able to segment all the
cells in paralell. Moreover, a clinical validation will
be also necessary to validate the segmentation pro-
cess.
REFERENCES
(2011). Image filtering using anisotropic structure tensor
for cell membrane enhancement in 3d microscopy.
In Proceedings of International Conference on Image
Processing ICIP 2011, pages 2085–2088.
Goldenberg, R., Kimmel, R., Rivlin, E., and Rudzsky,
M. (2001). Fast Geodesic Active Contours.
IEEE TRANSACTIONS ON IMAGE PROCESSING,
10(10):1467–75.
Hall, A. (2009). The cytoskeleton and cancer, volume 28.
Springer Netherlands, Philadelphia, PA, USA.
Histace, A., Meziou, L., Matuszewski, B., Precioso, F.,
Murphy, M., and Carreiras, F. (2013). Statistical re-
gion based active contour using a fractional entropy
descriptor: Application to nuclei cell segmentation in
confocal microscopy images. Annals of British Ma-
chine Vision Association, 2013(5):1–15.
Matuszewski, B., Murphy, M., Burton, D., Marchant, T.,
Moore, C., Histace, A., and Precioso, F. (2011). Seg-
mentation of Cellular Structures in Actin Tagged Flu-
orescence Confocal Microscopy Images. In IEEE
ICIP 2011, pages pp. 3081–3084, Bruxelles, Belgium.
McKinley, R. A., McIntire, L. K., Schmidt, R., Repperger,
D. W., and Caldwell, J. A. (2011). Evaluation of eye
metrics as a detector of fatigue. Human Factors: The
Journal of the Human Factors and Ergonomics Soci-
ety, 53(4):403–414.
Meziou, L., Histace, A., Precioso, F., Matuszewski, B.,
and Carreiras, F. (2012). 3D Confocal Microscopy
data analysis using level-set segmentation with alpha-
divergence similarity measure. In International Con-
ference on Computer Vision Theory and Applications,
pages 861–864, Rome, Italy.
Meziou, L., Histace, A., Precioso, F., Matuszewski, B.,
and Murphy, M. (2011). Confocal Microscopy Seg-
mentation Using Active Contour Based on Alpha-
Divergence. In Proceedings of ICIP 2011, pages
3138–3141.
Mosaliganti, K., Gelas, A., Gouaillard, A., Noche, R., Ob-
holzer, N., and Megason, S. (2009). Detection of spa-
tially correlated objects in 3d images using appear-
ance models and coupled active contours. In Proceed-
ings of MICCAI’09, pages 641–648, Berlin, Heidel-
berg. Springer-Verlag.
Ortiz De Solorzano, C., Garcia Rodriguez, E., Jones, A.,
Pinkel, D., Gray, J. W., Sudar, D., and Lockett, S. J.
(1999). Segmentation of confocal microscope images
of cell nuclei in thick tissue sections. Journal of Mi-
croscopy, 193(3):212–226.
BIOSIGNALS2014-InternationalConferenceonBio-inspiredSystemsandSignalProcessing
276

Osher, S. and Sethian, J. A. (1988). Fronts propagating
with curvature dependent speed: Algorithms based on
hamilton-jacobi formulations. Journal of Comp. Phy.,
79:12–49.
Parker, G. J., Schnabel, J. A., and Barker, G. J. (1999). Non-
linear smoothing of MR images using approximate
entropy – A local measure of signal intensity irregular-
ity. In Kuba, A., S
´
amal, M., and Todd-Pokropek, A.,
editors, Information Processing in Medical Imaging,
volume 1613 of Lecture Notes in Computer Science,
pages 484–489. Springer Berlin Heidelberg.
Perona, P. and Malik, J. (1990). Scale-space and edge
detection using anistropic diffusion. IEEE Transca-
tions on Pattern Analysis and Machine Intelligence,
12(7):629–639.
Pincus, S. and Kalman, R. E. (2004). Irregularity, volatility,
risk, and financial market time series. Proceedings of
the National Academy of Sciences of the United States
of America, 101(38):13709–13714.
Pincus, S. M. (1991). Approximate entropy as a measure
of system complexity. Proceedings of the National
Academy of Sciences, 88(6):2297–2301.
Pincus, S. M., Gladstone, I. M., and Ehrenkranz, R. A.
(1991). A regularity statistic for medical data anal-
ysis. Journal of Clinical Monitoring, 7(4):335–345.
Pincus, S. M. and Goldberger, A. L. (1994). Physiolog-
ical time-series analysis: what does regularity quan-
tify? AJP - Heart and Circulatory Physiology,
266(4):H1643–1656.
Sarti, A., Malladi, R., and Sethian, J. A. (2002). Subjective
surfaces: A geometric model for boundary comple-
tion. Int. J. Comput. Vision, 46(3):201–221.
Yan, P., Zhou, X., Shah, M., and Wong, S. T. C. (2008).
Automatic segmentation of high throughput rnai fluo-
rescent cellular images. IEEE Transactions on Infor-
mation Technology in Biomedicine, 12(1):109–117.
Zanella, C., Campana, M., Rizzi, B., Melani, C., San-
guinetti, G., Bourgine, P., Mikula, K., Peyri
´
eras, N.,
and Sarti, A. (2010). Cells segmentation from 3d con-
focal images of early zebrafish embryogenesis. IEEE
trans. on IP, 19(3):770–781.
ActiveContourSegmentationbasedonApproximateEntropy-ApplicationtoCellMembraneSegmentationinConfocal
Microscopy
277
