
Strategies to Optimize the Impact of Supplies Distribution
in Post-disaster Operations
Christophe Duhamel
1
, Daniel Brasil
2,3
, Andr
´
ea Cynthia Santos
2
´
Eric Ch
ˆ
atelet
4
and Babiga Birregah
4
1
LIMOS-UBP, Universit
´
e Blaise Pascal, Aubi
`
ere, France
2
ICD-LOSI, Universit
´
e de Technologie de Troyes, Troyes, France
3
DCC-UFMG, Universidade Federal de Minas Gerais, Belo Horizonte, Brazil
4
ICD-LM2S, Universi
´
e de Technologie de Troyes, Troyes, France
Keywords:
Post-disaster Response, Logistics, Distribution, Resilience, Heuristics.
Abstract:
We consider the problem of setting a supplies distribution system in a post-disaster context. The primary
decision variables correspond to the site opening schedule and the secondary variables focus on the supplies
distribution to the population zones. The objective is to optimize the supply delivery to the population, while
satisfying some logistics restrictions, both human and financial. We present a non-linear model and we propose
a decomposition approach. The master level problem is addressed by NOMAD solver. The slave subproblem
is treated as a black-box and it is solved by a combination of two heuristics and a VND local search. Numerical
results on both random instances and on one realistic instance, using several scenarios, shows our approach
provides satisfactory results.
1 INTRODUCTION
Recent disasters have shown the critical importance
of setting both a fast, fair and efficient post-disaster
response, especially in terms of supplies distribution.
However, those criteria are often hard to satisfy in
practice due to the limited information, to uncertain
data, to conflicting decisions, to limited time among
others (Boin and McConnell, 2007). Moreover, many
areas exposed to natural disasters have structurally
poor infrastructures and high densities of population.
Hence, providing an efficient response and overcom-
ing the logistic challenge is vital to mitigate the risks,
to reduce the impact over the population and to im-
prove the recovery process.
Resilience plays a key role in crisis management,
and especially in the humanitarian context. Several
main approaches have been proposed for modeling
the resilience, among them the PR
2
(Preparedness,
Response (or Reactiveness) and Recovery) and the R
4
(Robustness, Resourcefulness, Redundancy and Ra-
pidity) models. The PR
2
model (Bruneau and Rein-
horn, 2007; Haimes, 2009; Mezzou et al., 2011) aims
at quantifying three criteria: the system preparedness,
its response and its recovery. Preparedness refers to
anticipation strategies, before the perturbation (the
disaster) occurs. The response encompasses the im-
mediate measures applied to overcome the perturba-
tion while the recovery corresponds to the operations
for restoring the system. The R
4
model (Bruneau
et al., 2003) uses four criteria: the robustness, the re-
sourcefulness, the redundancy and the rapidity. The
robustness quantifies the system’s ability to absorb
the perturbation and the redundancy details the com-
ponents able to partially keep the system operational.
The resourcefulness is the ability to perform supplies
deployment and the rapidity is the system’s ability to
return to its initial state. Those two models are illus-
trated on Figure 1
In the context of humanitarian aid, those models
have to be adapted in order to integrate the human side
of socio-technical systems. The resulting proposed
model is shown in Figure 2.
Our work takes place in this adapted model in
which the monitored performance is the size of the
population in an humanitarian system. We consider
the problem of organizing the best possible way a sup-
plies distribution system in order to reach and help as
much population as possible, while satisfying some
resource limitations. The objective is to optimize the
342
Duhamel C., Brasil D., Cynthia Santos A., Châtelet E. and Birregah B..
Strategies to Optimize the Impact of Supplies Distribution in Post-disaster Operations.
DOI: 10.5220/0004927703420349
In Proceedings of the 3rd International Conference on Operations Research and Enterprise Systems (ICORES-2014), pages 342-349
ISBN: 978-989-758-017-8
Copyright
c
2014 SCITEPRESS (Science and Technology Publications, Lda.)
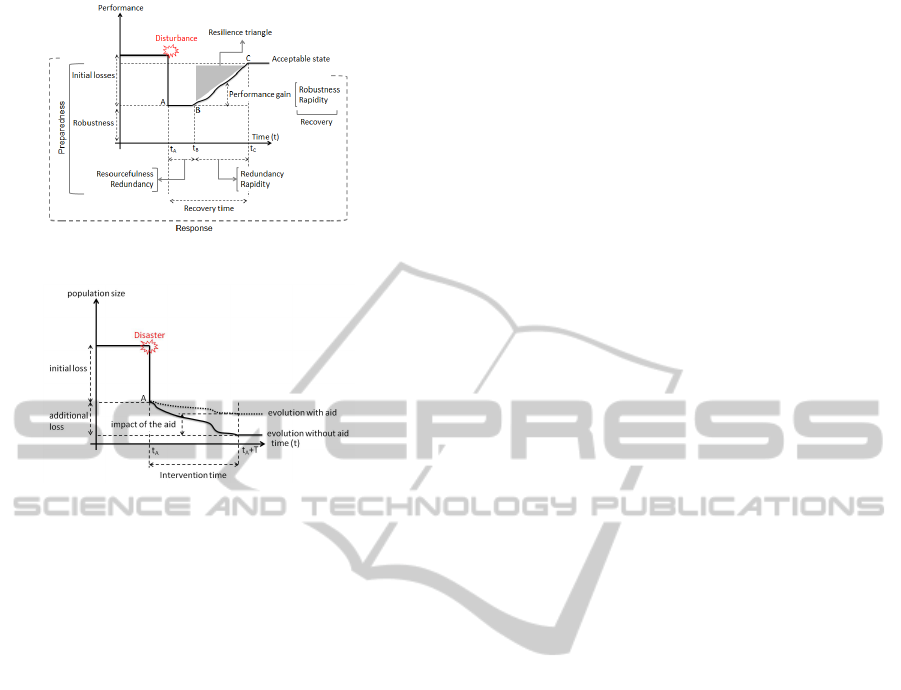
Figure 1: The R
4
/PR
2
resilience model.
Figure 2: Our adapted resilience model.
impact of the aid on the population, considered here
as the population survivability. We propose a mathe-
matical formulation and heuristics which couple a lo-
cal search with a non-linear solver, NOMAD (Le Di-
gabel, 2011).
This work is organized as follows: a bibliograph-
ical review is done in the next section. Section 3
introduces the problem followed by a mathematical
model description. The proposed method is presented
in Section 5. Preliminary numerical results are shown
in Section 6, before concluding remarks.
2 RELATED WORKS
Quantitative models for designing the humanitarian
logistics have been proposed recently in (Rottkem-
per et al., 2012; Berkoune et al., 2012; Nolz et al.,
2010). They focus on two key components: the lo-
cation of warehouses and the routing system. Aside
from the theoretical hardness of those core problems,
additional features are also considered. Both the un-
certainty on the data (Rottkemper et al., 2012) and
various evaluation criteria (Nolz et al., 2010) increase
the overall complexity of the problem. (Berkoune
et al., 2012) propose a decision support system to be
used in crisis situations. They consider three major
decisions to be made. The first decision stands for the
number of sites to be opened. The second relies on
the aid that will be provided in each site. And third,
how the aid will be distributed. The objective is to
minimize the deployment time. They solve the mod-
els with a branch-and-bound algorithm using CPLEX,
and compare the solutions in terms of quality of solu-
tion and computational time. This approach has re-
cently been extended in (Abounacer et al., 2014) in
which an exact method is proposed to solve the prob-
lem of locating facilities and providing a distribution
network under several criteria.
The multi-criteria humanitarian aid distribution
problem where the transportation network is subject
to reliability issues is considered by (Vitoriano et al.,
2011). Several criteria are modeled: cost, dura-
tion, equity, priority, reliability and security. They
are aggregated in a goal-programming approach us-
ing GAMS and Cplex solver. This method is then
evaluated on data about the Port-au-Prince earthquake
catastrophe. The work has been extended in (Lib-
eratore et al., 2014) by taking into account both the
transportation network restoration (roads and bridges)
and the supplies distribution. Six criteria are used:
maximal arrival time, total served demand, maximal
ransack probability, global security, minimal arc re-
liability and global network reliability. The resulting
proposed RecHADS model aims at finding the best
infrastructure recovery plan while providing supplies
to the population. The coordination of the network
restoration and the aid distribution subproblems on
the same instance as before is shown to provide bet-
ter global solution than a sequential approach where a
better final network is preferred over a better distribu-
tion.
The problem of multi-criteria warehouse location-
routing problem has been addressed by (Rath and
Gutjahr, 2014) for disaster relief. It consists in lo-
cating warehouses and designing vehicles routes to
deliver supplies to the population. Three criteria are
considered: the opening costs, the distribution costs
and the demand covered. A matheuristic combining a
Mixed-Integer Linear Program with a Variable Neigh-
borhood Search is proposed and compared with the
Non-dominated Sorting Genetic Algorithm II.
Some works have been focused on routing and dis-
tributing supplies to clusters areas as in (Prins et al.,
2012; Afsar et al., 2012; Afsar et al., 2014). The
authors deal with a medium-long terms macro distri-
bution. Some hypothesis have been considered such
as the center sites distribution are known in advance
and thus demands are leaved in a central facility for
each clusters. Moreover, a fleet of vehicles is used,
but the number of available vehicles is unknown a
priori. Even if the authors do not focus on the ben-
efits of such distribution in a resilience system, it may
contribute in a medium-to-long term recovery phase.
Very sophisticated heuristics and exact methods are
StrategiestoOptimizetheImpactofSuppliesDistributioninPost-disasterOperations
343

proposed to solve the mentioned problem.
3 PROBLEM DEFINITION
In this work, we consider the problem of setting a
distribution system in order to deliver supplies to the
population. Two sets of decisions have to be taken:
first, where and when to open distribution centers and
second, how much, when and where to send supplies.
The distribution centers play a critical role as they
define an intermediate layer between the supplies ar-
rival point (a port or an airport for instance) and the
population. Their location must be carefully chosen
in order to be as close as possible to the population,
thus limiting the logistic distance. The set of poten-
tial distribution centers typically includes safe build-
ings able to store the supplies and to ensure vehicles
arrival/departure, for instance warehouses, stadium,
schools.
Choosing the right set of distribution centers is a
difficult task as it involves several criteria. Besides,
some centers could be first open at some locations and
later transferred to other locations. Here, we consider
only the first part of the humanitarian delivery of sup-
plies. Thus site relocation is not allowed and one must
select the best set of locations on which to open sites.
Moreover, adapting a site in order to make it worth
safely storing supplies takes time. This is also con-
sidered in our model.
The population is located in several non-
overlapping zones and the amount of supplies dis-
tributed for each zone impacts the survival rate. Our
problem is to select the distribution centers and the
daily distributions in order to maximize the survival
rate of the population. The survival rate is a non-linear
function and thus our resulting model is non-linear.
3.1 Mathematical Formulation
The mathematical model we propose couples the hu-
manitarian aid distribution with an approximation of
the survivability rate. People which receive aid are
more likely to survive a post-disaster situation, hence
we are looking for the distribution with the highest
impact. Each supply unit is meant for covering the
need for an individual over one period of time. The
model is built on the assumption of a fair distribution
over a group of persons, that is the number of units
is fairly spread over the group. Thus the group acts
as a homogeneous entity. Consequently, the surviv-
ability rate is considered for the population and it is
improved with a better distribution of supplies. Be-
sides, the survivability rate is parameterized on the
daily needs covering. As a consequence, given a pop-
ulation size p and a delivery d over the time period,
the survivability rate τ is defined as a non-linear func-
tion f () of the daily covered needs:
τ = f (d/p) (1)
The model relies on two components: (i) facility
location to chose the location and opening time and
(ii) distribution planning to deliver aid to the popula-
tion. An initial inventory is supposed to be available
after the disaster, at the beginning of the humanitar-
ian operations, and the model is indexed over the time
periods. Only immediate help is considered, which
does not taken into account waste cleaning, buildings
consolidation or reconstruction or durable population
relocation into safer areas.
Let T be the number of time periods for the im-
mediate humanitarian operations. It corresponds to
the interval time, considered here in days, needed to
provide the immediate humanitarian aid. Let Q be the
total amount of available supplies (e.g. food, water,
bandages and drugs), H be the available logistics hu-
man resources (e.g. personals and materials to operate
the network distribution system) and C be the avail-
able budget. Furthermore, I and J are respectively the
set of zones to be attended and the potential sites to
set a distribution center (store and distribute supplies).
For each potential site j ∈ J, let H
j
and Q
j
be respec-
tively the number of human resources needed to open
and operate it, and its distribution capacity. The cost
for operating a distribution site j and the unit distribu-
tion cost from site j to zone i are respectively denoted
C
j
and C
i j
. The initial population size for the zone i
is defined as P
i
.
Variables p
t
i
determine the population for zone i
at time t. The distribution is given by variables x
t
i j
,
which tells the amount of supplies provided by site i
to zone i, at the time t. Variables y
i
specify the date
the site i is opened.
A mathematical formulation is provided from (2)
to (16), where the objective is to maximizing the final
population, considering all zones and times.
z = max
∑
i∈I
p
T
i
(2)
∑
j∈J
∑
t=1...T
H
j
(T − y
j
) ≤ H (3)
∑
i∈I
x
t
i j
≤ Q
j
∀ j ∈ J, ∀t = 1 . . . T (4)
∑
t=1...T
∑
j∈J
∑
i∈I
x
t
i j
≤ Q (5)
∑
j∈J
C
j
u
j
+
∑
t=1...T
∑
i∈I
C
i j
w
t
i j
!
≤ C (6)
ICORES2014-InternationalConferenceonOperationsResearchandEnterpriseSystems
344

T · u
j
≥ y
j
∀ j ∈ J (7)
Q
j
· w
t
i j
≥ x
t
i j
∀i ∈ I, ∀ j ∈ J,∀t = 1 . . . T (8)
p
0
i
= P
i
∀i ∈ I (9)
p
t+1
i
= p
t
i
· f
∑
i∈I
x
t
i j
p
t
i
!
∀i ∈ I, ∀t = 1 ...T − 1
(10)
y
j
≤ T ∀ j ∈ J (11)
p
t
i
≥ 0 ∀i ∈ I, ∀t = 1 ...T (12)
x
t
i j
≥ 0 ∀i ∈ I, ∀ j ∈ J,∀t = 1 . . . T (13)
y
j
∈ N ∀ j ∈ J (14)
u
j
∈ {0,1} ∀ j ∈ J (15)
w
t
i j
∈ {0,1} ∀i ∈ I, ∀ j ∈ J,∀t = 1 . . . T (16)
The objective function (2) aims at maximizing the
population size at the end of the time period. Inequali-
ties (3) guarantee the human resources to be deployed
to all open distribution centers at each time period do
not exceed H. Restrictions (4) and (5) state the lim-
its of supplies that can be distributed. Constraints (4)
determine the distribution capacity for each center j
at each period of time. Inequality (5) limits the total
amount of supplies available for distribution. Con-
straint (6) sets the global financial limit. Since y
j
are
integer and x
t
i j
are continuous, auxiliary binary vari-
ables u
j
and w
t
i j
, defined in (7) and (8), have been
introduced to properly add the corresponding cost in
(6). Variable u
j
tells if center j is open, and w
t
i j
tells
if there is distribution from center j to zone i on time
t.
The initial population size in each area is set in
Equations (9). Equations (10) set the population evo-
lution in each area at each period of time. The vari-
ables definition are provided in (12) to (16).
This problem is NP-hard as it generalizes the lo-
cation problem. Moreover, it is non-linear due to the
functions f . Thus, solving it exactly might require a
too large time, even on small instances, in a context
of crisis logistics.
4 HEURISTIC STRATEGIES
We propose a decomposition-based heuristic to com-
pute solutions of good quality. The master level con-
sists in choosing which site to open and at which pe-
riod of time. The slave level computes a supplies
distribution in order to maximize the final popula-
tion, given opening dates for the sites (see Figure 3).
Thus, the master level retains most of the combinato-
rial complexity of the problem while the slave prob-
lem deals with the complexity of the population dy-
namics. The later should ideally be tackled by simu-
lation.
population size
violations
opening dates
slave (local)
Master (global search)
Figure 3: The master-slave organization.
In this decomposition, the master problem is in
charge of finding the best combination of opening
dates for the potential sites by setting the y vector.
The slave subproblem receives the y vector from the
master and computes the best distribution schedule (x
variables) in order to optimize the population size z
at the end of the considered period of intervention.
Then, it returns the best value z found, given y.
This mathematical decomposition is considered as
a black-box optimization system. NOMAD solver
(Le Digabel, 2011) is used to compute the y vec-
tor. The slave subproblem is treated as a black-box
which provides evaluation and violations measures
given input values set by NOMAD. The evaluation
corresponds to the value z and the violations refer to
structural constraints (3) and (6). Indeed, the solver
cannot handle explicitly constraints on the y vector
and unfeasible vectors may be submitted to the slave.
The subproblem is solved by a local search. Its
first step consists in checking the violations of the hu-
man and financial resources constraints. If y is unfea-
sible, an infinite value and the violations are returned.
Otherwise, an initial distribution is computed by a
constructive heuristic and the solution is improved by
a local search procedure (see Figure 4).
The constructive heuristic H
1
works by first set-
ting each site availability according to y. The finan-
cial resources are updated accordingly. Then, for
StrategiestoOptimizetheImpactofSuppliesDistributioninPost-disasterOperations
345
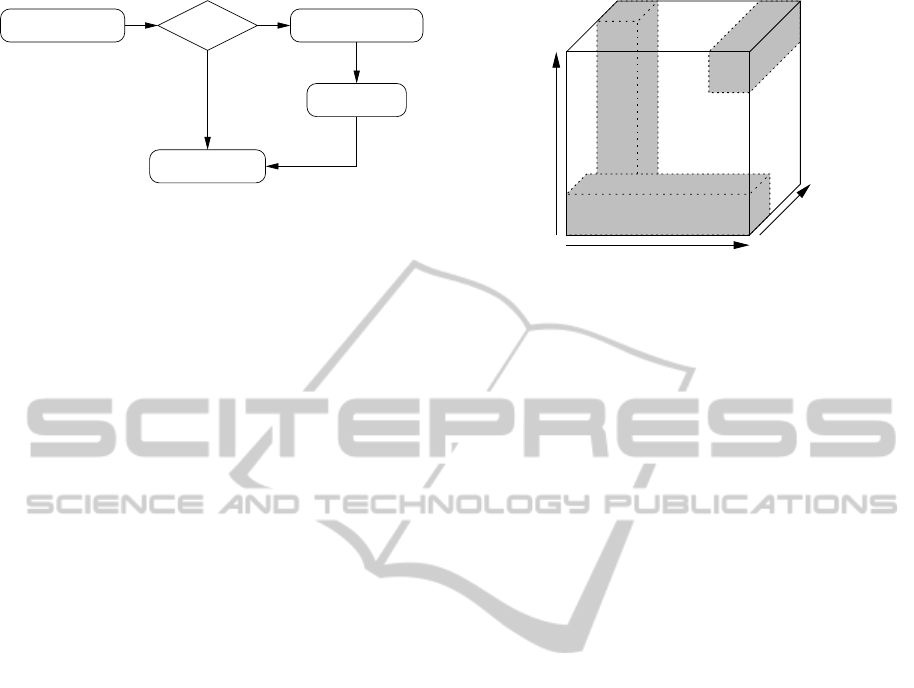
read input feasible? greedy heuristic
local search
return
value & violations
yes
no
Figure 4: The algorithmic scheme of the black-box.
each time period, the supplies are assigned to the
open sites, respecting their capacities and the avail-
able stock of supplies. The distribution is performed
for each site. The zones are sorted on their distance
to the site and the distribution starts with the closest
one. Once the need for a zone is fulfilled, the next
next zone is considered, until the supplies are all dis-
tributed or all the zones are covered. Since H
1
relies
on a greedy approach for distributing the supplies, it
can run short of supplies at the last periods of time.
Thus another heuristic, H
2
, is proposed. It tries to de-
fine a more balanced distribution by first computing
the total distribution capacity for the sites open. Then
the supplies are assigned to each site and each period
of time, using the ratio of the capacity over the total
capacity. The way the supplies are distributed to the
zones is similar to H
1
.
Three neighborhood structures, N
1
, N
2
and N
3
are
proposed to improve the distribution, while respecting
the site availability and the financial constraint. Each
kind of move addresses the distribution balance with
respect to one dimension of the problem (the set of
zones, the set of sites and the time periods), see Fig-
ure 5. A move from the structure N
1
considers one
site and one zone. It looks for supplies transfer from
one time period to another one in such a way the fi-
nal population of the zone is improved. A move from
the second neighborhood structure N
2
considers one
site and one period of time. It tries to balance the
supplies distribution by transferring supplies from a
zone to another one in order to improve the total final
population size of the two zones. A move from the
third neighborhood structure N
3
considers one zone
and one period of time. It aims at reducing the distri-
bution cost by transferring supplies from one site to
another one. Such a move does not have any impact
on the population since the amount of delivered sup-
plies does not change. However, by reducing the cost,
the objective is to allow moves from N
1
and N
2
that
were previously forbidden due to the financial limita-
tion.
Those moves are used in a Variable Neighborhood
Descend (VND) local search. This method has been
proposed by (Mladenovic and Hansen, 1997) and it is
sites
zones
time
N1
N2
N3
Figure 5: The impact of each neighborhood.
well-suited to the use of several neighborhood struc-
tures. The structures are first sorted according to their
complexity, i.e. N
1
/N
2
/N
3
. Only one structure is ac-
tive each iteration. The method starts with the initial
solution s
0
and the first neighborhood structure, that
is N
1
. Given an iteration, let k be the index of the ac-
tive structure and s the current solution. If an improv-
ing solution s
0
is found, it becomes the new current
solution (s ← s
0
) and k ← 1. Otherwise the current
solution does not change and k ← k + 1. The VND
stops when k > 3, i.e. when both three structures
have failed identifying an improving solution. Thus
the current solution is a local optima with respect to
the three neighborhood structures.
5 COMPUTATION RESULTS
The experiments were carried out on an Intel Xeon
CPU at 2.27GHz, with 8 cores, 8MB of cache, 16GB
of RAM, and using the operating system Ubuntu ver-
sion 10.04. The algorithms were implemented in C++
using the GCC version 4.6.3. The solver NOMAD
has been set to perform up to 500 evaluations and the
initial solution given to NOMAD is set with all sites
closed.
Several experiments have been performed over a
set of simulated scenarios and one real scenario from
the city of Belo Horizonte in Brazil. These instances
are described in the sequence (Section 5.1). The first
set of experiments aims at evaluating the impact of the
heuristics and the local searches under the considered
scenarios (Section 5.2). The second set is dedicated
to measuring the quality of the overall framework, in-
cluding the NOMAD solver (Section 5.3).
5.1 Test Scenarios
Let a scenario be a set of parameters which corre-
sponds to a post-disaster situation. Some simplifica-
ICORES2014-InternationalConferenceonOperationsResearchandEnterpriseSystems
346
tions have been used in order to better evaluate the
impact of the proposed methods. Two majors set of
scenarios are considered in the computational experi-
ments.
The first and the second set of scenarios contains
the fixed parameters given in Table 1.
Table 1: Parameters statements for the first and the second
sets of scenarios.
First scenario
Parameters Values
Number of time periods 8 days
Number of zones 10 zones
Number of sites varies from 2 to 12 sites
Size of the population 100,000 people
Supplies for distribution 6 days
Budget Unlimited
Human resources Unlimited
Second scenario
Parameters Values
Number of time periods 8 days
Number of zones 10 zones
Number of sites 10 sites
Size of the population 100,000 people
Supplies for distribution varies from 1 to 8 days
Budget Unlimited
Human resources Unlimited
For the sake of clarity, the parameter supply for
distribution means that the variable resources cover a
number of days. Using those characteristics for the
first scenario, experiments have been designed vary-
ing the number of sites from 2 to 12. Considering the
second set of scenarios, the variability is set on the
amount of available supplies to be distributed which
ranges from 1 to 8 days.
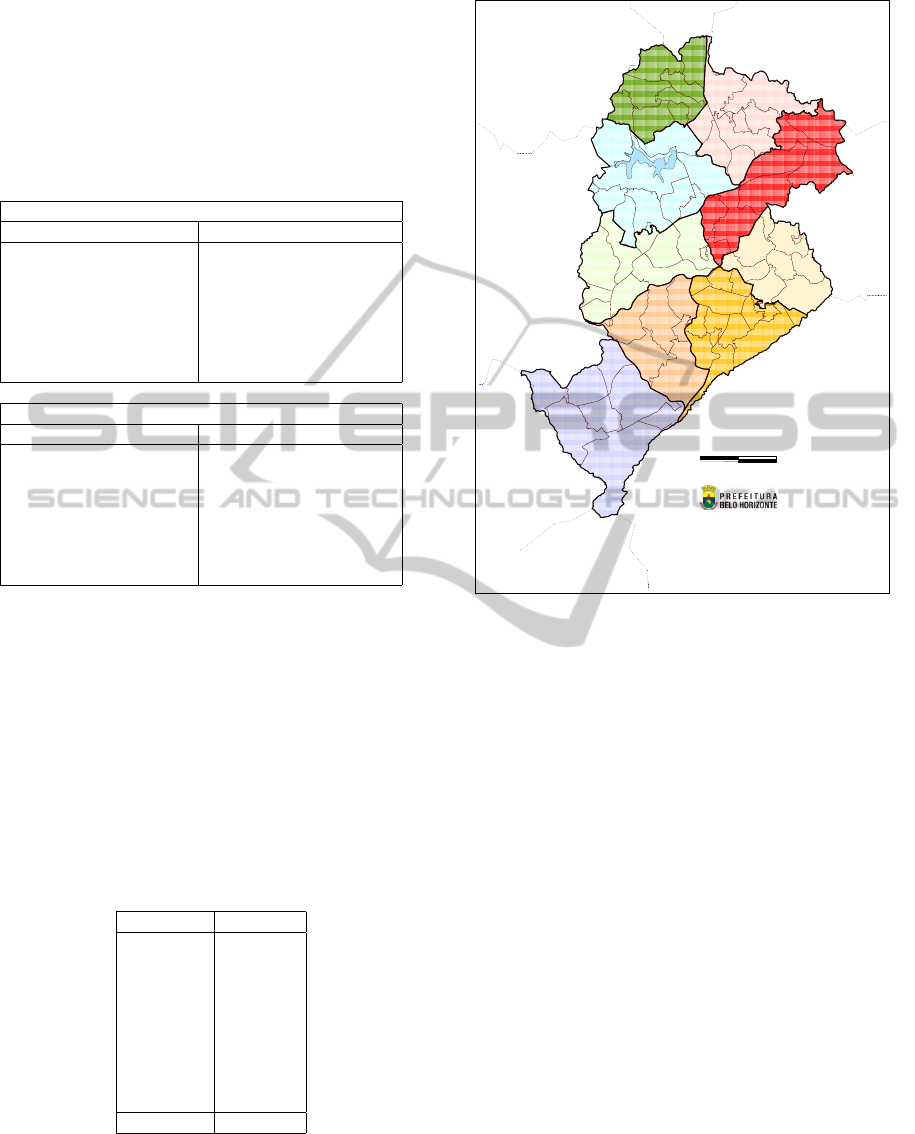
The real scenario uses data from Belo Horizonte.
The main 9 urban zones are considered, with their
population, as shown in Table 2
Table 2: Population size for Belo Horizonte (2012).
zone population
Barreiro 282,552
Centro-sul 283,776
Leste 238,539
Nordeste 290,353
Noroeste 268,038
Norte 212,055
Oeste 308,549
Pampulha 226,110
Venda nova 265,179
Total 2,375,151
5
km
0
UTM SAD69 23S
Organização: SMAPL/SMPL
Base Cartográfica: PRODABEL; IBGE
Lagoa da Pampulha
Pampulha
Pampulha
Pampulha
Pampulha
Pampulha
Pampulha
Pampulha
Pampulha
Pampulha
Centro Sul
Centro Sul
Centro Sul
Centro Sul
Centro Sul
Centro Sul
Centro Sul
Centro Sul
Centro Sul
Leste
Leste
Leste
Leste
Leste
Leste
Leste
Leste
Leste
Noroeste
Noroeste
Noroeste
Noroeste
Noroeste
Noroeste
Noroeste
Noroeste
Noroeste
Oeste
Oeste
Oeste
Oeste
Oeste
Oeste
Oeste
Oeste
Oeste
Nordeste
Nordeste
Nordeste
Nordeste
Nordeste
Nordeste
Nordeste
Nordeste
Nordeste
Barreiro
Barreiro
Barreiro
Barreiro
Barreiro
Barreiro
Barreiro
Barreiro
Barreiro
Venda Nova
Venda Nova
Venda Nova
Venda Nova
Venda Nova
Venda Nova
Venda Nova
Venda Nova
Venda Nova
Norte
Norte
Norte
Norte
Norte
Norte
Norte
Norte
Norte
Mariano
de Abreu
Boa Vista
Abílio
Machado
Floresta/
Santa Tereza
Caiçara
Padre Eustáquio
Santa
Efigênia
Jardim
América
Serra
Cafezal
Morro
das Pedras
Santo
Antônio
Anchieta/
Sion
Mangabeiras
Cabana
Prudente
de Morais
São Bento
/Sta. Lúcia
Bairro
das Indústrias
Belvedere
Cristiano
Machado
Jardim
Montanhês
Instituto
Agronômico
Antônio
Carlos
Concórdia
Santa
Inês
Cachoeirinha
São
Francisco
UFMG
Estoril/Buritis/
Pilar Oeste
Barreiro
de Baixo
Barreiro
de Cima
Pampulha
Primeiro
de Maio
São
Bernardo
Olhos
D'Água
Tupi/Floramar
Ribeiro
de Abreu
Capitão Eduardo
Furquim
Werneck
Jardim
Felicidade
São João
Batista
Piratininga
Barreiro-Sul
Lindéia
Jatobá
Cardoso
Barro Preto
Centro
Francisco Sales
Savassi
Barragem
Pompéia
Taquaril
Baleia
Gorduras
São Paulo/Goiânia
Glória
Camargos
PUC
Santa Maria
Prado Lopes
Jaqueline
Isidoro Norte
Planalto
Barroca
Betânia
Garças/Braúnas
Santa Amélia
Jaraguá
Sarandi
Castelo
Ouro Preto
Confisco
Mantiqueira/Sesc Serra Verde
Jardim Europa
Venda Nova
Céu Azul
Copacabana
Vespasiano
Santa
Luzia
Nova
Lima
Sabará
Brumadinho
Ibirité
Contagem
Ribeirão
das Neves
Unidades de Planejamento
Belo Horizonte - 2009
Figure 6: The 9 zones of Belo Horizonte.
5.2 First Set of Experiments
Figures 7 and 8 illustrate the impact of the proposed
greedy heuristics (H
1
and H
2
) and the three neighbor-
hoods (N
1
, N
2
and N
3
) on the final population.
Results in Figure 7 show that when the number of
sites increases, the greedy heuristic H
1
has a worst
performance than the heuristic H
2
. But the local
search is able to achieve the same level of solution
quality. In addition, when there are more sites avail-
able as for 10 and 12, the heuristic H
1
consumes the
total amount of supplies in the first time periods. As
consequence, the neighborhood N
1
has a higher im-
pact since it works on the time period.
Figure 7 shows that, as the number of sites in-
crease, the number of people assisted gets higher, un-
til it reaches a maximum, on instances with 8, 10 or
12 sites. This happens because on the first 3 instances,
the capacity of the sites are bottlenecks to the distri-
bution. Furthermore, the greedy heuristic H
1
has a
worse performance on the last instances. With more
sites, H
1
tends to spend all material resources on the
beginning, and lack supplies to use on the final time
periods. Nevertheless, after the local search, the solu-
tions obtained are similar, meaning that the search is
robust enough to cope with different initial solutions.
StrategiestoOptimizetheImpactofSuppliesDistributioninPost-disasterOperations
347
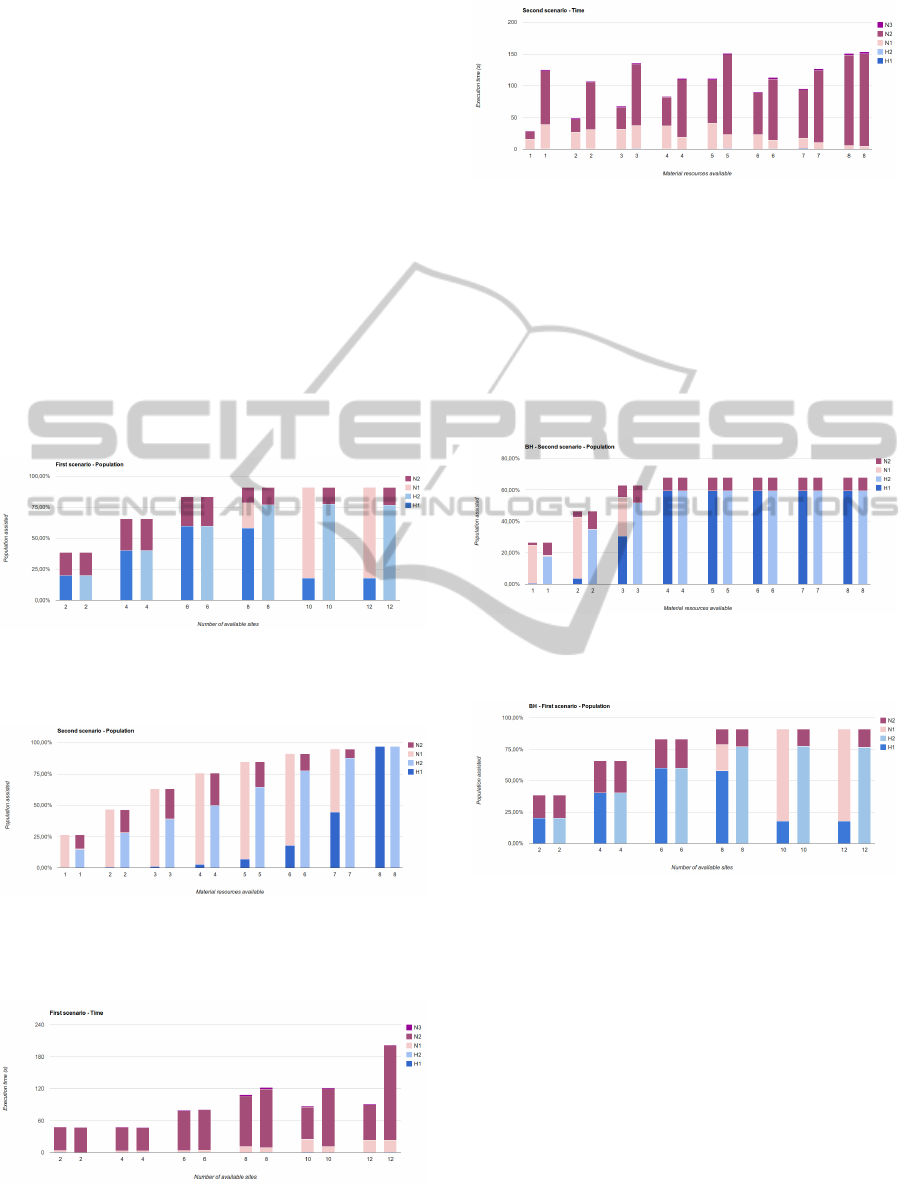
The same behavior is seen on Figure 8. It presents
a clear increase on the quality of the solution, as the
amount of food available increases. On the last in-
stance, when there is food enough for all days, the
greedy heuristics are capable of distributing the food
efficiently. Figure 11 and Figure 12 corroborate with
the analysis made for Figure 7 and Figure 8.
In terms on execution times, both Figures 9 and
Figure 10 show that neighborhoods N
1
and N
2
are re-
sponsible for most of the time consumption. This can
be explained by the computational complexity of the
operations. The greedy heuristics is O(n
4
logn), while
the local search is O(n
6
). The neighborhood N
3
does
not take as long as N
1
and N
2
because, since it does
not affect the population directly, there is no need to
recompute the population after a move, meaning that
it can be evaluated in O(n
4
), opposed to N
1
and N
2
that take O(n
6
) operations.
Figure 7: The impact on the population considering the first
scenario.
Figure 8: The impact on the population considering the sec-
ond scenario.
Figure 9: The impact of the proposed heuristics on the run-
ning time for the first scenario.
Figure 10: The impact of the proposed heuristics on the
running time for the second scenario.
5.3 Second Set of Experiments
For the realistic instance (Tables 11 and 12), H
1
still
produces worse results than H
2
. Neighborhood struc-
ture N
1
helps reaching the same quality as H
2
. Af-
ter the VND, solutions from both heuristics have the
same level of performance.
Figure 11: The impact on BH instance considering the first
scenario.
Figure 12: The impact on BH instance considering the sec-
ond scenario.
6 CONCLUSIONS
We have considered the problem of setting a supplies
distribution system in a post-disaster context. The pri-
mary decision variables correspond to the site open-
ing schedule and the secondary variables focus on the
supplies distribution to the population zones. The ob-
jective is to optimize the supply delivery to the pop-
ulation, while satisfying some logistics restrictions.
We have proposed a decomposition in which the mas-
ter level is addressed by NOMAD solver. The slave
is considered as a black-box and it consists of two
ICORES2014-InternationalConferenceonOperationsResearchandEnterpriseSystems
348

heuristics and a VND local search. Numerical re-
sults on both random instances and one realistic in-
stance, using several scenarios, shows our approach
provides satisfactory results. Besides, the overall re-
sponse time is kept limited since NOMAD is able to
work with very few calls to the black-box. We are cur-
rently investigating several extensions in order to deal
with more realistic population evolution dynamics.
REFERENCES
Abounacer, R., Rekik, M., and Renaud, J. (2014). An
exact solution approach for multi-objective location-
transportation problem for disaster response. Com-
puters & Operations Research, 41:83–93.
Afsar, H. M., Prins, C., and Santos, A. C. (2012). Exact and
heuristics strategies for solving the generalized vehi-
cle routing problem. In Proceedings of the 5th Inter-
national Workshop on Freight Transportation and Lo-
gistics, ODYSSEUS, pages 91–94, Mykonos, Greece.
Afsar, H. M., Prins, C., and Santos, A. C. (2014). Ex-
act and heuristic algorithms for solving the general-
ized vehicle routing problem with flexible fleet size.
International Transactions in Operational Research,
21(1):153–175.
Berkoune, D., Renaud, J., Rekik, M., and Ruiz, A. (2012).
Transportation in disaster response operations. Socio-
Economic Planning Sciences, 46:23–32.
Boin, A. and McConnell, A. (2007). Preparing for critical
infrastructure breakdowns: the limits of crisis man-
agement and the need for resilience. Journal of Con-
tingencies and Crisis Management, 15(1):50–59.
Bruneau, M., Eeri, A. M., Chang, S. E., Eeri, B. M., T, R.,
Eeri, C. M., Lee, G. C., Eeri, A. M., Orourke, T. D.,
Eeri, D. M., Reinhorn, A. M., Eeri, E. M., Shinozuka,
M., Kathleen, F., Eeri, G. M., Wallace, W. A., and I,
D. V. W. (2003). A framework to quantitatively as-
sess and enhance the seismic resilience of communi-
ties. Earthquake Spectra, 19:733–752.
Bruneau, M. and Reinhorn, A. (2007). Exploring the con-
cept of seismic resilience for acute care facilities.
Earthquake Spectra, 23(1):41–62.
Haimes, Y. Y. (2009). On the definition of resilience in sys-
tems. Risk Analysis, 29(4):498–501.
Le Digabel, S. (2011). Algorithm 909: NOMAD:nonlinear
optimization with the MADS algorithm. ACM Trans-
actions on Mathematical Software, 37(4):1–15.
Liberatore, F., Ortuo, M., Tirado, G., Vitoriano, B., and
Scaparra, M. (2014). A hierarchical compromise
model for the joint optimization of recovery opera-
tions and distribution of emergency goods in human-
itarian logistics. Computers & Operations Research,
42(0):3 – 13.
Mezzou, O., Birregah, B., and Ch
ˆ
atelet, E. (2011). A the-
oretical study of the interactions between the compo-
nents of resilience in critical urban infrastructures. In
Smart and Sustainable City (ICSSC 2011), IET Inter-
national Conference on, pages 1–6.
Mladenovic, N. and Hansen, P. (1997). Variable neigh-
borhood search. Computers & Operations Research,
24(11):1097–1100.
Nolz, P. C., Doerner, K. F., Gutjahr, W. J., and Hartl, R. F.
(2010). A bi-objective metaheuristic for disaster relief
operation planning. In Coello, C. A. C., Dhaenens, C.,
and Jourdan, L., editors, Advances in Multi-Objective
Nature Inspired Computing, volume 272 of Studies in
Computational Intelligence, pages 167–187. Springer.
Prins, C., Santos, A. C., and Afsar, H. M. (2012). Splitting
procedure and a relaxed iterated local search for the
generalized vehicle routing problem. In Procedings
of the Latino-Iberoamericano de Investigaci
´
on Oper-
ativa, Simp
´
osio Brasileiro de Pesquisa Operacional,
CLAIO-SBPO, Rio de Janeiro, Brazil.
Rath, S. and Gutjahr, W. J. (2014). A math-heuristic for the
warehouse locationrouting problem in disaster relief.
Computers & Operations Research, 42:25–39.
Rottkemper, B., Fischer, K., and Blecken, A. (2012). A
transshipment model for distribution and inventory re-
location under uncertainty in humanitarian operations.
Socio-Economic Planning Sciences, 46:98–109.
Vitoriano, B. n., Ortu
˜
no, M., Tirado, G., and Montero, J.
(2011). A multi-criteria optimization model for hu-
manitarian aid distribution. Journal of Global Opti-
mization, 51(2):189–208.
StrategiestoOptimizetheImpactofSuppliesDistributioninPost-disasterOperations
349
