
Beat to Beat Estimation of cosRT Angle and cosRT RR Hysteresis from
Exercise ECG Measurement
Jukka A. Lipponen
1,2
and Mika P. Tarvainen
1,2
1
Department of Applied Physics, University of Eastern Finland, Kuopio, Finland
2
Department of Clinical Physiology and Nuclear Medicine, Kuopio University Hospital, Kuopio, Finland
Keywords:
Spatial QRS T-angle, Exercise ECG.
Abstract:
Method for estimating beat-by-beat cosRT angle from the 12-lead exercise electrocardiogram (ECG) measure-
ment is presented. Method uses principal component regression to generate ECG waveform model, and uses
this model to denoise QRS complexes and T-waves. In addition two different methods for synthetizing vector
ECG from the conventional 12-lead measurement are compared. First method synthetize vector ECG by using
inverse of the Dowers matrix and second method produces vector ECG by using singular value decomposition.
Results indicate that vector ECG synthesized using Dowers matrix gives more comparable results for healthy
subjects. Beat-by-beat cosRT estimation revealed that due to respiration angle values can vary as much as
70 degrees, because of changes to electrode positions and volume conduction model of the torso. Thereby
presented method for beat-by-beat estimation of the cosRT angle can improve reliability of this parameter.
1 INTRODUCTION
Exercise electrocardiogram (ECG) measurement has
been used decades as a clinical tool for detecting sev-
eral cardiac diseases such as ischemic heart disease.
Recent studies have shown that exercise measurement
can be also used for predicting sudden cardiac death
for general population and after myocardial infarc-
tion (Zabel et al., 2000; Kardys et al., 2003; Kentt¨a
et al., 2010; Kentt¨a et al., 2011). In addition cosRT
angle and its relation to heart rate during exercise has
been shown to have prognostic value (Kentt¨a et al.,
2012). cosRT angle has been shown to relate to heart
rate level, however this relation differs during exer-
cise and recovery periods i.e. cosRT angle return to-
wards the normal values slower than the heart rate.
This phenomenon is called as cosRT/RR hysteresis.
It is shown that cosRT RR relation is disrupted in pa-
tients with cardiac events (Kentt¨a et al., 2012).
The cosRT angle can be estimated from vec-
tor ECG (VECG) which is measured using Franks
lead configuration. Thereby traditionally measured
12 lead ECG must be transformed to correspond
ECGx, ECGy and ECGz leads of VECG measure-
ment. There are two commonly used methods to syn-
thetize VECG leads from the 12 lead measurements.
First method is so called Dowers method were inverse
of the Dowers transformation matrix is used to pro-
duce x, y and z VECG leads (Dower et al., 1980;
Edenbrandt and Pahlm, 1988). Second possibility is
to use singular value decomposition (SVD) to pro-
duce three orthogonal ECG components from the 12
lead measurements. In this paper we compare these
two techniques to synthetize VECG components us-
ing three exercise ECG measurements and the beat-
by-beat cosRT angles estimated from ECGx, ECGy
and ECGz components produced by both methods are
compared.
The cosRT angle is traditionally estimated using
averaged beat epochs, but in this paper a method
for estimating cosRT angle beat-by-beat is presented.
Method uses principal component regression (PCR)
to generate ECG waveform model, and uses this
model to denoise QRS complex and T-wave epochs.
It is assumed that by using beat-by-beat estimates of
cosRT angle, its relation to heart rate can be better
characterized and abnormalities could be found more
reliably.
2 MATERIALS AND METHODS
2.1 Constructing x, y and z Leads
Before the VECG synthetization, baseline wander
22
A. Lipponen J. and P. Tarvainen M..
Beat to Beat Estimation of cosRT Angle and cosRT RR Hysteresis from Exercise ECG Measurement.
DOI: 10.5220/0005084900220026
In Proceedings of the 2nd International Congress on Cardiovascular Technologies (CARDIOTECHNIX-2014), pages 22-26
ISBN: 978-989-758-055-0
Copyright
c
2014 SCITEPRESS (Science and Technology Publications, Lda.)

caused by chest movements were removed from the
ECG by applying a median filter in a 1 s long win-
dow and by subtracting the acquired baseline from the
original ECG. Secondly, EMG and power line noise
were reduced using a sixth order Butterworth low pass
filter with a cut-off frequency at 48 Hz.
In this study, two methods for synthesizing ECGx,
ECGy and ECGz leads from the conventional 12-lead
measurement were used. First method was Dow-
ers method where inverse of the Dowers transforma-
tion matrix is used to synthetize VECG leads (Dower
et al., 1980). Dowers matrix is based on the Franks
torso model and was created for achieving 12-lead
ECG diagnostics from the Frank VECG recordings
(Dower et al., 1980; Edenbrandt and Pahlm, 1988).
Synthetized leads produced by Dowers method are
designated here as ECGx
dow
,ECGy
dow
and ECGz
dow
.
Second option for synthetizing three independent
leads from the conventional 12-lead ECG is singular
value decomposition (Acar and Koymen, 1999). The
idea in using the SVD algorithm is to produce three
orthogonal ECG components, rather than approxima-
tion of the Frank lead system. In SVD, ECG data ma-
trix Z, the rows of which contain the 8 independent
leads of the 12-lead ECG is decomposed into three
individual matrixes:
Z = UΣV where, UU
T
= VV
T
= I (1)
U and V matrixes are orthonormal and they are gen-
erally called as left and right singular matrixes. Af-
ter the SVD decomposition, first three components
(eigenvectors) of the left singular matrix U are used
as VECG components. Properties of SVD method en-
sures that first component contains most of the energy
of ECG and second component most of the remaining
energy under the restriction of orthogonality to the
first component. First three orthogonal components
are used for cosRT estimation and are designated here
as ECGx
svd
, ECGy
svd
and ECGz
svd
.
3 PCR MODELING OF ECG
After the construction of the ECGx, ECGy and ECGz
leads, the R-waves were detected using an adaptive
QRS detector (Tarvainen et al., 2014). Secondly PCR
modeling was used to improve signal to noise ratio.
Idea of the PCR modeling is to collect QRS com-
plexes and T-wave epochs to individual data matrixes
and create data driven model for QRS complex and
T-wave epochs. Here basic principles of this method
are presented, for more detailed description see (Lip-
ponen et al., 2013; Lipponen et al., 2010).
First QRS complexes and T-waves must be ex-
tracted from all VECG leads (ECGx, ECGy and
ECGz). Because QRS-complex duration is rather
constant regardless of the heart rate, QRS-complexes
can be extracted using constant window. T-wave du-
ration on the other hand is highly related to heart rate
and thus dynamic window is used for T-wave extrac-
tion.
z
QRS
= [−0.1, 0.1] s
z
T
=
0.1,
2
3
RR
s
(2)
were R-wave fiducial points are used as a zero point
(t=0) and RR is the mean RR interval length. Next,
modeling of the (i:th) wave epoch (z
i
) is presented,
similar procedure is used for all QRS complex and T-
wave epochs in the ECGx, ECGy and ECGz channels.
1 Collect 50 previousand 50 following wave epochs
to measurement matrix Z
Z = [z
i−50
, z
i−49
, . . . z
i+49
, z
i+50
]
2 Construct four most significant PCR basis vectors,
which are eigenvectors (v
k
) of the data correlation
matrix (R)
R =
1
100
ZZ
T
Rv
k
= λv
k
3 Use PCR basis vectors for modeling epoch z
i
z
i
= Hθ+ e
where H = [v
1
, v
2
, v
3
, v
4
].
4 LS solution for the model parameters
ˆ
θ
PC
= H
T
z
5 Modeled wave epoch is estimated as
z
PC
i
= H
ˆ
θ
PC
Model basis vector must be estimated dynami-
cally because during exercise increase of the heart rate
causes changes to position and shape of the T-wave.
By using 50 previous and 50 following wave epochs
heart rate changes does not disrupt the model basis
vectors and sufficient prior information is achieved.
Four most significant PCR basis vector are capable to
model individual waveform and its normal variation
and random noise is left out for less significant basis
vectors.
4 cosRT ESTIMATION
cosRT angle estimation was performed in beat-by-
beat manner directly from the PCR-modelled QRS
and T-wave epochs. By using PCR modeling SNR
of the ECG can be increased such that beat-by-beat
detection of the cosRT angle is possible. cosRT an-
gle is defined as the cosine of the dominant vectors
BeattoBeatEstimationofcosRTAngleandcosRTRRHysteresisfromExerciseECGMeasurement
23
Frontal Horizontal Sagittal
Dower
Exercise
Dower
Baseline
SVD
Exercise
SVD
Baseline
ECGy
svd
ECGx
svd
ECGz
svd
−2 0 2 4
−4
−2
0
ECGx
svd
ECGy
svd
−2 0 2 4
−1
0
1
2
3
ECGx
svd
ECGz
svd
−4 −2 0
−1
0
1
2
3
ECGy
svd
ECGz
svd
ECGy
svd
ECGx
svd
ECGz
svd
0 2 4 6
−4
−2
0
2
ECGx
svd
ECGy
svd
0 2 4 6
−1
0
1
2
ECGx
svd
ECGz
svd
−4 −2 0 2
−1
0
1
2
ECGy
svd
ECGz
svd
ECGy
dow
ECGx
dow
ECGz
dow
−200 0 200 400
−200
0
200
ECGx
dow
(mV)
ECGy
dow
(mV)
−200 0 200 400
0
100
200
ECGx
dow
(mV)
ECGz
dow
(mV)
−200 0 200
0
100
200
ECGy
dow
(mV)
ECGz
dow
(mV)
ECGy
dow
ECGx
dow
ECGz
dow
0 200 400 600
−100
0
100
200
300
ECGx
dow
(mV)
ECGy
dow
(mV)
0 200 400 600
−200
0
200
ECGx
dow
(mV)
ECGz
dow
(mV)
−100 0 100 200 300
−200
0
200
ECGy
dow
(mV)
ECGz
dow
(mV)
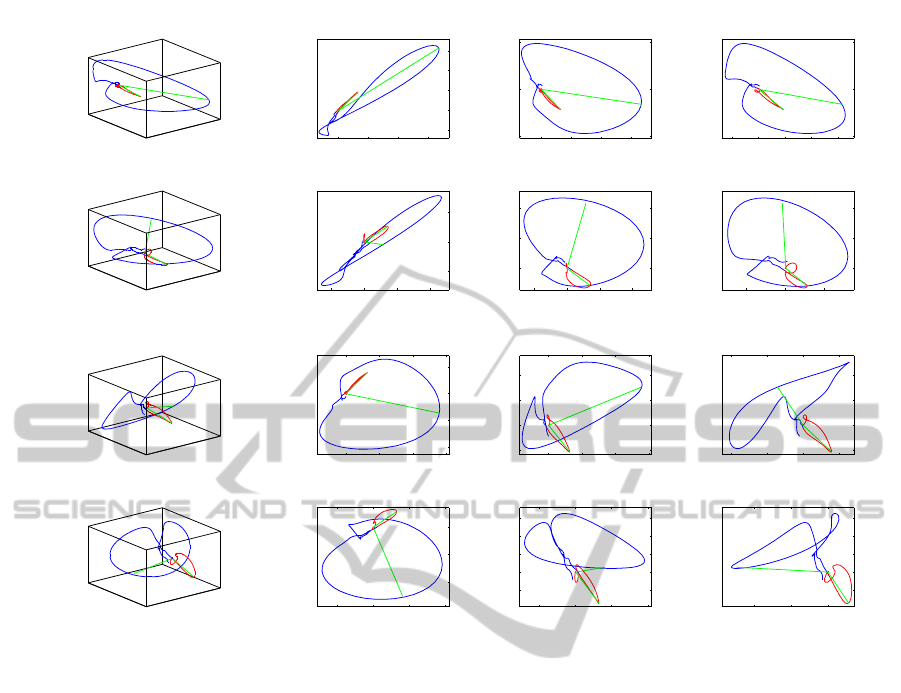
Figure 1: Examples of vector loops constructed by using inverse of the Dowers matrix and SVD. First row and second row
vector loops are estimated using inverse of the Dowers matrix. First row presents VECG loops during the baseline period and
second during the exercise period. Similarly vector loops produced by SVD are presented in third and fourth rows.
(80% of the maximum value) of the QRS vector loop
and the main vector of the T-wave loop. Its value is
limited in the range [-1,1] where -1 reflects the sit-
uation where vector loops are pointing at the oppo-
site directions and 1 reflects the situation where the
loops are pointing at the same direction. cosRT an-
gles estimated from the VECG synthetized by using
Dower’s method are designated as cosRT
dow
and sim-
ilarly cosRT angles estimated from the components
produced by SVD are designated as cosRT
svd
.
4.1 Measurements
Presented methods were tested using three different
incremental exercise tests on cycloergometer. Three
healthy male subjects participated to the measure-
ments. Measurements were performed by using a
Cardiovit CS-200 ergospirometer system (Schiller
AG). ECG electrodes were placed according to the
conventional 12-lead system with the MasonLikar
modification. Sample rate of the ECG was 500Hz.
In the measurement, subject first lay supine for 3 min,
and then sat up on the bicycle for the next 3 min. Af-
ter this bicycle load was initially set to 40W and the
load was increased with 40W every 3 min. Subject
continued exercise until exhaustion. After the subject
indicated that he could not go on anymore, the exer-
cise test was stopped and a 10 min recovery period
was measured.
5 RESULTS
Figure 1 presents examples of the vector loops con-
structed by using inverse of the Dower’s matrix and
SVD before and during the exercise. From the vector
loops constructed by Dowers inverse matrix, it can be
seen that during exercise QRS dominant vector shifts
towards the S-wave part of the QRS loop. This sifting
is clearly visible at least in horizontal and sagittal pro-
jections. T-wave loop direction remains rather con-
stant during the whole measurement. From the SVD
synthetized vector loops similar sifting is clearly vis-
ible at the projection of second and third component
CARDIOTECHNIX2014-InternationalCongressonCardiovascularTechnologies
24

0.4
0.6
0.8
1
RR
−1
0
1
cosRT
dow
0 10 20
−1
0
1
time (s)
cosRT
svd
0 10 20 30
time (s)
0 10 20 30
time (s)
Figure 2: Estimated time series from all three subjects. First row presents RR interval time series in dark gray and used load
in light gray fill. Second and third row presents estimated beat-to-beat time series of the cosRT angles. In second row, angle
is calculated from the vector loops constructed by Dowers inverse matrix and in third row cosRT is estimated from the SVD
synthetized vector loops. Trend of each time series is peresened as red line.
(ECGy and ECGz), however also loop morphology
changes significantly caused by the changes in the
third (least significant) SVD component.
In figure 2 beat-to-beat time series of RR-interval
and cosRT angles are presented for all three subjects.
cosRT
dow
seems to behave rather similarly for all sub-
ject, it decreases along the heart rate and after the ex-
ercise it slowly returns towards baseline. cosRT
svd
behavior is also rather similar as cosRT
dow
although
in third subject there can be seen small increase at the
end of the exercise period.
Figure 3 presents cosRT changes as a function of
the RR-interval during exercise and recovery periods.
cosRT values were divided into a bins according to
coincident RR-interval, used bins were [0.35 0.4 . . .
0.85] s and mean ± standard deviation of each bin
is presented in the figure 3, during the exercise using
red line and using blue line for the values estimated
during the recovery period. cosRT
dow
/RR hysteresis
is clearly visible in all three subjects. cosRT
dow
re-
turns towards the normal values slower than the heart
rate and mean values of the cosRT
dow
bins forms nice
hysteresis curve. cosRT
svd
on the other hand does not
form as clear hysteresis curve as cosRT
dow
, at least
in third subject cosRT
svd
values during the recovery
period are similar as during the exercise.
6 DISCUSSION
Beat-to-beat estimation method of the cosRT angle
from the standard 12-lead ECG measurement has
been presented. In addition cosRT angles defined
from vector loops synthetized using two different
methods were compared. Results show that cosRT
changes during the exercise are more comparable be-
tween the subjects if Dowers inverse matrix is used
for VECG synthetization.
Earlier studies have shown that in SVD syn-
thetized VECG most of the signal energy is contained
in the first two decomposed channels (Acar and Koy-
men, 1999). In third channel ECG power is low and
thus small changes in the potentials of the heart can
induce large morphological changes into this third
channel. This could lead to unexpected variation in
the cosRT
svd
angles. However it could be meaning-
ful to study if all relevant information of the cosRT
svd
can be captured using only the two most significant
synthetized ECG leads.
Beat-to-beat variation of the cosRT angle is sig-
nificant, as can be seen in figure 2. Variation dur-
ing intense exercise can be as large as 70 degrees and
this variation is most likely caused by respiration. In
cosRT time series respiration rhythm is clearly visible
in all parts of the measurement. Respiration causes
changes into the electrode positioning with respect to
the heart (due to chest movements), but also it causes
continuous changes to the characteristics of the
BeattoBeatEstimationofcosRTAngleandcosRTRRHysteresisfromExerciseECGMeasurement
25

Exercise Recovery
0.4 0.6 0.8 1
−1
−0.5
0
0.5
1
RR (s)
cosRT
svd
0.4 0.6 0.8 1
RR (s)
0.4 0.6 0.8 1
RR (s)
−1
−0.5
0
0.5
1
cosRT
dow
Figure 3: cosRT changes as a function of the RR-intercal during exercise and recovery periods are presented for all three
subjects. First row presents cosRT
dow
angles and second row cosRT
svd
angles. Estimated angle values during exercise are
marked as dark gray and during recovery period as light gray. cosRT values were divided into bins depending on current
RR-interval, mean±SD during exercise are shown in red and during recovery in blue lines.
torso’s volume conduction model. Both of these is-
sues cause changes into the ECG components and to
the estimated cosRT angles. Beat-by-beat estimation
methods are important, because the effects of respira-
tion can be better observed and when necessary can
be taken into account in the analysis, and thereby, the
reliability of the VECG parameters such as the cosRT
angle could be improved.
ACKNOWLEDGEMENTS
Study was supported by Kuopio University Hospital
VTR grant.
REFERENCES
Acar, B. and Koymen, H. (1999). Svd-based on-line exer-
cise ecg signal orthogonalization. Biomedical Engi-
neering, 46:311–321.
Dower, G., Machado, H., and Osborne, J. (1980). On de-
riving the electrocardiogram from vectoradiographic
leads. Clin Cardio, 3:87.
Edenbrandt, L. and Pahlm, O. (1988). Vectorcardiogram
synthesized from a 12-lead ecg: superiority of the
inverse dower matrix. Journal of electrocardiolog,
21:361–367.
Kardys, I., Kors, J. A., van der Meer, I. M., Hofman, A.,
van der Kuip, D. A., and Witteman, J. C. (2003). Spa-
tial qrs-t angle predicts cardiac death in a general pop-
ulation. European heart journal, 24:1357–1364.
Kentt¨a, T., Karsikas, M., J.Junttila, M., Perki¨om¨aki, J. S.,
Sepp¨anen, T., Kiviniemi, A., Nieminen, T., Lehtim¨aki,
T., Nikus, K., Lehtinen, R., Viik, J., K¨ah¨onen, M., and
Huikuri, H. V. (2011). Qrs-t morphology measured
from exercise electrocardiogram as a predictor of car-
diac mortality. Europace, 13:701–707.
Kentt¨a, T., Karsikas, M., Kiviniemi, A., Tulppo, M.,
Sepp¨anen, T., and Huikuri, H. V. (2010). Dynamics
and rate-dependence of the spatial angle between ven-
tricular depolarization and repolarization wave fronts
during exercise ecg. Annals of Noninvasive Electro-
cardiology, 15:264–275.
Kentt¨a, T., Viik, J., Karsikas, M., Sepp¨anen, T., Nieminen,
T., Lehtim¨aki, T., Nikus, K., Lehtinena, R., K¨ah¨onen,
M., and Huikuri, H. V. (2012). Postexercise recov-
ery of the spatial qrs/t angle as a predictor of sudden
cardiac death. Heart Rhythm, 9:1083–1089.
Lipponen, J. A., Gladwell, V. F., Kinnunen, H., Karjalainen,
P. A., and Tarvainen, M. P. (2013). The correlation of
vectorcardiographic changes to blood lactate concen-
tration during an exercise test. Signal Processing and
Control, 8:491–499.
Lipponen, J. A., Tarvainen, M. P., Laitinen, T., Lyyra-
Laitinen, T., and Karjalainen, P. A. (2010). A prin-
cipal component regression approach for estimation
of ventricular repolarization characteristics. Transac-
tions Biomedical Engineering, 57:1062–1069.
Tarvainen, M. P., Niskanen, J. P., Lipponen, J. A., Ranta-
Aho, P. O., and Karjalainen, P. A. (2014). Kubios
hrvheart rate variability analysis software. Computer
methods and programs in biomedicine, 113:210–220.
Zabel, M., Acar, B., Klingenheben, T., Franz, M. R., Hohn-
loser, S. H., and Malik, M. (2000). Analysis of 12-
lead t-wave morphology for risk stratification after
myocardial infarction. Circulation, 102:1252–1257.
CARDIOTECHNIX2014-InternationalCongressonCardiovascularTechnologies
26
