
Evaluating Relevant Opinions within a Large Group
Ana Tapia-Rosero
1,2
and Guy De Tr´e
2
1
FIEC, Escuela Superior Polit´ecnica del Litoral, Campus Gustavo Galindo V., Guayaquil, Ecuador
2
Department of Telecommunications and Information Processing, Ghent University,
St-Pietersnieuwstraat 41, B-9000 Ghent, Belgium
Keywords:
LSP, Evaluation, Relevant Opinions, Shape-similarity Method, Large-scale Group Decision-making.
Abstract:
We propose to identify which opinions are relevant, from the decision-maker’s point of view, within a large
group of opinions that could be collected using social media. Our approach considers that each participating
person expresses his/her preferences over a criterion specification as a matter of degree. First, using a shape-
similarity method, we split a large group of opinions, where each opinion is represented through a membership
function, into clusters —here, a cluster depicts a group of similar opinions over the criterion. Then, in order to
evaluate the relevance of each cluster, we differentiate them based on some characteristics like the cohesion,
the number of membership functions and the number of noticeable opinions. Within this paper, the cohesion
of the cluster is a measure that takes into account the level of togetherness among its contained membership
functions; and the representativeness of the cluster is obtained by combining the number of membership
functions and the number of noticeable represented opinions (i.e., considered as more important or worthy of
notice among other opinions). Moreover, relevant clusters result in the evaluation of combining their cohesion
measure and their representativeness according to the decision-maker’s point of view. Finally, as a part of the
evaluation, this proposal includes the steps describing the process through an illustrative example.
1 INTRODUCTION
Nowadays, the use of social media makes it possible
to involve a large group of people to express their
opinions on criteria, e.g., opinion with respect to a
feature like weight, length, or usefulness of a product.
Thus, opinions from different points of view might
be gathered and used in a decision-making context.
Within this paper, each person that belongs to the
aforementioned large group will be considered as an
expert. But, how do we identify and evaluate relevant
opinions in a large group that includes different points
of view and some opinions are more representative
than others? Here, our aim is to evaluate relevance
through the wisdom of the crowd while avoiding to
be overwhelmed with a huge amount of opinions.
Let us consider that a company wants to know
the “usefulness level” (criterion) of a new feature in
a product (e.g., a pressure sensor for an electric tooth-
brush, an augmented reality for a smart phone, a
pedestrian detection in a car, a heart rate monitor in a
cellphone, a pedometer in a waistband, among others)
while the product is under design. Here, it is possible
to gather this information using social media (e.g., a
fan page) where opinions are given by different levels
of knowledge (students, non-experts and profession-
als), areas of expertise (engineering, medicine, jour-
nalism, among others) and personal profiles (single,
married, parents, etc.). Hence, it is desired to differen-
tiate noticeable opinions considering their importance
from the decision-maker’s point of view (e.g., the
opinion of some specific professionals might be more
important than the opinion of some regular users).
Using soft computing techniques, each expert will
express his/her preferences with respect to a specific
criterion (i.e., level of usefulness) through a mem-
bership function. In this way, experts using expres-
sions like “the usefulness level is above 65%”, “it
is below 50%” or “it is around 30%” could repre-
sent what he/she understands to be the level of use-
fulness through membership functions (Eshragh and
Mamdani, 1979; Pedrycz, 2013). Within this paper, it
is not required that each expert has preknowledge on
soft computing techniques to represent his/her prefer-
ences P(x) as a matter of degree, i.e., 0 ≤ P(x) ≤ 1
where 0 denotes a complete disagreement on a crite-
rion and 1 denotes the highest level of agreement, as
long as they provide some values (Dujmovi´c and De
Tr´e, 2011). These values will be used to define the
attribute criterion in a membership function.
76
Tapia-Rosero A. and De Tré G..
Evaluating Relevant Opinions within a Large Group .
DOI: 10.5220/0005087000760086
In Proceedings of the International Conference on Fuzzy Computation Theory and Applications (FCTA-2014), pages 76-86
ISBN: 978-989-758-053-6
Copyright
c
2014 SCITEPRESS (Science and Technology Publications, Lda.)

Once all the membership functions have been
gathered, we are able to group them using a shape-
similarity method (Tapia-Rosero et al., 2014). The
shape-similarity method obtains clusters of similar
opinions, represented by symbolic notations, facili-
tating their further processing. Each cluster allows
us to obtain the closest approximation to represent a
group of expert opinions by means of its upper and
lower bounds. These boundaries allow us to compute
a cohesion measure among the contained membership
functions, where a higher value denotes more togeth-
erness and hence expresses a group of more confident
opinions. The main advantage of the proposed cohe-
sion measure is that it is possible to obtain a cluster
where some of the contained membership functions
do not overlap but are close enough to be considered
similar (Tapia-Rosero and De Tr´e, 2013). Notwith-
standing, any cluster with a single membership func-
tion will obtain the highest cohesion value. Therefore,
we consider that besides the cohesion measure, addi-
tional attributes describe a relevant cluster. As well
as one bright bulb could light up a room as good as
a higher number of less brighter bulbs; we consider
that the opinion of one expert might highlight among
others. Based on this analogy, the representativeness
of the cluster is obtained by combining the number of
membership functions and the number of noticeable
opinions.
Since any cluster might be categorized as relevant
based on a combination of the aforementioned char-
acteristics, in this paper we use the logic scoring of
preference (LSP) aggregation (Dujmovi´c, 2007; Du-
jmovi´c et al., 2010) to obtain the overall evaluation
value for each cluster. The LSP aggregation is based
on the verbalized approach of the Generalized Con-
junction/Disjunction (GCD) (Dujmovi´c, 2012) and
allows us to easily reflect aspects of human decision-
making, i.e. relative importance given by weights and
a combination of andness and orness. The overall
evaluation values are used in the selection of the rel-
evant clusters and it is made by the decision-maker.
Here, it is possible to select one cluster with the best
evaluation, i.e., the highest overall evaluation value,
or to select a group of the top clusters.
The goal of this proposal is to identify and eval-
uate relevant opinions within a large group from the
decision-maker’s point of view. Within this respect,
it is a challenge trying to accurately reflect some-
one’s point of view. However, by using soft com-
puting techniques it is possible to provide a method
to model and handle importance among opinions in-
cluding as a novelty the use of LSP aggregation which
reflects aspects of human decision-making. In this pa-
per, we studied how a large group of opinions is re-
duced to some of them considered to be relevant by
the decision-maker.
An advantage within the scope of this proposal
is that it handles a large group of opinions gathered
through social media, where the initially given prefer-
ences are not modified. Furthermore, it evaluates dif-
ferent points of view separately (i.e., previously clus-
tered) unlike it occurs in some consensual processes
and it permits the decision-maker to select the group
of opinions that best suits his/her choice based on
the combination of some cluster profile characteris-
tics (i.e., cohesion, number of membership functions
and number of noticeable opinions).
The remainder of this paper is structured as fol-
lows. Section 2 gives some preliminary concepts for
clustering similar opinions and computing a cohe-
sion measure. Section 3 describes the LSP method
based on the verbalized approach of the generalized
conjunction/disjunction aggregators. Section 4 de-
scribes how to identify and quantify relevant opin-
ions within a large group using an illustrative exam-
ple that demonstrates its applicability in a decision-
making context. Section 5 concludes the paper and
presents some opportunities for future work.
2 PRELIMINARIES
This section defines preliminary concepts to prop-
erly understand the remaining sections. These in-
clude concepts on fuzzy sets for representing expert
opinions, some definitions to cluster similarly shaped
membership functions, and how to compute a cohe-
sion measure denoting the level of togetherness for
each of the clusters.
2.1 Representing Expert Opinions
A membership function µ
A
, from the preference point
of view, represents a set of more or less preferred val-
ues of a decision variable x in a fuzzy set A. Hereby,
µ
A
(x) represents the intensity of preference or pref-
erence level in favor of value x (Dubois and Prade,
1997).
In this paper, trapezoidal membership functions
are used considering that they are widely known (Klir
and Yuan, 1995) and they could be built with a few
input values through parameters a, b, c, and d (Equa-
tion 1) to represent the expert preferences over crite-
ria (Dubois, 2000). These dividing points between the
segments, denoted by the aforementioned parameters,
hold the relation a ≤ b ≤ c ≤ d among them.
EvaluatingRelevantOpinionswithinaLargeGroup
77

µ
A
(x) =
0 , x ≤ a
x−a
b−a
, a < x < b
1 , b ≤ x ≤ c
d−x
d−c
, c < x < d
0 , x ≥ d
(1)
If we return to the introductory example, trape-
zoidal membership functions allow experts to express
the usefulness level using percentages to denote their
preferences (Eshragh and Mamdani, 1979; Pedrycz,
2013). In this way, experts might use expressions
like “the usefulness level is above 65%” (Figure 1a)
hereby b = 65%, “it is below 40%” (Figure 1b)
hereby c = 40% or “it is between 25% and 50%” (Fig-
ure 1c) hereby b = 25% and c = 50%. These are cases
where P(x) = 1 denote the highest level of preference.
Analogously, other expressions given by the experts
will lead us to denote the lowest level of preference
agreement on the criterion where P(x) = 0.
1
0
0
a b
X
0
c
X
ba d
1
0
1
0
X
0
c d
(a)
(b)
(c)
P(x) P(x) P(x)
100%
100% 100%
Figure 1: Trapezoidal membership functions expressing ex-
pert preferences through percentages.
Triangular membership functions, a particular
case of trapezium, could be treated considering that b
and c have equal values. This particular membership
function could be used by experts through expressions
“around x” where x denotes the highest level of agree-
ment on the criteria, here x = b = c, and the spread
of less preferred values (i.e., between a and d) might
vary among experts.
2.2 Clustering Similar Opinions: A
Shape Based Approach
Considering that we use a shape-similarity method
proposed in (Tapia-Rosero et al., 2014), within this
subsection some definitions borrowed from (Tapia-
Rosero et al., 2014) are included to make this paper
self-contained. The shape-similarity method assumes
that similar opinions are reflected by similarly shaped
membership functions. It uses as inputs several mem-
bership functions, representing the opinion of experts
over a specific criterion, and builds clusters of similar
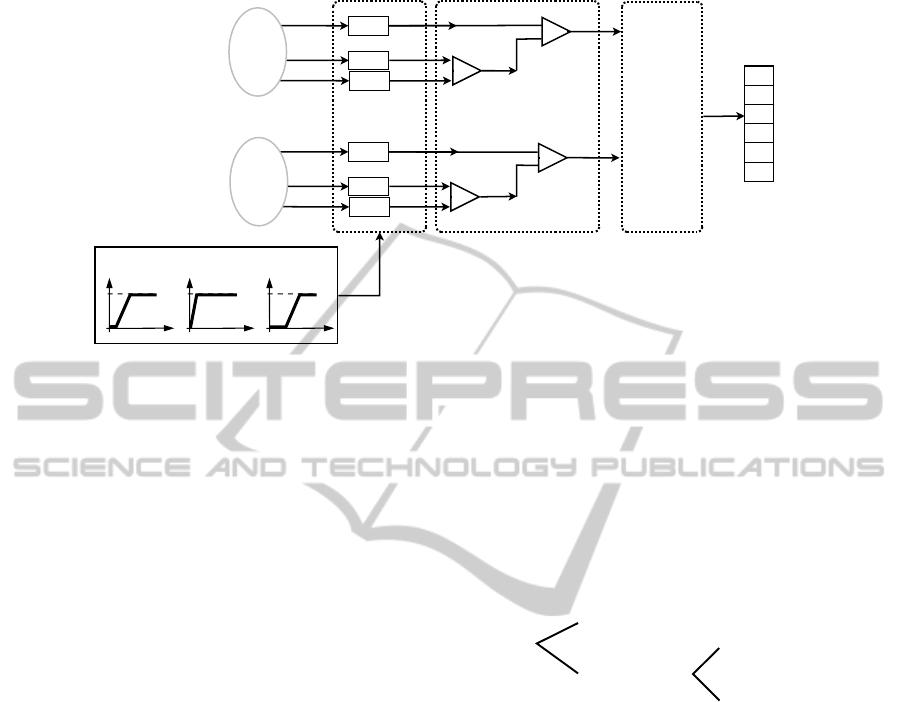
opinions (Figure 2).
The shape-similarity method has three phases that
could be summarized as follows:
1. A shape-symbolic notation for each normal-
ized membership function is built, which depicts
a membership function through a sequence of
symbolic-characters (See Definition 1).
2. A similarity measure in the unit interval among
shape-symbolic notations is obtained, where 0 de-
notes no similarity and 1 denotes full similarity
between them.
3. A clustering step is performed based on the afore-
mentioned similarity measure between notations.
The clustering stops when the highest similarity
is considered too low according to a previously
determined threshold τ, where 0 ≤ τ ≤ 1. The se-
lected threshold τ allows us to adjust the clusters
starting from the highest similarity with the small-
est number of membership functions (i.e., where
each cluster contains a single membership func-
tion) to a lower similarity with the highest num-
ber of membership functions (i.e., one cluster con-
taining all the membership functions).
Let S
category
= {+, −, 0, 1, L, I, H} be the set
that is used to represent the category of a segment in
a membership function, and S
length
a linguistic term
set used to represent its relative length on the X-axis
compared to the sum of all segments. Using the afore-
mentioned sets, a symbolic-character is defined as
follows:
Definition 1. A symbolic-character is a representa-
tion of a segment in a membership function as a pair
ht, ri with t ∈ S
category
and r ∈ S
length
; where t rep-
resents the category of the segment and r depicts its
relative length by means of a linguistic term.
In this way, each segment of the membership func-
tion uses a sign {+,−} to represent its slope, a value
{0, 1} to represent its preference level on the criterion
(i.e., the lowest level or the highest level of agreement
respectively) and a letter {L, I, H} to denote a low, in-
termediate or high point (e.g., a peak in a triangular
membership function corresponds to a high point an-
notated as H). The linguistic term set S
length
, depicted
in Figure 3, expresses the relative length of the seg-
ment on the X-axis by means of labels (e.g., the la-
bel ES corresponds to an “extremely short” segment
while label EL corresponds to an “extremely long”
segment).
Figure 4 shows a trapezoidal membership func-
tion with five segments, each of them represented by
a shape-symboliccharacter. Thus, the shape-symbolic
notation for this figure could be expressed as:
h0,Si h+,VSi h1,Si h-,ESi h0,ELi
Hereafter we will consider that using differ-
ent thresholds, different clusters containing simi-
larly shaped membership functions were obtained.
Thus, for each threshold τ a set of k clusters C
τ
=
FCTA2014-InternationalConferenceonFuzzyComputationTheoryandApplications
78

Phase 1
Symbolic Notation
Phase 2
Calculation
of Similarity
Phase 3
Clustering by
Shape-Similarity
MF
1
MF
2
MF
3
MF
4
a
a
a
b
b
b=c
a=b
c
c
c
d
d
d
d
MF
K
a
b
MF
5
a
d
b
c
Input
Output
Processing
MF
4
a=b
c
d
Shape Similarity Method
a
d
MF
3
a
b=c
d
a
b cd
MF
1
MF
5
MF
2
a
b c
d
MF
K
a
b
Figure 2: General architecture of the shape-similarity method.
0
1
0.17
0.33
0.83
0.67
0.5
Extremely
Short
Very Short Short Medium Long
Extremely
Long
Very Long
ES VS S M L VL EL
Figure 3: Linguistic term-set S
length
represented by trian-
gular membership functions denoting the relative length of
segments on the X-axis.
Positive slope
<0,S> <1,S> <0,EL>
X
Negative slope
High preference level
Low preference level
<+,VS>
<-,ES>
+
_
0
1
0
µ(x)
A
Figure 4: Segments of a trapezium and their corresponding
shape-symbolic characters.
{C
1
, . . . ,C
k
}, where each cluster C
j
will be repre-
sented through an array of n characteristics or at-
tributes (a
1j
, . . . , a
nj
) is used.
2.3 A Cohesion Measure for Expert
Preferences
When several clusters of membership functions, rep-
resenting similar expert opinions, are present it is pos-
sible to establish a way to compare them for fur-
ther processing. This paper proposes to use a cohe-
sion measure, which computes the level of togeth-
erness among the membership functions contained
in the cluster. We assume that clusters with a high
level of cohesion are more confident than those with
a lower cohesion level, since they are closer and do
not necessary overlap. On the one hand, we could
think about a cluster that contains one hundred mem-
bership functions representing the same opinion (i.e.,
each of them has the same membership function rep-
resentation) where we graphically expect a group of
membership functions with the highest cohesion (i.e.,
these membership functions will be drawn one over
the other). On the other hand, we could think about
a cluster with the same amount of membership func-
tions where some of them overlap and others are close
enough to be considered similar. The latter scenario
might lead us to graphically identify the boundaries
where all the membership functions are contained,
however this cluster will have a lower cohesion than
the first one. In a decision-making context, the first
scenario is the “ideal case” that might be considered
unrealistic, while the second scenario could guide us
to think about a group of similar opinions where the
degree of similarity might be given by a cohesion
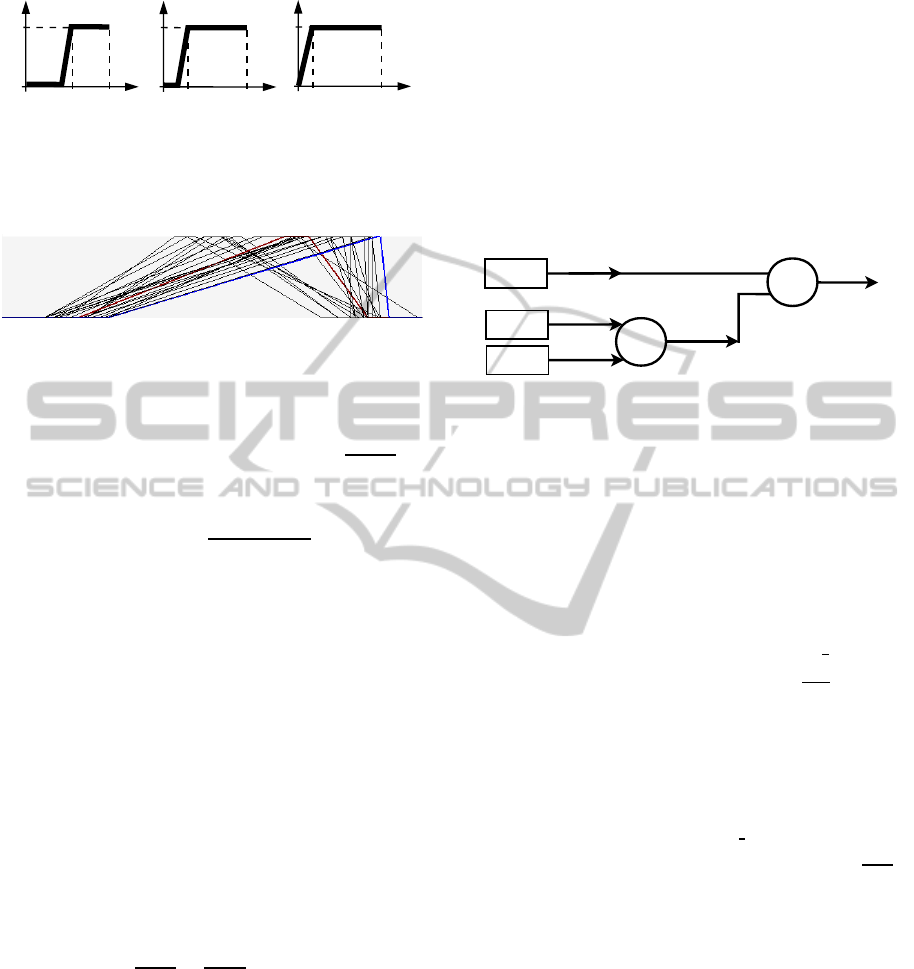
measure. For example, Figure 5 shows two clusters
with different levels of cohesion.
There are several strategies to compute the level
of togetherness or cohesion among the membership
Cluster 30
Cluster 50
Figure 5: C
30
denotes a higher cohesion level than C
50
.
EvaluatingRelevantOpinionswithinaLargeGroup
79

functions contained in a cluster that might be consid-
ered. In (Tapia-Rosero and De Tr´e, 2013) two of them
have been proposed, however in this paper we will
only consider the geometrical approach. The geomet-
rical approach takes into account the area contained
between the upper and lower boundaries compared to
the total available area (Figure 6).
<0,S> <1,S> <0,EL>
X
<+,VS> <-,ES>
µ(x)
A
Figure 6: Area contained between boundaries (dark gray)
compared to the available area (light gray).
Equation 2 sets a general form to obtain the cohe-
sion measure in cluster C
j
with threshold τ based on
these area comparisons.
cohesion(C
j
, τ) = 1−
A
U
− A
L
A
T
. (2)
Hereby, A
U
denotes the area under the upper
bound, A
L
denotes the area under the lower bound and
A
T
corresponds to the total present area. For illustra-
tion purposes, the computed cohesion for clusters (us-
ing Equation 2) C
30
and C
50
with τ = 0.95 are 0.9350
and 0.7547 respectively.
3 LOGIC SCORING OF
PREFERENCE METHOD
Within this paper, the logic scoring of preference
(LSP) method is used to evaluate relevant opinions
considering, as mentioned in Section 2.2, that a set
of k clusters C
τ
= {C
1
, . . . ,C
k
} were previously ob-
tained. Here, each cluster C
j
is represented through
an array of n attributes a
i, j
where i is the identifier of
the attribute and j is the identifier of the cluster.
The LSP method consists of a set of in-
put attributes and elementary criteria reflecting the
decision-maker’s point of view on these attributes.
The main advantage lies in that it is possible to build a
precise model of logic aggregation of preferences, by
combining the proper aggregationoperators reflecting
the user’s needs (Dujmovi´c and Nagashima, 2006). In
order to proceed with the evaluation, the LSP method
has the following steps:
1) Considering the decision-maker’s point of view, it
is necessary to define his/her evaluation attributes.
Evaluation of
Relevant Opinions
Cohesion (1)
Representativeness (2)
Number of membership functions (2.1)
Number of noticeable opinions (2.2)
Figure 7: Example of a system attribute tree for evaluating
relevant opinions.
Several attributes can be considered, thus the first
step allows us to create a system attribute tree. In
this step, different characteristics or attributes for
relevant clusters of opinions are stated and hier-
archically structured. For example, if we want to
evaluate relevant opinions the decision-maker can
use the structure shown in Figure 7.
The leaves of the tree represent the elementary at-
tributes (a
1, j
, . . . , a
n, j
) of cluster C
j
. These are
not further decomposed, they have been previ-
ously measured and they are ready to be eval-
uated. Notice that an intermediate node (e.g.
Representativeness), depicts that the attribute has
been decomposed in more elementary attributes
(i.e., number of membership functions and num-
ber of noticeable opinions).
For the sake of readability, the elementary at-
tributes of Figure 7 include their identifiers in
parenthesis, i.e. the identifiers for cohesion, num-
ber of membership functions and number of no-
ticeable opinions are 1, 2.1 and 2.2 respectively.
2) The evaluation of the elementary attributes is
based on their level of satisfaction or preference.
Thus, the second step is to define the elementary
criteria, through functions G
i
that determine the
elementary preference score reflecting the accept-
able and unacceptable values of attribute i. In this
step, a fuzzy set for each elementary attribute is
used to represent the decision-maker’s preference.
For example, Figure 8 shows a membership func-
tion representing that the decision-maker accepts
clusters with cohesion ≥ 0.5 but he/she prefers
cohesion ≥ 0.6. Furthermore, the decision-maker
considers that lower values, i.e. cohesion < 0.5,
are not acceptable.
Thus, elementary criteria might be expressed us-
ing piecewise linear approximations of functions
X
0
1
0.5 0.60 1
P (x)
c
Figure 8: Example of the decision-maker’s preference for
elementary attribute “cohesion”.
FCTA2014-InternationalConferenceonFuzzyComputationTheoryandApplications
80

where after defining certain dividing points be-
tween segments (i.e., parameters a, b, c and d), we
could use linear interpolation between them. As
it has been mentioned in (Dujmovi´c et al., 2010)
“this approach yields a good combination of sim-
plicity and accuracy”.
Once all the elementary criteria G have been de-
fined, it is possible to evaluate all the attributes in
each cluster. Thus, e
i, j
= g
i
(a
i, j
) corresponds to
the evaluation of attribute i in cluster C
j
. For ex-
ample, given a
1,30
= 0.9350 which corresponds to
the cohesion of cluster C
30
we obtain e
1,30
= 1 ac-
cording to the decision-maker’s preference (Fig-
ure 8).
3) In order to satisfy all the decision-maker’s
preferences we need to create an aggregation
structure, which establishes the proper aggre-
gation operators based on the generalized con-
junction/disjunction (GCD) principle (Dujmovi´c,
2007) while being consistent with the previously
created system attribute tree.
For example, in order to obtain the representa-
tiveness of cluster C
j
it is necessary to take into
account its components (i.e., attributes a
2.1, j
and
a
2.2, j
) and the level of simultaneity or replaceabil-
ity among them. Figure 9 shows the aforemen-
tioned representativeness annotated as e
2, j
. In a
similar way, we will obtain the evaluation of rel-
evant opinions for cluster C
j
given by e
j
, where
we need to aggregate its components e
1, j
and e
2, j
.
The level of simultaneity or replaceability will be
given by the proper selection of the aggregation
operators represented as A in this Figure.
In this paper, the aggregation structure allows us
to obtain the evaluation of relevant opinions e
j
for
cluster j. However, to create this structure with
the appropriate selection of aggregation operators
it is necessary to introduce the generalized con-
junction/disjunction principle in the next section.
A
e
g
a
1,j
e
1,j
1
A
e
2,j
g
a
2.1,j
e
2.1,j
2.1
g
a
2.2,j
e
2.2,j
2.2
j
Figure 9: Example of the aggregation structure for elemen-
tary attributes 1, 2.1 and 2.2 of cluster C
j
.
3.1 Generalized
Conjunction/Disjunction
The generalized conjunction disjunction (GCD) oper-
ator is a continuous logic function that integrates con-
junctive and disjunctive properties in a single func-
tion (Dujmovi´c and Larsen, 2007), denoted as y =
x
1
♦. . . ♦x
n
, x
i
∈ I = [0, 1], i = 1, . . . , n, and y ∈ I.
GCD includes two parameters: the andness and the
orness. The andness, α ∈ I, expresses the conjunction
degree used to denote simultaneity while the orness,
ω ∈ I, expresses the disjunction degree (Dujmovi´c
and Nagashima, 2006) used to denote replaceability.
These parameters are complementary, i.e., α+ ω = 1.
The location of GCD with respect to conjunction and
disjunction is defined in (Dujmovi´c and Nagashima,
2006) as follows:
x
1
♦. . . ♦x
n
= ω(x
1
∨ ··· ∨ x
n
) + α(x
1
∧ ··· ∧ x
n
)
If α > 0.5 > ω, the expression x
1
♦. . . ♦x
n
is called partial conjunction and is denoted by
x
1
∆. . . ∆x
n
. If α < 0.5 < ω, the expression
x
1
♦. . . ♦x
n
is called partial disjunction and is de-
noted by x
1
∇. . . ∇x
n
. If α = ω = 0.5, the expression
x
1
♦. . . ♦x
n
is called the neutrality function, which is
implemented as the arithmetic mean and is denoted
by x
1
⊖ · ·· ⊖ x
n
.
Although GCD can be implemented in sev-
eral ways (Dujmovi´c, 2008), within this paper we
will only consider an implementation based on the
weighted power means (WPM) as follows:
x
1
♦. . . ♦x
n
= (W
1
x
1
r
+ · ·· +W
n
x
n
r
)
1
r
, (3)
hereby W
i
denotes the weight assigned to the parame-
ter x
i
and the parameter r can be computed as a func-
tion of andness α using a suitable numerical approxi-
mation (Dujmovi´c, 2007).
Table 1 includes the corresponding orness, and-
ness and exponent r for 17 levels of GCD imple-
mented using WPM as a reference. Notice that sym-
bols D and C correspond to full disjunction (ω = 1),
and full conjunction (α = 1) respectively.
3.2 GCD Verbalized Approach
The GCD verbalized approach presented in (Duj-
movi´c, 2012) facilitates the use of the LSP method.
Within this approach the decision-maker specifies the
overall degree of importance using a multi-level over-
all importance scale (Table 2) for each attribute.
The multi-leveloverall importance scale has L lev-
els from “lowest” to “highest”, denoted S for simul-
taneity and R for replaceability. Thus, the decision-
maker should provide the overall importance and the
selection of simultaneity or replaceability. This infor-
mation will allow us to obtain the appropriate aggre-
gator.
EvaluatingRelevantOpinionswithinaLargeGroup
81

Table 1: Aggregation operators for 17 levels of GCD imple-
mented by WPM.
Symbol Orness(ω) Andness(α) Exponent r
D 1 0 +∞
D++ 0.9375 0.0625 20.63
D+ 0.8750 0.1250 9.521
D+- 0.8125 0.1875 5.802
DA 0.7500 0.2500 3.929
D-+ 0.6875 0.3125 2.792
D- 0.6250 0.3750 2.018
D– 0.5625 0.4375 1.449
A 0.5 0.5 1
C– 0.4375 0.5625 0.619
C- 0.3750 0.6250 0.261
C-+ 0.3125 0.6875 -0.148
CA 0.2500 0.7500 -0.72
C+- 0.1875 0.8125 -1.655
C+ 0.1250 0.8750 -3.510
C++ 0.0625 0.9375 -9.06
C 0 1 −∞
Table 2: Overall importance scale with L = 16 levels.
Level Overall importance
16 Highest
15 Slightly below highest
14 Very high
13 Slightly above high
12 High
11 Slightly below high
10 Medium-high
9 Slightly above medium
8 Medium
... ...
0 Lowest
In the case of n attributes of overall importance,
(S
1
, . . . , S
n
) for simultaneity, the andness α is defined
as the mean normalized overall importance:
α =
(S
1
+ · ·· + S
n
)
nL
, S
i
∈ [0, L] (4)
In a similar way in the case of replaceability
(R
1
, . . . , R
n
), the orness ω is defined as:
ω =
(R
1
+ · ·· + R
n
)
nL
, R
i
∈ [0, L] (5)
Within this paper, clusters with a large number of
membership functions are considered to be important,
but a cluster with a single membership function given
by a noticeable expert might also be relevant. In this
case, the representativeness of the cluster indicates re-
placeability among the number of membership func-
tions and the number of noticeable represented opin-
ions. For example, if the decision-maker considers
that the “representativeness” of a cluster is given by
the number of membership functions (R
1
considered
as very high) and the number of noticeable opinions
(R
2
considered as high), the computation of the orness
level is as follows:
ω =
(R
1
+ R
2
)
nL
=
14+ 12
2(16)
= 0.8125. (6)
Once the level of andness/orness have been given
by the decision-maker,we need to map these into nor-
malized weights W
1
+ · ·· + W
n
= 1. Although it is
possible to use the GCD verbalized approach to com-
pute the weights with ease (Dujmovi´c, 2012), within
this paper we consider that these will be given by the
decision-maker as well. For example, in the case that
the decision-maker considers the representativeness
components equally important, then both weights are
0.5.
The generalized conjunction/disjunction aggrega-
tion adequately reflects the reasoning and preferences
of the decision-maker and it is possible to extend it
with ease, i.e. through changes in the model. In this
paper GDC aggregation principle is used to create
the aggregation structure of the LSP method (step 3)
where the attributes have been evaluated and aggre-
gated taking into account the decision-maker’s pref-
erences.
4 EVALUATING RELEVANT
OPINIONS
The aim of this section is to describe the steps that
allows us to distinguish clusters that are relevant to
represent expert opinions in a group decision-making
context, where these have been gathered through so-
cial media. Here, the main contribution is to provide a
method to handle and model the importance of opin-
ions from the decision maker’s point of view, includ-
ing as a novelty the application of LSP reflecting as-
pects of human decision-making.
On the assumption that similar opinions have been
clustered by a shape based approach and that cer-
tain attributes of each cluster are available, we ask
the decision-maker for his/her preferences to reflect
his/her point of view in the selection of relevant opin-
ions. Thus, the steps to evaluate relevant opinions us-
ing LSP are described as follows (Figure 10):
1. Creation of a system attribute tree made by the
decision-maker based on the available attributes
of the cluster. The attributes are hierarchically or-
ganized, where the leaves of the tree correspond to
the elementary attributes selected from the cluster
FCTA2014-InternationalConferenceonFuzzyComputationTheoryandApplications
82
...
e
1,1
A
e
g
a
1,1
e
1,1
1
A
e
2,1
g
a
2.1,1
e
2.1,1
2.1
g
a
2.2,1
e
2.2,1
2.2
1
e
1,k
A
e
g
a
1,k
e
1,k
1
A
e
2,k
g
a
2.1,k
e
2.1,k
2.1
g
a
2.2,k
e
2.2,k
2.2
k
...
G
C
1
C
k
...
...
C
30
C
68
C
51
C
37
C
0
Selection
of Relevant
Clusters
Step 1 Step 2 Step 3 Step 4
Decision-Maker’s Preferences
1
0
0
X
P (x)
d
1
0
0
X
P (x)
c
1
0
0
X
P (x)
m
Figure 10: Evaluation of relevant opinions from clusters grouped by shape-similarity.
and the root will lead us to the overall evaluation
value.
2. Definition of elementary criteria to reflect the ac-
ceptable and unacceptable values for each ele-
mentary attribute. These will be given by the
decision-maker as membership functions.
3. Creation of an aggregation structure using the
GCD verbalized approach. This step allows us to
obtain the aggregation operators and weights re-
flecting the decision-maker’s point of view with
ease.
4. Selection of relevant clusters based on the top
overall evaluation values.
For illustration purposes, the aforementioned
steps will be described using the following example.
A company wants to know the perceived“level of use-
fulness” of adding a digital lock (new feature) in a
previously well positioned suitcase model (product),
from a not uniform crowd (i.e., a large group of opin-
ions with different points of view). Therefore, the
company gathered this information using a fan page
of the original product. In this case, the non unifor-
mity of opinions is given by different levels of knowl-
edge, areas of expertise and personal profiles. In this
example, the head of the design department acts as the
decision-maker.
The decision-maker considers that all the opin-
ions are important, but those given by a specific pro-
file (i.e., frequent flyers) will be considered notice-
able. Additionally, he considers opinions within a
large group relevant.
The opinions about the “level of usefulness”
were clustered by the shape-similarity method pre-
sented in Section 2.2 under the assumption that sim-
ilarly shaped membership functions represent simi-
lar opinions. Hereby, a set of k = 50 clusters C =
{C
1
, . . . ,C
50
} have been obtained representing a total
of t = 120 opinions. For each cluster C
j
the cohesion
measure a
1, j
(cf. Equation 2), the number of mem-
bership functions a
2.1, j
, and the number of noticeable
opinions a
2.2, j
are computed.
Step 1. The decision-maker’s point of view, is re-
flected in the system attribute tree shown in Figure 11.
Evaluation of
Relevant Opinions
Cohesion (1)
Representativeness (2)
Number of membership functions (2.1)
Number of noticeable opinions (2.2)
Figure 11: System attribute tree for evaluating relevant
opinions within a large group.
This system attribute tree establishes that the rep-
resentativeness of the cluster is given by a combina-
tion of the number of membership functions and the
number of noticeable opinions. In a similar way, it
is indicated that the evaluation of relevant opinions is
given by the cohesion and the representativeness of
the cluster.
Step 2. The decision-maker’s preferences were
given through trapezoidal membership functions
P
c
(x) for elementary attribute cohesion, P
m
(x) rep-
resenting the number of membership functions and
P
d
(x) for the number of noticeable opinions. These
membership functions are shown in Figure 12.
The aforementioned membership functions reflect
his acceptable and unacceptable values for each el-
ementary attribute. As mentioned in Section 3, we
could obtain his preference for values that lie in the
slopes using a linear approximation.
For example, let us consider cluster C
29
and its at-
EvaluatingRelevantOpinionswithinaLargeGroup
83
1
0
0 0.4 0.6
X
1
P (x)
c
1
0
0 4 5
X
120
P (x)
m
1
0
0 1
X
120
P (x)
d
Figure 12: Decision-maker’s preferences for elementary at-
tributes cohesion P
c
(x), number of membership functions
P
m
(x) and number of noticeable opinions P
d
(x).
Cluster 29
Cohesion: 0.4455 #Membership Functions: 22 #Noticeable Opinions: 0
Figure 13: Cluster C
29
and its attributes.
tributes a
1,29
= 0.4455, a
2.1,29
= 22 and a
2.2,29
= 0
shown in Figure 13. In order to evaluate the cohe-
sion e
1,29
from the decision-maker’s point of view, we
need to interpolate its value using g
1
(x) =
x−0.4
0.6−0.4
, as
follows:
e
1,29
= g
1
(0.4455) =
0.4455 − 0.4
0.6− 0.4
= 0.2275
Within this step, all the attributes of each clus-
ter will be evaluated using their corresponding func-
tion to reflect the decision-maker’s preferences. Thus,
e.g., e
2.1,29
= 1 and e
2.2,29
= 0.
Step 3. In order to build the aggregation struc-
ture it is necessary to select the aggregation opera-
tors properly. In this paper, these will be selected us-
ing the GCD verbalized approach which allows the
decision-maker to use the overall importance scale in
Table 2. In this example, the decision-maker consid-
ers that the cohesion and the representativeness in a
cluster should be simultaneously satisfied. Here, the
importance of each attribute has been established as
follows: The cohesion is “high”(S
1
= 12) and the rep-
resentativeness is “medium high” (S
2
= 10). With this
approach the level of andness α is given by
α =
S
1
+S
2
nL
=
12+10
2(16)
= 0.6875
The obtained α value allows us to note that even
though the cohesion and the representativenessshould
be simultaneously satisfied, the level of andness is not
too high. Thus the minimal partial conjunction where
both parameters are mandatory is used. In a similar
way the aggregation operator for the representative-
ness is obtained as shown in Equation (6) where the
level of orness ω is 0.8125. These aggregators are
annotated by symbols C − + and D + −, and using
Table 1 we obtained the r exponents -0.148 and 5.802
respectively.
Next, the decision-maker has to select the weight
of each attribute denoting its importance. For in-
stance, if the cohesion is two times more important
than the representativeness then the weights for these
attributes are W
1
= 0.67 and W
2
= 0.33 respectively.
In a similar way, if the components for the represen-
tativeness are equally important then their weights are
0.5 (i.e., W
2.1
= W
2.2
= 0.5). Hence, the aggregation
structure to evaluate relevant opinions within a large
group, including the weight of each attribute, is shown
in Figure 14.
0.33
e
g
0.67
1
g
0.5
2.1
g
0.5
2.2
D+-
C-+
Figure 14: Aggregation structure based on the decision-
maker’s point of view.
Using the previously obtained aggregation struc-
ture we obtain a single value representing the overall
evaluation of relevant opinions for each cluster (Equa-
tion 3). For illustration purposes, let us compute the
overall evaluation of relevant opinions for cluster C
29
.
First, let us evaluate its representativeness given the
selected aggregator D+ −.
e
2,29
= (0.5(e
2.1,29
)
r
+ 0.5(e
2.2,29
)
r
)
1
r
e
2,29
= (0.5(1)
5.802
+ 0.5(0)
5.802
)
1
5.802
e
2,29
= 0.887393
Then, in a similar way, using aggregatorC− + we
will compute the overall evaluation of relevant opin-
ions as follows:
e
29
= (0.67(e
1,29
)
r
+ 0.3(e
2,29
)
r
)
1
r
e
29
= (0.67(0.2275)
−0.148
+ 0.3(0.88739)
−0.148
)
1
−0.148
e
29
= 0.34610
Thus, the evaluation of cluster C
29
is given by the
previously obtained value.
Notice, that using this approach it is possible
to easily change the input parameters, given by
the decision-maker, in order to accurately represent
his/her point of view. For example, if the decision-
maker would have changed the given weights (i.e.,
33% for cohesion and 67% for representativeness) in
the aggregation structure, the overall evaluation value
would have been 0.5490246.
Step 4. In this step, the purpose of selecting rel-
evant clusters is based on the selection made by the
decision-maker from the previously evaluated clus-
ters. It is possible that some decision-makers select
FCTA2014-InternationalConferenceonFuzzyComputationTheoryandApplications
84

only the cluster with the best evaluation, i.e. the high-
est value, while other decision-makers prefer to select
a group of the top clusters. Within this example, the
decision-maker had selected the “top 5” clusters rep-
resenting relevant opinions from his point of view.
It is worth to mention that within this example, the
decision-maker started with 120 opinions gathered
from social-media that were grouped into 50 clusters.
Processing these clusters based on this proposal, al-
lowed the decision-maker to select the top 5 clusters
representing relevant opinions taking into account the
cohesion and the representativeness of the clusters.
One of the advantages of the presented approach
is that the flexibility in the LSP method allows the
decision-maker, changing the definition of elemen-
tary criteria, in order to select relevant opinions that
best suits his/her point of view. One remark within
this respect is that the number of noticeable opin-
ions, considered as a component of the representa-
tiveness, might be extended in order to represent dif-
ferent levels of importance (e.g., low, intermediate,
high, etc.) among experts. In this case, it is possible
to assign different weights to each expert opinion and
its normalization will become part of the criteria def-
inition. In a similar way the number of membership
functions could be replaced by the relative number of
membership functions, considering the total number
of present opinions.
In order to validate the results of this proposal, five
experts of the soft-computingarea, were asked to rank
a small selection of clusters (i.e., eight clusters from
the original group of 50) based on the cohesion and
the number of membership functions. Here, all the ex-
perts had the same selection for the top 4 and the clus-
ter with the lowest overall evaluation, but the order
of the other intermediate clusters were slightly differ-
ent. Based on the computation described in this pro-
posal, those intermediate clusters had a slightly differ-
ent value in the overall evaluation, which justifies the
small differences among the experts. However, more
elaborated experiments should be performed, and are
subject of further study.
5 CONCLUSIONS
This paper proposed to evaluate relevant opinions
within a large number of expert opinions, expressed
as membership functions, that might be gathered
through social media. A shape-similarity method is
used to cluster similar preferences in order to reduce
the number of evaluations for different points of view.
The evaluation results from selecting the best combi-
nation of cohesion and representativeness in the avail-
able clusters from the decision-maker’s point of view.
The cohesion is a measure obtained from computing
the area among the upper and lower bounds of the
cluster compared to the total available area, while its
representativeness is given by aggregating the num-
ber of membership functions and the number of no-
ticeable opinions. In order to properly reflect the
decision-maker’s point of view this proposal uses the
LSP method that buildsa precise representativemodel
of logic aggregation of preferences.
The main advantage of this proposal is that it can
handle a large group of opinions gathered through
social media, where the preferences initially given
are not modified. Furthermore, it evaluates different
points of view separately (i.e., previously clustered)
and it permits the decision-maker to select the group
of opinions that best suits his/her choice (i.e., given as
preferences in the LSP method) based on the combi-
nation of some cluster profile characteristics. Within
this paper the cluster characteristics or attributes are a
cohesion measure, the relative number of membership
functions and the number of noticeable opinions.
We consider exploring some crowdsourceapplica-
tions as opportunities for future work, and evaluating
clusters of opinions with different strategies in order
to compare them with the presented approach are sub-
ject to further study as well.
ACKNOWLEDGEMENTS
This research is supported by Escuela Superior
Polit´ecnica del Litoral (ESPOL) and it is financed by
SENESCYT under Ph.D. studies 2014.
REFERENCES
Cabrerizo, F. J., Ure˜na, R., Pedrycz, W., and Herrera-
Viedma, E. (2014). Building consensus in group deci-
sion making with an allocation of information granu-
larity. Fuzzy Sets and Systems.
Dubois, D. and Prade, H. (1997). The three semantics of
fuzzy sets. Fuzzy Sets and Systems, 90:141–150.
Dubois, D., P. H. (2000). Fundamentals of Fuzzy Sets (THE
HANDBOOKS OF FUZZY SETS Volume 7). Springer.
Dujmovi´c, J. (2007). Continuous Preference Logic for Sys-
tem Evaluation. IEEE Transactions on Fuzzy Systems,
15(6):1082–1099.
Dujmovi´c, J. (2008). Characteristic forms of generalized
conjunction/disjunction. 2008 IEEE International
Conference on Fuzzy Systems (IEEE World Congress
on Computational Intelligence), pages 1075–1080.
EvaluatingRelevantOpinionswithinaLargeGroup
85

Dujmovi´c, J. (2012). Andness and orness as a mean of over-
all importance. In Fuzzy Systems (FUZZ-IEEE), 2012
IEEE International Conference on, pages 1–6. IEEE.
Dujmovi´c, J. and De Tr´e, G. (2011). Multicriteria meth-
ods and logic aggregation in suitability maps. Inter-
national Journal of Intelligent Systems, 26(10):971–
1001.
Dujmovi´c, J., De Tr´e, G., and Van De Weghe, N. (2010).
LSP suitability maps. Soft Computing, 14(5):421–
434.
Dujmovi´c, J. and Larsen, H. L. (2007). Generalized con-
junction/disjunction. International Journal of Approx-
imate Reasoning, 46(3):423–446.
Dujmovi´c, J. and Nagashima, H. (2006). LSP method and
its use for evaluation of Java IDEs. International Jour-
nal of Approximate Reasoning, 41(1):3–22.
Eshragh, F. t. and Mamdani, E. (1979). A general approach
to linguistic approximation. International Journal of
Man-Machine Studies, 11(4):501–519.
Klir, G. J. and Yuan, B. (1995). Fuzzy Sets and Fuzzy Logic:
Theory and Applications. Prentice Hall.
Pedrycz, W. (2013). Granular Computing: Analysis and
Design of Intelligent Systems. CRC Press.
Tapia-Rosero, A., Bronselaer, A., and De Tr´e, G. (2014). A
method based on shape-similarity for detecting sim-
ilar opinions in group decision-making. Information
Sciences, 258:291–311.
Tapia-Rosero, A. and De Tr´e, G. (2013). A Cohesion
Measure for Expert Preferences in Group Decision-
Making. Systems Research Institute Polish Academy
of Sciences.
FCTA2014-InternationalConferenceonFuzzyComputationTheoryandApplications
86
