
Predicting Wrist Movement Trajectory from Ipsilesional ECoG in
Chronic Stroke Patients
Martin Sp
¨
uler
1
, Wolfgang Rosenstiel
1
and Martin Bogdan
1,2
1
Wilhelm-Schickard-Institute for Computer Science, University of T
¨
ubingen, Sand 13, 72076 T
¨
ubingen, Germany
2
Computer Engineering, University of Leipzig, Augustusplatz 10, 04109 Leipzig, Germany
Keywords:
Brain-Computer Interface (BCI), Brain-Machine Interface (BMI), Stroke, Trajectory Prediction, Electrocor-
ticography (ECoG), Canonical Correlation Analysis (CCA).
Abstract:
Recently, there have been several approaches to utilize a Brain-Computer Interface (BCI) for chronic stroke
patients. The prediction of movement trajectory based on recorded brain activity could thereby help to improve
BCI-guided stroke rehabilitation or could be used for control of an assistive device, like an orthosis or a robotic
arm. One problem in predicting movement trajectory in stroke patients are compensatory movements, which
make it difficult to link specific brain activity to movement intention. In this paper we compare different
methods for trajectory prediction and show how Canonical Correlation Analysis (CCA) can be used to predict
movement trajectories. Based on the results, we argue that the resulting trajectory prediction is closer to
the actual movement intention. We further show how the transformation matrices obtained by CCA can be
interpreted and discuss how this interpretation might be useful to get information regarding compensatory
movements in stroke and the underlying patterns of brain activity.
1 INTRODUCTION
More than 80 % of the patients surviving a stroke are
affected by hemiparesis (Cramer et al., 1997) and in
30 % to 66 % of those hemiparetic stroke patients
the paretic arm remains without function when mea-
sured 6 months after stroke (Kwakkel et al., 2003).
Brain-Computer Interface (BCI) technology might
help those patients either by using a BCI as an assis-
tive device to compensate the missing motor function
(Yanagisawa et al., 2011) or as a tool for rehabilita-
tion.
The use of BCI for stroke rehabilitation has been
particularly prominent in the last time (Buch et al.,
2008; Broetz et al., 2010; Ramos-Murguialday et al.,
2013; Sp
¨
uler et al., 2014). In this neurorehabilitation
approach, the patients’ intention to move is coupled
with haptic feedback given through an orthosis mov-
ing the paretic limb (Buch et al., 2008). Since the
connection between the sensorimotor cortex and the
peripheral muscles is disrupted by stroke, a coinci-
dent activation of the primary motor cortex and the
sensory feedback loop may induce Hebbian plasticity
and thus support functional recovery (Silvoni et al.,
2011).
Stroke patients tend to perform compensatory
movements (Cirstea and Levin, 2000), which can be a
problem when using BCI feedback for stroke rehabili-
tation, since compensatory movements produce brain
activity which is unrelated to the intended movement
(Lee et al., 2009) but inadvertently influences BCI
feedback. Therefore it would be beneficial if brain
activity related to compensatory movements could be
separated from the activity related to the intended
movement and only activity related to the intended
movement is feedbacked by the BCI.
In this paper we evaluate different methods for
the prediction of wrist movement trajectory based
on ipsilesional Electrocorticography (ECoG) data in
chronic stroke patients. A special emphasis is given
on the use of Canonical Correlation Analysis (CCA)
for this purpose. While CCA has been previously
used for SSVEP BCIs (Bin et al., 2009), c-VEP BCIs
(Sp
¨
uler et al., 2012), as well as general spatial filtering
method for classification of evoked or event-related
potentials (Sp
¨
uler et al., 2013), we show in this paper
how it can also be used for trajectory prediction and
extraction of movement components from the trajec-
tory data, which may help to feedback brain activity
related to the true movement intention.
38
Spüler M., Rosenstiel W. and Bogdan M..
Predicting Wrist Movement Trajectory from Ipsilesional ECoG in Chronic Stroke Patients.
DOI: 10.5220/0005165200380045
In Proceedings of the 2nd International Congress on Neurotechnology, Electronics and Informatics (NEUROTECHNIX-2014), pages 38-45
ISBN: 978-989-758-056-7
Copyright
c
2014 SCITEPRESS (Science and Technology Publications, Lda.)

2 METHODS
In this section we describe the methods we evalu-
ated for the prediction of the movement trajectory, the
evaluation process itself, as well as the ECoG data
used for evaluation.
Since the use of Canonical Correlation Analysis
yields some particularly interesting results, we will
explain the CCA method and its application in more
detail.
2.1 Canonical Correlation Analysis
(CCA)
CCA is a multivariate statistical method developed
by H. Hotelling (Hotelling, 1936). When having
two datasets, which may have some underlying cor-
relations, CCA can be used to find linear transfor-
mations for these two datasets, which maximize the
correlation between the transformed datasets. As-
suming there are two multidimensional datasets X
and Y with p variables in X = (X
1
, X
2
, ..., X
p
)
T
and
q ≤ p variables in Y = (Y
1
,Y
2
, ...,Y
q
)
T
and their trans-
formed datasets U = W
T
x
X = (U
1
,U
2
, ...,U
q
)
T
and
V = W
T
y
Y = (V
1
,V
2
, ...,V
q
)
T
. CCA can be used to
find the two transformations W
x
and W
y
, which maxi-
mize the canonical correlation ρ
∗
i
between the canon-
ical variables U
i
and V
i
.
ρ
∗
i
=
cov(U
i
,V
i
)
p
var(U
i
)var(V
i
)
(1)
The linear transformations W
x
and W
y
are selected
so that their variance equals one, while they are un-
correlated to all other canonical variables.
var(U
i
) = var(V
i
) = 1 (2)
cov(U
i
,V
j
) = cov(U
j
,V
i
) = 0 , ∀i 6= j (3)
2.1.1 CCA and Linear Regression
A traditional regression can be formulated as having
a multidimensional dataset X with dimensions n × p
containing n observations of p variables and another
dataset Y with dimensions n × 1 containing the de-
pendent variable. A linear regression tries to model
the relationship between X and Y by finding a weight
vector W with dimensions p ×1 so that
Y
i
= X
i
W + ε
i
(4)
with ε
i
being the error term which should be minimal.
Thereby one can use W to predict Y
0
based on the
observations contained in X.
Y
0
= XW (5)
In the case of an ordinary least squares regression,
this problem is solved by finding a W that minimizes
the sum of the squared differences between the pre-
dicted Y
0
and the observed Y . With
k
·
k
being the eu-
clidean distance, the problem can be written as:
minkY −Y
0
k
2
= kXW −Y
0
k
2
(6)
CCA can also be used to solve a regression prob-
lem. Applying CCA to X and Y , the method tries to
find a transformation W
x
that maximized the correla-
tion
ρ =
W
T
x
XY
T
W
y
q
(W
T
x
XX
T
W
x
)(W
T
y
YY
T
W
y
)
(7)
The results is W
x
being a weight vector with dimen-
sions p × 1 and W
y
being a scalar, which can be used
to predict Y with
Y
0
= XW ·W
y
−1
(8)
Since CCA only maximizes the correlation, CCA can
only be used for regression methods under the con-
dition that X and Y have a mean of 0. If this condi-
tion holds, CCA delivers results similar to other linear
regression, as we will see later in this paper. Rela-
tionships between least squares and CCA have been
established earlier in the literature. (Hastie et al.,
1995) found CCA to be equivalent to Fisher Linear
Discriment Analysis in a binary-class case, which in
turn was found to be equivalent to CCA in this case
(Bishop et al., 2006). (Sun et al., 2008) showed
that CCA can be formulated as least squares problem
which can be used to introduce regularized CCA and
sparse CCA (using L1-norm regularization).
2.1.2 CCA and Component Analysis
While we have shown the relationship between CCA
and linear (least squares) regression, there is also
a distinct relationship between CCA and methods
for component analysis like independent component
analysis (ICA) and principal component analysis
(PCA).
If CCA is used with a multidimensional dataset
Y , the resulting transformation matrix W
y
can be used
as transformation matrix that separates the dataset Y
in different components (called canonical variables
in the context of CCA). Due to the constraints how
CCA selects W
y
(see equations 2 and 3), the result-
ing components are uncorrelated, which is also the
case for ICA and PCA. Therefore, CCA can be seen
as a method that extracts components V from Y, with
the components V being maximally correlated to U =
W
T
x
X.
PredictingWristMovementTrajectoryfromIpsilesionalECoGinChronicStrokePatients
39

Figure 1: Locations of the epidurally implanted ECoG electrodes. Patients were implanted with 4 strips with 4 electrodes
each. MRI images are reproduced from a previous publication (Walter et al., 2012).
Table 1: Demographic data for the three chronic stroke pa-
tients: Age, Sex, Fugl-Meyer Score for upper extremity
(FMA, max 30), wrist (FMB, max 10), hand (FMC, max
14) and the time since insult (TSI) in month.
Patient Age Sex FMA FMB FMC TSI
P1 63 f 9 0 0 71
P2 56 m 19 3 1 80
P3 52 m 13 6 2 159
2.2 ECoG Data
2.2.1 Patient Description
The ECoG data used in this study was recorded from
3 patients who suffered from left-sided chronic hand-
paresis due to stroke. The patients took part in a long-
term investigational study for motor cortex stimula-
tion with epidural implants concurrent to rehabilita-
tion training to improve upper limb motor function
after stroke. The study protocol was approved by the
local ethics committee (Faculty of Medicine, Univer-
sity Hospital T
¨
ubingen) and included an initial four
week evaluation period immediately after implanta-
tion of the ECoG grids to investigate patients individ-
ual cortical physiology for optimization of stimula-
tion location and paradigms. An overview of the pa-
tients’ demographic data and the Fugl-Meyer scores
(Fugl-Meyer et al., 1975) for wrist movement (FMB)
are shown in table 1.
Each of the 3 patients was epidurally implanted
with 16 platinum disk electrodes (Medtronic, Inc.)
with a diameter of 4 mm, which were arranged in 4
strips with 4 electrodes each. The strips were placed
in a grid-like fashion with a center-to-center distance
of 1 cm. Although technically these are 4 strips, we
will refer to it as one grid. These grids were placed
above the hand area of the ipsilesional motor cortex
and also covered premotor and sensory areas. The
location of the grids are shown in figure 1. More
detailed information about the patients can be found
in a previous publication (Walter et al., 2012). Data
recorded during that evaluation period was used for
the evaluation of the method presented in this paper.
2.2.2 Task Description
During the aforementioned evaluation period, the pa-
tients also participated in a robot-assisted stroke reha-
bilitation program and ECoG data was recorded dur-
ing the performed exercises. Each of the patients par-
ticipated in 10 to 20 sessions performed on differ-
ent days in which they had to repeat wrist extension
and wrist flexion several times using their paretic arm.
NEUROTECHNIX2014-InternationalCongressonNeurotechnology,ElectronicsandInformatics
40

On average 8 minutes of wrist extension/flexion were
recorded per session.
The degree to which the patients were able to
perform extension/flexion varied, but movement was
supported by an upper limb rehabilitation robot (Ho-
coma Armeo Spring), which removed gravitational
effects. Further, the robot allowed movement along
7 degrees of freedom (DOF) with the angle of the 7
joints being constantly recorded.
Although the patients were instructed to do a wrist
extension/flexion (needing only 1 DOF), movement
along several DOF was visible due to coactivation
and compensatory movements resulting from stroke.
Therefore, the performed (and recorded) trajectory
not matches the actual intended movement trajectory
and also there is a movement trajectory present for the
other DOF, where no movement was intended.
2.3 Data Processing and Feature
Extraction
ECoG signals were recorded with Brainamp DC
(Brain Products GmbH, Munich, Germany) ampli-
fiers at a sampling rate of 1000 Hz and a high-pass
filter at 0.16 Hz. After recording, the signal was re-
referenced to the common average and a notch filter
at 50 Hz was applied to filter out power line noise. To
estimate the power spectrum we used the maximum
entropy method (Burg, 1967) with a model order of
50. The power spectrum was estimated for each chan-
nel in the range from 1 to 500 Hz with a bin width of
4 Hz and the logarithm function was applied to each
value.
To reduce dimensionality of the input space, we
performed a feature selection based on R
2
values
(Sp
¨
uler et al., 2011) and selected the 50 features
which had the highest values. In the end, those fea-
tures served as input to train a model (using either a
regression method or CCA) to predict movement tra-
jectory.
2.4 Trajectory Prediction
To evaluate which method is suited best for prediction
of movement trajectory, we used the following five
methods:
1. (L1 reg) Lasso regression: Linear regression with
L1 Norm regularisation using the regularisation
parameter λ = 0.1.
2. (L2 reg) Ridge regression: Linear regression with
L2 Norm regularisation using the regularisation
parameter λ = 0.1.
3. (SVR) Support Vector Regression with a linear
kernel or a radial basis function (RBF) kernel.
For implementation we used LibSVM (Chang and
Lin, 2011) with default kernel parameters and the
hyperparameter C=1.
4. (CCA) Canonical Correlation Analysis for the
prediction of movement components. A more de-
tailed explanation how we applied CCA will be
presented later (see section 2.4.1).
5. (PCA + L2 reg) Since CCA was not used to
predict the actual wrist movement trajectory, but
to predict movement components identified by
CCA, we also used Principal Component Analysis
(PCA) (Dunteman, 1989) on the recorded move-
ment data (7 degrees of freedom) to obtain move-
ment components that better match the movement
intention of the stroke patients. The principal
components with the highest variance was used
for trajectory prediction by using a ridge regres-
sion as explained previously.
2.4.1 CCA to Predict Movement Components
Based on ECoG Data
We have previously shown that the calculation of W
x
can be seen as a linear regression, where W
x
is used
to predict a variable. We have also shown that the
calculation of W
y
can be seen as a form of component
analysis, where CCA transforms the dataset Y into un-
correlated components. When both datasets X and Y
are multidimensional both aspects have to be consid-
ered and the application of CCA can be seen as an
extraction of components and a regression to predict
those components. Both is done by CCA in one step.
When applying CCA to the ECoG data (as X) and
movement trajectory data (as Y ), we can use CCA to
find movement components in the trajectory data and
do a regression to predict those movement compo-
nents based on the ECoG data. The reasoning behind
this approach is that the performed (and recorded)
trajectory differs from intended movement trajectory
due to compensatory movements and the stroke pa-
tients not being able to properly perform the intended
movement. With the extraction of trajectory compo-
nents, we hope to find components which are closer
to the actual intended movement trajectory. In this
work we always used the first component extracted
by CCA.
2.5 Performance Evaluation
To evaluate the performance of the different meth-
ods for trajectory prediction, we used a 5-fold cross-
validation procedure to make sure that training and
PredictingWristMovementTrajectoryfromIpsilesionalECoGinChronicStrokePatients
41
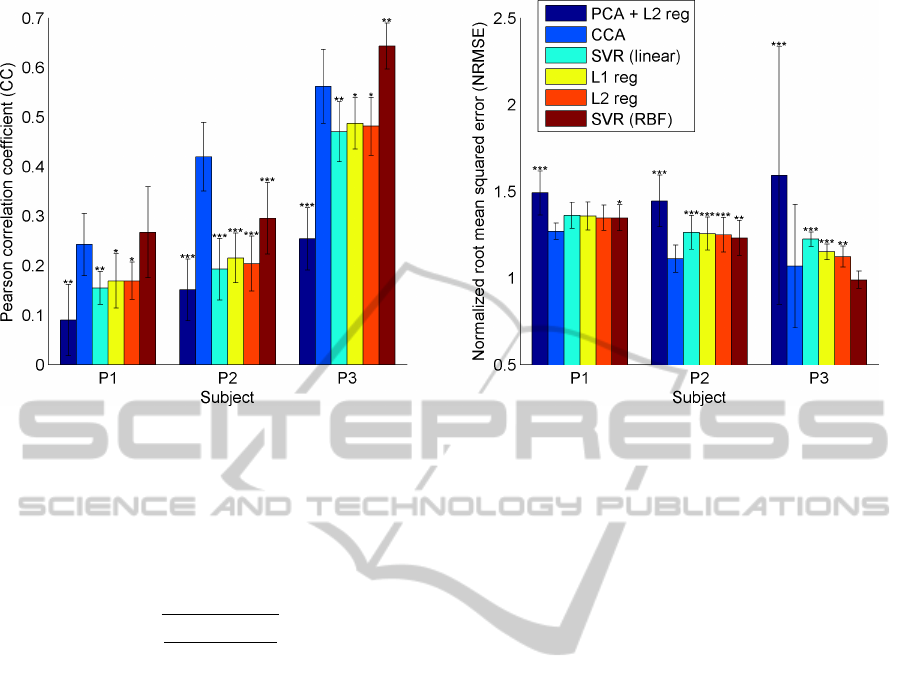
Figure 2: Performance (NRMSE and CC) for different methods for trajectory prediction averaged over all sessions for one
subject. The error bars indicate the standard deviation. Asteriks denote if there is a significant difference between the method
and CCA, with
∗
p < 0.05,
∗∗
p < 0.01,
∗∗∗
p < 0.001 (Wilcoxon ranksum test).
test data do not overlap. To quantify the performance
of the methods, we used Pearson’s correlation coeffi-
cient (CC) an the normalized root mean squared error
(NRMSE), which we defined as
NRMSE =
r
∑
n
t=1
( ˆy
t
− y
t
)
2
n
· var(y)
−1
(9)
with y
t
being the actual and ˆy
t
being the predicted
value. var(y) denotes the variance of the actual tra-
jectory. Since the trajectory values are different de-
pending if PCA or CCA are used, the normalization
is important to compare the RMSE between the meth-
ods.
3 RESULTS
3.1 Performance of Trajectory
Prediction
On average CCA performed best with an average
CC = 0.41 and an average NRMSE = 1.15. While
CCA performs consistently better than the other lin-
ear methods, a Support Vector Regression (SVR) with
a RBF-kernel has a significantly (p < 0.01) higher CC
for subject P3. The results are show in figure 2 in
more detailed. For each subject and method, the re-
sults are averaged over all session with the standard
deviation being indicated by error bars and the signif-
icance between each of the methods and CCA being
assessed by a two-sided Wilcoxon ranksum test.
3.2 Interpretation of CCA
Transformation Matrices
Due to the nature of CCA, the transformation matri-
ces W
x
and W
y
could be used for some neurophysio-
logical interpretation of the data. While W
x
is used to
predict the movement trajectory, it shows which elec-
trodes and which frequency ranges are important for
the prediction. Thereby one can infer where (location
and frequency) movement-related activity is present.
W
y
is used to calculate the movement components and
in turn can be used to infer which joints (represented
by the DOFs in our data) are active during an in-
tended wrist movement. This could be used to gain
more knowledge regarding the compensatory move-
ment patterns of stroke patients.
Figure 3 shows the weights using a linear regres-
sion to visualize which electrodes and frequencies are
used to predict the recorded wrist movement trajec-
tory, as well as the recorded and predicted wrist move-
ment trajectory for one exemplary session. Figure 3
also shows the R
2
-values (Sheikh et al., 2003) indicat-
ing which features (electrode × frequency) correlate
best with the trajectory.
Figure 4 shows the weights of the W
x
and W
y
(for
the first movement component) when using CCA on
one exemplary session. As well as the actual and pre-
dicted movement trajectory.
When comparing both figures, the activity pattern
obtained by CCA (figure 4.A) is more localized than
the one obtained by a linear regression (figure 3.A).
Furthermore, the weights of W
y
(figure 4.B) yield in-
NEUROTECHNIX2014-InternationalCongressonNeurotechnology,ElectronicsandInformatics
42
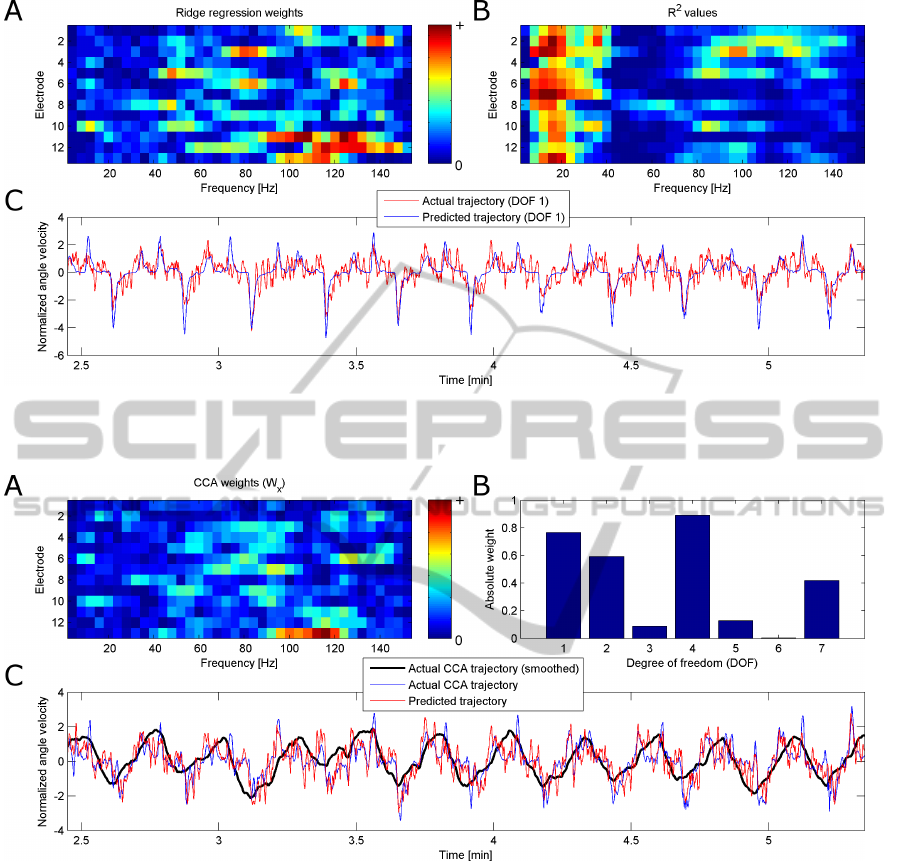
Figure 3: A: Absolute weights from ridge regression for each feature (frequency × electrode) used in trajectory prediction.
B: R
2
values indicating high correlation between each feature and the trajectory C: Actual and predicted trajectory of the
movement component calculated by ridge regression.
Figure 4: A: Absolute weights from CCA for each feature (frequency × electrode) used in trajectory prediction of the first
movement component. B: Absolute weights for each DOF to calculate the movement component. C: Actual and predicted
trajectory of the movement component calculated by CCA. The smoothed trajectory is only shown for better display purposes
and was not used for trajectory prediction or performance evaluation.
formation, which DOFs are affected by the intended
wrist movement, thereby showing the coactivation
pattern present during the intended wrist movement.
Figure 3.C shows the actual and the predicted
wrist movement trajectory using linear regression,
while figure 4.C shows the predicted and actual move-
ment trajectory obtained by CCA. When comparing
the results from CCA with the results using a lin-
ear regression, the trajectory obtained by CCA seems
more noisy but more natural and more representative
of the true intended movement.
4 DISCUSSION
In this paper we have compared different methods
for the trajectory prediction from ECoG in stroke pa-
tients. The fact that ECoG can be used for trajectory
prediction was shown in several studies for subjects
with an intact sensorimotor system. In (Schalk et al.,
2008) average CC were approximately between 0.22
and 0.71, in (Pistohl et al., 2008) CCs between 0.3
and 0.6 were reached and performance in later stud-
ies yielded CCs in a similar range. (Nakanishi et al.,
PredictingWristMovementTrajectoryfromIpsilesionalECoGinChronicStrokePatients
43

2013) have shown that it is also possible to predict
movement trajectory in stroke patients from ipsile-
sional ECoG. With an average CC ranging between
0.44 and 0.73 the performance obtained by Nakan-
ishi et al. is similar to the results obtained in earlier
studies with subjects without motor dysfunction. We
could reproduce this finding in our work and were
able to decode the trajectory with an average CC be-
tween 0.24 and 0.64 depending on the subject, which
is similar to the results by (Nakanishi et al., 2013).
It should be noted that there seems to be a nega-
tive correlation between the Fugl-Meyer (FM) Score
regarding wrist movement and the accuracy of wrist
trajectory prediction, since the patient with the lowest
FM score (indicating a high wrist motor dysfunction)
had the lowest CC and vice versa. Although it seems
reasonable to assume that wrist movement trajectory
is harder to decode for patients whose motor system
is more damaged by stroke, the current dataset (with
only three patients measured) is too small to draw any
significant conclusions.
Regarding the comparison of different prediction
methods for wrist trajectory prediction, we found
CCA and Support Vector Regression (SVR) with an
RBF kernel to perform best. While CCA performed
on average slightly better than SVR, the use of CCA
has either advantages or disadvantages compared to
SVR, depending on the point of view. While SVR
predicts the trajectory of a specific joint, CCA pre-
dicts the trajectory of a component. So obviously
CCA cannot be used when the aim is the prediction
of a certain joint or a certain movement direction.
But in case of stroke rehabilitation or orthotic con-
trol, one could also use the components predicted by
CCA to give the user feedback using multiple joints at
once, which would allow for a more natural feedback.
This gets clearer when looking at the movement tra-
jectories. The performed (and recorded) wrist move-
ment trajectory looks unnatural and choppy, which is
caused by hemiparesis and compensatory movements
due to stroke. The movement trajectory obtained by
CCA, although being more noisy, resembles much
better the intended wrist extension and flexion tra-
jectory. Thereby we argue that CCA is not only bet-
ter suited for trajectory decoding than other methods,
but also allows to predict the real movement intention
of the patient instead of the performed and impaired
movement of the stroke patient. Based on these re-
sults, one could interpret the transformation matrices
to infer knowledge regarding the participation of dif-
ferent joints in compensatory movements and which
parts of the brain signal yield information regarding
the compensatory movement and the intended move-
ment. Although we did not demonstrate this aspect of
CCA in detail, we think that CCA is a potential tool
in this field with possible applications beyond the use
for trajectory prediction.
5 CONCLUSION
In this paper we have shown that we are able to
decode wrist movement trajectory from hemiparetic
chronic stroke patients based on ipsilesional ECoG
recordings over their sensorimotor cortex. We have
further compared different methods for trajectory pre-
diction and could show that either SVR (with RBF
kernel) or CCA are the best methods for trajec-
tory prediction, depending on the intended applica-
tion. Further we have outlined how the application
of CCA could be potentially useful to infer infor-
mation regarding compensatory movements, the in-
tended movement trajectory and the underlying brain
activity regarding both.
ACKNOWLEDGMENTS
We thank Florian Grimm and Alireza Gharabghi for
recording the data and making them available for this
study. This work was supported by the European Re-
search Council (ERC 227632-BCCI) and the Baden-
W
¨
urttemberg Stiftung (GRUENS).
REFERENCES
Bin, G., Gao, X., Yan, Z., Hong, B., and Gao, S.
(2009). An online multi-channel SSVEP-based
brain-computer interface using a canonical correla-
tion analysis method. Journal of Neural Engineering,
6(4):046002.
Bishop, C. M. et al. (2006). Pattern recognition and ma-
chine learning, volume 1. springer New York.
Broetz, D., Braun, C., Weber, C., Soekadar, S., Caria, A.,
and Birbaumer, N. (2010). Combination of brain-
computer interface training and goal-directed physical
therapy in chronic stroke: a case report. Neuroreha-
bilitation and Neural Repair, 24(7):674–679.
Buch, E., Weber, C., Cohen, L., Braun, C., Dimyan,
M., Ard, T., Mellinger, J., Caria, A., Soekadar,
S., Fourkas, A., and Birbaumer, N. (2008). Think
to move: a neuromagnetic brain-computer interface
(BCI) system for chronic stroke. Stroke, 39:910–7.
Burg, J. P. (1967). Maximum entropy spectral analysis. In
37th Annual International Meeting. Society of Explo-
ration Geophysics.
Chang, C.-C. and Lin, C.-J. (2011). Libsvm: a library for
support vector machines. ACM Transactions on Intel-
ligent Systems and Technology (TIST), 2(3):27.
NEUROTECHNIX2014-InternationalCongressonNeurotechnology,ElectronicsandInformatics
44

Cirstea, M. and Levin, M. F. (2000). Compensatory strate-
gies for reaching in stroke. Brain, 123(5):940–953.
Cramer, S., Nelles, G., Benson, R., Kaplan, J., Parker, R.,
Kwong, K., Kennedy, D., Finklestein, S., and Rosen,
B. (1997). A functional MRI study of subjects recov-
ered from hemiparetic stroke. Stroke, 28(12):2518–
2527.
Dunteman, G. H. (1989). Principal components analysis.
Number 69. Sage.
Fugl-Meyer, A., J
¨
a
¨
ask
¨
o, L., Leyman, I., Olsson, S., and
Steglind, S. (1975). The post-stroke hemiplegic
patient. a method for evaluation of physical per-
formance. Scandinavian journal of rehabilitation
medicine, 7(1):13–31.
Hastie, T., Buja, A., and Tibshirani, R. (1995). Penalized
discriminant analysis. The Annals of Statistics, pages
73–102.
Hotelling, H. (1936). Relations between two sets of vari-
ates. Biometrika, 28(3/4):321–377.
Kwakkel, G., Kollen, B. J., van der Ground, J., and Prevo,
A. J. (2003). Probability of regaining dexterity in the
flaccid upper limb impact of severity of paresis and
time since onset in acute stroke. Stroke, 34:2181–
2186.
Lee, M. Y., Park, J. W., Park, R. J., Hong, J. H., Son, S. M.,
Ahn, S. H., Cho, Y. W., and Jang, S. H. (2009). Cor-
tical activation pattern of compensatory movement in
stroke patients. NeuroRehabilitation, 25(4):255–260.
Nakanishi, Y., Yanagisawa, T., Shin, D., Fukuma, R.,
Chen, C., Kambara, H., Yoshimura, N., Hirata, M.,
Yoshimine, T., and Koike, Y. (2013). Prediction of
three-dimensional arm trajectories based on ecog sig-
nals recorded from human sensorimotor cortex. PloS
one, 8(8):e72085.
Pistohl, T., Ball, T., Schulze-Bonhage, A., Aertsen, A., and
Mehring, C. (2008). Prediction of arm movement tra-
jectories from ecog-recordings in humans. Journal of
neuroscience methods, 167(1):105–114.
Ramos-Murguialday, A., Broetz, D., Rea, M., L
¨
aer, L., Yil-
maz,
¨
O., Brasil, F. L., Liberati, G., Curado, M. R.,
Garcia-Cossio, E., Vyziotis, A., et al. (2013). Brain-
machine interface in chronic stroke rehabilitation: A
controlled study. Annals of neurology, 74(1):100–108.
Schalk, G., Miller, K., Anderson, N., Wilson, J., Smyth, M.,
Ojemann, J., Moran, D., Wolpaw, J., and Leuthardt,
E. (2008). Two-dimensional movement control us-
ing electrocorticographic signals in humans. J Neural
Eng, 5(1):75–84.
Sheikh, H., McFarland, D. J., Sarnacki, W. A., and Wolpaw,
J. R. (2003). Electroencephalographic (eeg)-based
communication: Eeg control versus system perfor-
mance in humans. Neuroscience letters, 345(2):89–
92.
Silvoni, S., Ramos-Murguialday, A., Cavinato, M., Vol-
pato, C., Cisotto, G., Turolla, A., Piccione, F., and
Birbaumer, N. (2011). Brain-computer interface in
stroke: a review of progress. Clinical EEG and Neu-
roscience, 42(4):245–252.
Sp
¨
uler, M., Rosenstiel, W., and Bogdan, M. (2011). A
fast feature selection method for high-dimensional
MEG BCI data. In Proceedings of the 5th Int. Brain-
Computer Interface Conference, pages 24–27, Graz.
Sp
¨
uler, M., Rosenstiel, W., and Bogdan, M. (2012). On-
line adaptation of a c-VEP Brain-Computer Interface
(BCI) based on Error-related potentials and unsuper-
vised learning. PloS one, 7(12):e51077.
Sp
¨
uler, M., Walter, A., Ramos Murguialday, A., Naros, G.,
Birbaumer, N., Gharabaghi, A., Rosenstiel, W., and
Bogdan, M. (2014). Decoding of motor intentions
from epidural ECoG recordings in severely paralyzed
chronic stroke patients. Journal of Neural Engineer-
ing. accepted.
Sp
¨
uler, M., Walter, A., Rosenstiel, W., and Bogdan, M.
(2013). Spatial Filtering Based on Canonical Corre-
lation Analysis for Classification of Evoked or Event-
Related Potentials in EEG Data. IEEE Transactions
on Neural Systems and Rehabilitation Engineering.
Sun, L., Ji, S., and Ye, J. (2008). A least squares formu-
lation for canonical correlation analysis. In Proceed-
ings of the 25th international conference on Machine
learning, pages 1024–1031. ACM.
Walter, A., Murguialday, A. R., Sp
¨
uler, M., Naros, G., Le
˜
ao,
M. T., Gharabaghi, A., Rosenstiel, W., Birbaumer, N.,
and Bogdan, M. (2012). Coupling BCI and corti-
cal stimulation for brain-state-dependent stimulation:
methods for spectral estimation in the presence of
stimulation after-effects. Frontiers in neural circuits,
6.
Yanagisawa, T., Hirata, M., Saitoh, Y., Goto, T., Kishima,
H., Fukuma, R., Yokoi, H., Kamitani, Y., and
Yoshimine, T. (2011). Real-time control of a pros-
thetic hand using human electrocorticography signals:
technical note. Journal of neurosurgery, 114(6):1715–
1722.
PredictingWristMovementTrajectoryfromIpsilesionalECoGinChronicStrokePatients
45
