
AR Visualization of Thermal 3D Model by Hand-held Cameras
Kazuki Matsumoto
1
, Wataru Nakagawa
1
, Hideo Saito
1
, Maki Sugimoto
1
,
Takashi Shibata
2
and Shoji Yachida
2
1
Graduate School of Science and Technology, Keio University, 3-14-1 Hiyoshi, Kohoku-ku, Yokohama, Kanagawa, Japan
2
NEC Corporation, 1753 Shimonumabe, Nakahara-ku, Kawasaki, Kanagawa, Japan
Keywords:
3D Model, Augmented Reality, Temperature, RGB-D Camera, Thermal Camera, Camera Tracking, Viewpoint
Generative Learning.
Abstract:
In this paper, we propose a system for AR visualization of thermal distribution on the environment. Our
system is based on color 3D model and thermal 3D model of the target scene generated by KinectFusion
using a thermal camera coupled with an RGB-D camera. In off-line phase, Viewpoint Generative Learning
(VGL) is applied to the colored 3D model for collecting its stable keypoints descriptors. Those descriptors
are utilized in camera pose initialization at the start of on-line phase. After that, our proposed camera tracking
which combines frame-to-frame camera tracking with VGL based tacking is performed for accurate estimation
of the camera pose. From estimated camera pose, the thermal 3D model is finally superimposed to current
mobile camera view. As a result, we can observe the wide area thermal map from any viewpoint. Our system is
applied for a temperature change visualization system with a thermal camera coupled with an RGB-D camera
and it is also enables the smartphone to interactively display thermal distribution of a given scene.
1 INTRODUCTION
Thermal imaging is utilized for various purposes such
as recordingenergyrelated issues of power equipment
and observingbody temperature of animals. Recently,
a lot of work has been done to combine state-of-the-
art computer vision techniques with the thermal imag-
ing. For example, (Szab´o et al., 2013) propose a
new augmented reality(AR) system of the patient’s in-
frared tissue temperature maps for directly visualizing
myocardial ischemia during cardiac surgery. (Kandil
et al., 2014) present a method for automatically gener-
ating 3D spatio-thermal models, and enables owners
and facility managers to quickly get the actual energy
performance data for their existing buildings by lever-
aging recent image-based 3D modeling approaches as
well as thermal cameras.
Recently, smartphone attachable thermal imaging
devices have started to appear. Since the cost of
these devices is considerably less than thermal cam-
eras originally built for military or medical purposes,
thermal imaging is starting to be more widely used in
consumer applications(Yanai, 2014).
However, the resolution and the field of view of
the thermal cameras is limited and it is difficult to
monitor large machines and areas. Since the cost of
such a device is also high, it makes it hard to use sev-
eral cameras to cover a large surface. Also, the cali-
bration of these devices is difficult due to the low res-
olution images obtained from single camera.
In this paper, we propose a system for visualizing
wide area temperature map from arbitrary viewpoints.
The goal of our paper is AR visualization of a ther-
mal 3D model with ordinary hand-held cameras in
order to monitor the spatial temperature distribution
of the target scene. Our approach is based on precom-
puted RGB 3D model and thermal 3D model of the
target scene achieved with an RGB-D camera coupled
with the thermal camera shown in Figure 1. These 3D
models are generated using KinectFusion (Izadi et al.,
2011). The colored 3D model is used with the View-
point Generative Learning (VGL) (Thachasongtham
et al., 2013) algorithm to detect feature points robust
to viewpoint changes and to generate a database with
corresponding 3D positions and descriptors of these
features. We then estimate the pose of the camera by
finding keypoint correspondencesbetween the current
view and the database. We also combine the frame-
to-frame tracking with the VGL based tracking for
accurately estimating the camera pose. By knowing
480
Matsumoto K., Nakagawa W., Saito H., Sugimoto M., Shibata T. and Yachida S..
AR Visualization of Thermal 3D Model by Hand-held Cameras.
DOI: 10.5220/0005290904800487
In Proceedings of the 10th International Conference on Computer Vision Theory and Applications (VISAPP-2015), pages 480-487
ISBN: 978-989-758-091-8
Copyright
c
2015 SCITEPRESS (Science and Technology Publications, Lda.)
the pose of the camera, we are then able to perform
AR visualization of thermal 3D model from any view-
point with a hand-held camera.
As a result, our system has two applications. The
first one is temperature change visualization system
using an RGB-D camera and a thermal camera. The
other is interactive AR visualization of thermal 3D
model on smartphone display. The user can reveal
the 3D thermal model by touching relevant image re-
gions on the smartphone. The paper is structured as
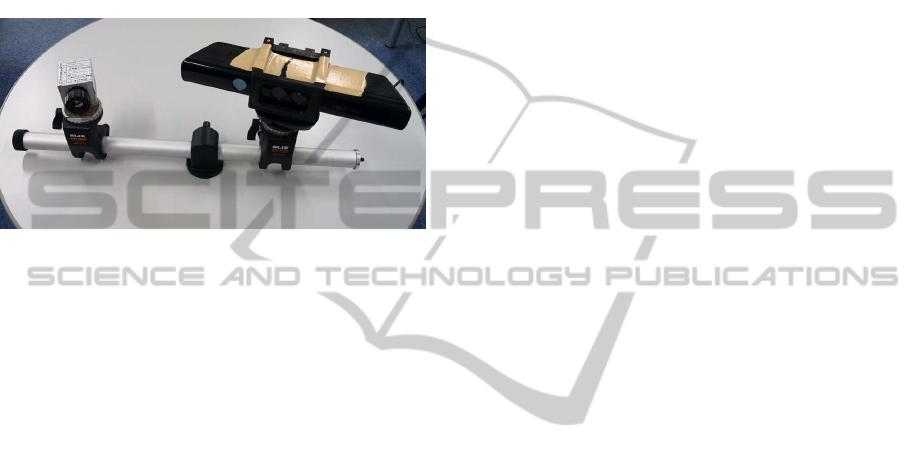
Figure 1: Our capture system is composed of the Microsoft
KINECT and Optris PI160 thermal camera.
follows. The related works are discussed in Section
2. After describing the detail of our system in Sec-
tion 3, Section 4 will show the two applications of
our method and discuss the accuracy and the runtime
of our camera tracking. We finally conclude the paper
and describe our future works in Section 5.
2 RELATED WORKS
The 3D representation of heat distribution has at-
tracted the interest of researchers because of the de-
velopment of 3D modeling techniques, depth cameras
and thermal imaging (Borrmann et al., 2012), (De-
misse et al., 2013). These systems reconstruct a ther-
mal 3D model and exploit it for acquiring not only ac-
curate and wide scope thermal data but also geograph-
ical information of a building so that the observer can
run simulations of thermal distribution and can eas-
ily find the areas with abnormal temperatures. They
involve a mobile wheeled robot with a laser scanner
and a thermal camera for simultaneous acquisition of
3D laser scan data and thermal images. However, this
robot is not capable of exploring bumpy ground or
confined spaces.
Our work is inspired from a mobile 3D thermal
system introduced in (Vidas et al., 2013) which used
only two cameras - an RGB-D camera and a ther-
mal camera. This system uses the KinectFusion al-
gorithm (Izadi et al., 2011) for generating dense and
high-fidelity 3D thermal model. Inspired from their
approach, we also use the KinectFusion for recon-
structing 3D thermal model. The major advantages
of such approach is its ease of use in confined spaces
and its relatively low price when compared with 3D
LiDAR and robotics platform.
The problem of 3D pose estimation of rigid ob-
jects has been studied for several decades because es-
timating the pose of a known object is a significant
issue in Augmented Reality. (Saito et al., 2014) pro-
pose on-line diminished reality system using View-
point Generative Learning (VGL) based camera pose
estimation. The VGL generates a database of feature
descriptors from the 3D model to make the pose es-
timation robust to viewpoint changes. Therefore, we
apply the VGL for tracking the mobile cameras be-
cause the purpose of our AR system is to enable the
observer to move hand-held camera arbitrarily and to
visualize the thermal map in a given scene.
3 PROPOSED METHOD
The overview of our system is shown in Figure 2. As
it can be seen, our system pipeline consists of an off-
line phase and an on-line phase. In the pre-process
stage of this system, we estimate the intrinsic parame-
ters of the RGB-D camera and the thermal camera by
using an ordinary circle grid pattern (Zhang, 2000).
We also need to calibrate the relative pose of these
distinct devices. For this reason we use our own cal-
ibration board that makes easier to detect the circle
grid pattern with thermal camera. After the prepro-
cessing, we generate two 3D models using Kinect Fu-
sion (Izadi et al., 2011) - one with the RGB infor-
mation another with the corresponding temperature
distribution at the capturing time. The RGB colored
3D model is the source of stable keypoints database
stored by Viewpoint Generative Learning in off-line
phase and the thermal 3D model will be used for aug-
mented reality in on-line phase. The stable keypoint
database will be available for estimating the camera
pose in on-line phase.
During the on-line phase, we first initialize the
camera pose reference to the RGB 3D model. The
initial camera pose is calculated by the correspon-
dences between the stable keypoints in VGL database
and h keypoints extracted from the first frame. Af-
ter this initialization, the camera pose is computed
using frame-to-frame tracking in combination with
VGL based camera pose estimation. We can then
align the thermal 3D model with the current viewpoint
and superimpose the thermal information on the cur-
rent image.
ARVisualizationofThermal3DModelbyHand-heldCameras
481
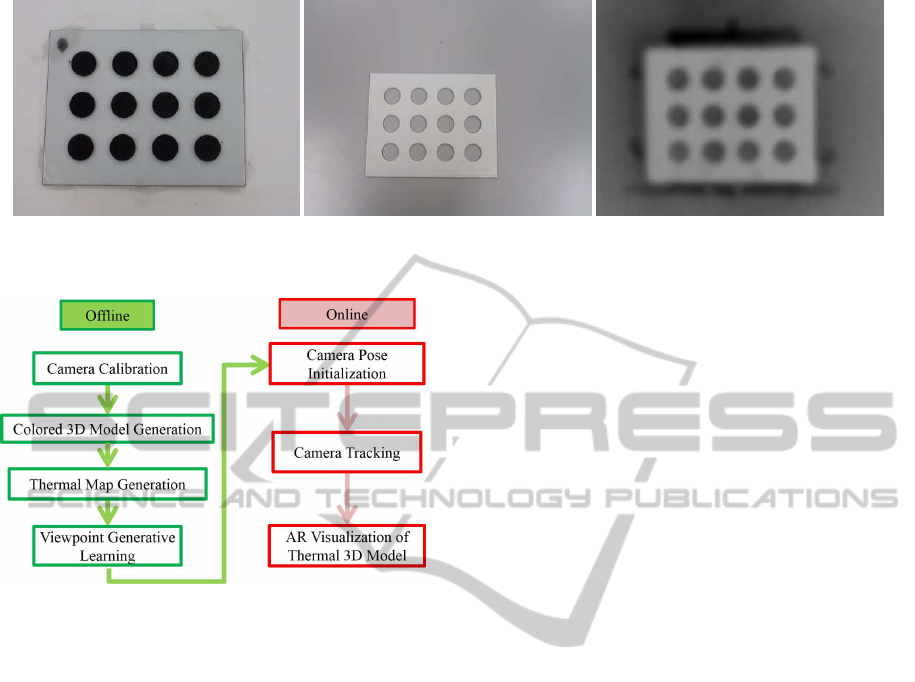
(a) (b) (c)
Figure 3: (a)lower plate (b)upper plate (c) captured image from thermal camera.
Figure 2: System Overview.
3.1 Camera Calibration
In order simplify the pose estimation of the thermal
camera in reference to the RGB-D camera, we use
a special calibration board that is visible from both
color and thermal cameras. This calibration board
is constructed of two plastic plates stacked together.
Both details were made with 3D printer. The lower
plate is made of a planar surface covered with cir-
cular bumps corresponding to the black parts of the
circle grid calibration pattern. The upper plate is de-
signed to plug on top of the first one, it is thus made
of a planar surface with holes where the black pattern
of lower calibration board should appear. Combin-
ing both plates creates a flat calibration pattern like
the ones commonly used. Just before calibration, we
heat the lower plate while the upper one remains at
ambient temperature so that the circle grid pattern in
thermal image can be detected as shown in Figure 3.
The intrinsic parameters of RGB-D camera and
thermal camera are calculated using Zhang’s method
(Zhang, 2000). In order to estimate the pose of the
thermal camera in reference to the RGB-D camera,
we obtain a set of 3D-2D correspondences by de-
tecting both 3D positions of black circles captured in
RGB-D camera and its corresponding 2D locations in
the thermal image. However, the depth map captured
with RGB-D camera is contaminated with structural
noise especially in black circle areas. Therefore we
compute the planar surface equation from acquired
3D points on circle grid and project them onto the es-
timated plane for accurately estimating their 3D posi-
tion. We then apply the efficient Perspective-n-Point
algorithm (Lepetit et al., 2009) to estimate the extrin-
sic parameters.
3.2 Colored 3D Model Generation
The KinetFusion algorithm (Izadi et al., 2011) is used
to generate the uncolored 3D model of target scene.
While KinectFusion is running, we save not only the
camera poses of RGB-D camera but also the color im-
age, depth image and thermal image for each frame.
Using the pose estimation of each frame, we then gen-
erate colored 3D model by projecting RGB data onto
the uncolored 3D model.
3.3 Thermal 3D Model Generation
Since the RGB-D camera and the thermal camera are
located at slightly separate positions, we need to ap-
ply rigid transformation calculated in Section 3.1 to
thermal image and deal with occlusions for correctly
mapping the thermal data. In order to remove oc-
cluded thermal data, we first project the 3D points
corresponding to the pixels of the depth image onto
the thermal image and generate the depth image from
the thermal camera viewpoint. Then, we remove oc-
cluded depth values by replacing the neighboring ab-
solutely difference values with the average value of
this area. Finally, for each pixel of the RGB-D image,
corresponding thermal values can be found while re-
moving occluded area. The process of thermal data
mapping is illustrated in Figure 4.
VISAPP2015-InternationalConferenceonComputerVisionTheoryandApplications
482
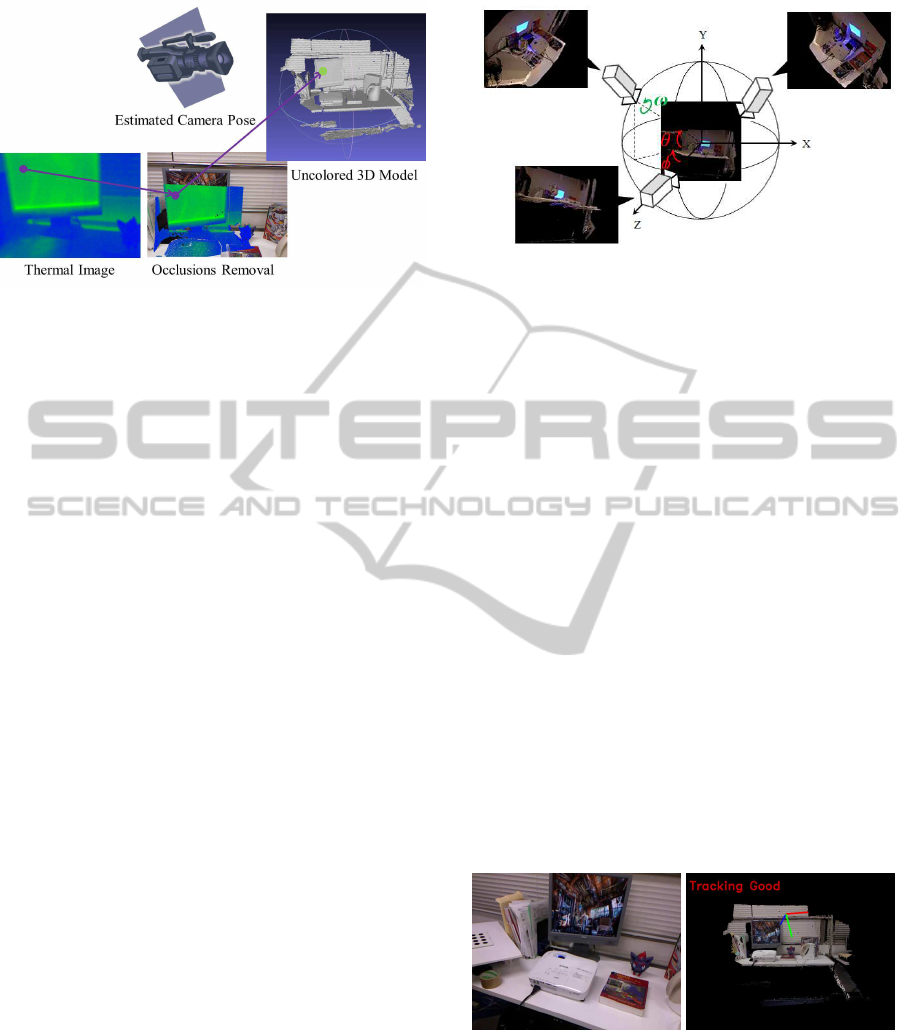
Figure 4: Thermal data mapping from estimated camera
pose.
3.4 Viewpoint Generative Learning
Conventional local features such as SIFT and SURF
are robust to scale and rotation changes but sensi-
tive to large perspective changes. In order to solve
this problem, (Yoshida et al., 2013) proposed a sta-
ble keypoint matching method which is robust even
under strong perspective changes by using Viewpoint
Generative Learning (VGL). However, this method is
only focusing on planar surfaces and can not deal with
3D objects. Therefore, (Thachasongtham et al., 2013)
modify this algorithm so that they can estimate the
pose of a 3D object from stable keypoints stored in
VGL database.
During on-line phase, we need a robust camera
tracking algorithm against strong viewpoint changes
because the user of our system is observing the tar-
get scene with a hand-held camera. Therefore, we
apply the Viewpoint Generative Learning to the RGB
3D model generated in Section 3.2. In the first step,
we generate patterns of the model from various view-
points using the OpenGL rendering process as shown
in Figure 5. For each generated viewpoint, we col-
lect not only the patterns and extracted SIFT features
but also the depth and viewpoint of those rendered
images. Then, all detected keypoints are projected
from pixel coordinate system to 3D coordinate sys-
tem and conserve only the ones that can be detected
over multiple views. We define these features with
high repeatability as stable keypoints and collect the
corresponding descriptors.
After that, k-means++ (Arthur and Vassilvitskii,
2007) is applied to cluster the set of collected descrip-
tors of each stable keypoint and store the barycenter
descriptors and the 3D positions of each stable key-
point in the VGL database.
Figure 5: Viewpoint Generative Leaning.
3.5 Camera Pose Initialization
After learning is finished, we first detect SIFT key-
points and extract feature descriptors from the ini-
tial frame. For each detected keypoint, we search
the two most similar descriptors by evaluating Eu-
clidean distance of their high dimensional value us-
ing the Fast Library for Approximate Nearest Neigh-
bors (FLANN) algorithm. Then, we evaluate the ra-
tio of the distance of closest descriptor to that of the
second closest descriptor, and if the ratio is under
a given threshold we validate the established corre-
spondence. As a result, we can identify the 3D/3D
correspondences between the stable keypoints on the
model in 3D and the current RGB-D camera view. Fi-
nally, the pose of RGB-D camera is deduced with a
singular value decomposition associated to RANSAC
for excluding wrong correspondences. The accuracy
of initialization is evaluated by the ratio between the
number of the 3D/3D correspondences and that of ex-
tracted keypoints from current image . If the ratio is
over the threshold, we assume the initialization is suc-
cessfully performed and start frame-to-frame tracking
from the next frame.
(a) current image (b) camera pose
Figure 6: Camera pose estimation.
3.6 Camera Tracking
In the frame-to-frame tracking, we continuously ex-
tract descriptors from RGB-D frames. Under the as-
sumption that the current camera position is close to
the previous one, we search for correspondences with
ARVisualizationofThermal3DModelbyHand-heldCameras
483
the features from previous frame in their local neigh-
borhood . The matching pairs are evaluated based on
Euclidean distance, and the closest pair is selected as
matching pair. If the ratio of matched pairs to key-
points extracted in previous frame is over 10 %, the
current camera pose is estimated by singular value de-
composition and RANSAC (as explained in previous
Section), otherwise we apply the VGL based tracking
to re-initialize the camera pose.
However, sometimes the frame-to-frame tracking
fails even in the case where we can find keypoint cor-
respondences correctly. In order to solve this prob-
lem, we evaluate the Euclidean distance of camera po-
sition and the rotation of camera poses between cur-
rent frame and previous frame. If the distance is over
5cm or the rotation is over 10 degrees, we consider
the frame-to-frame tracking as wrong estimation and
apply the motion model calculated from previous 3
frames for predicting current camera pose. As a re-
sult, our camera pose tracking is stable as shown in
Figure 6.
3.7 AR Visualization of Thermal Model
During the on-line processing, we superimpose pre-
computed thermal 3D model on current view from es-
timated camera pose as shown in Figure 7. The ren-
dering process is performed in GPU with CUDA and
OpenGL so that the observer can see the temperature
distribution in real-time. As a result, we can visualize
the thermal distribution of the scene from any view-
point.
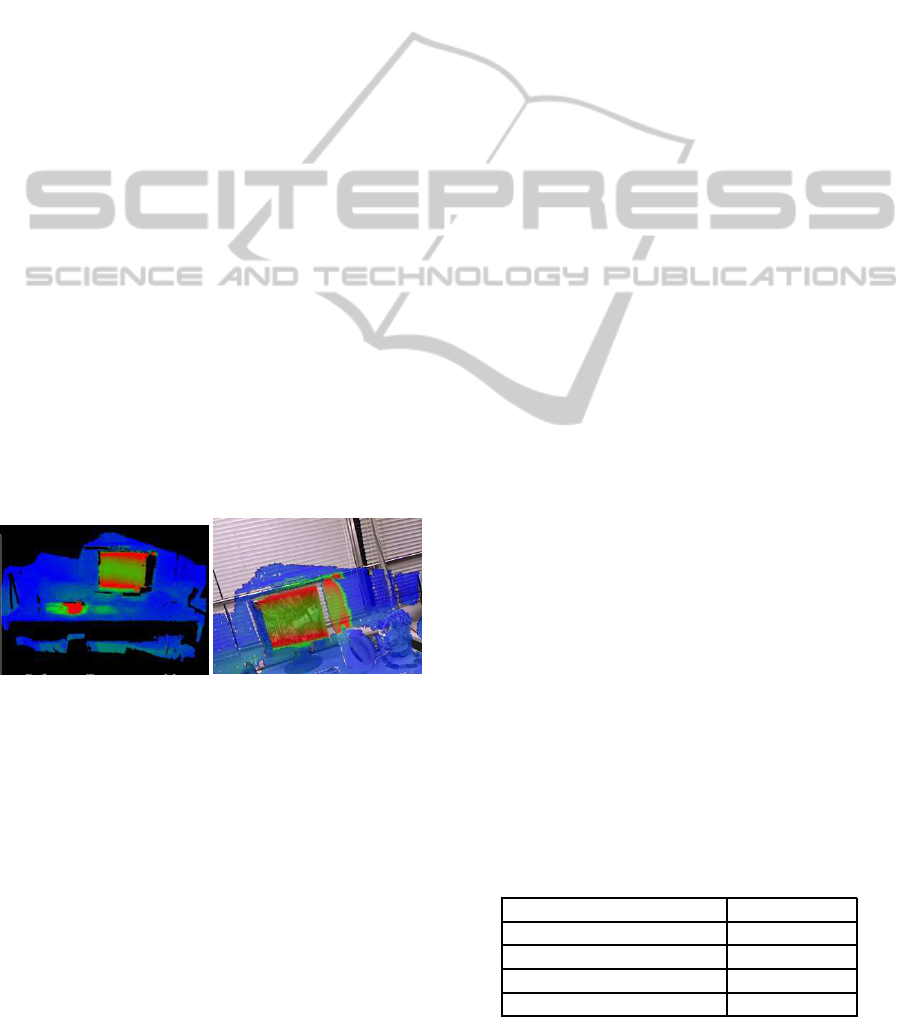
(a) Off-line generated thermal
3D model
(b) AR visualization of thermal
model
Figure 7: Examples showing AR visualization.
4 EXPERIMENTS
In this section, we introduce two applications for ther-
mal observation system using AR visualization of
thermal 3D model. The first one is AR visualiza-
tion for detecting the temperature distribution change
with an RGB-D camera coupled with a thermal cam-
era. The second one is to interactively visualize the
thermal 3D model on smartphone display. For gener-
ating thermal 3D model and RGB 3D model, we used
Microsoft Kinect(640 × 480 pixels resolution, 30fps)
and Optris PI160 with a resolution of 160 × 120 pix-
els and a frame rate at fps. Vertical and horizontal
values of the field of view of the PI160 are 21
◦
and
28
◦
, respectively.
4.1 AR Visualization of Temperature
Changes Distribution
We demonstrate the use of our AR system by visu-
alizing chansing temperatures of electrical equipment
within a scene in real-time. This system can visualize
more widespread thermal distribution than our previ-
ous work (Nakagawa et al., 2014).
In on-line phase, the user moves same camera set
as in the off-line phase and to record current thermal
distribution. During camera tracking, this application
continuously projects the thermal data onto the off-
line generated uncolored model from the estimated
viewpoint as shown in Figure 8. Then, we simulta-
neously superimpose both off-line generated thermal
3D model and on-line rendered thermal map on cur-
rent view as illustrated in Figure 9.
Additionally, this application enables us to visu-
alize the difference of the current thermal state in re-
spect to the recorded thermal 3D model from the same
viewpoint. Figure 9 shows the results by blending the
augmented thermal map with current image RGB data
int regions of considerable temperature change.
4.2 Quantitative Evaluation
4.2.1 Runtime Evaluation
The experiment was carried out on a PC with 16GB
of RAM, an Intel Core i7-4800MQ CPU and a Nvidia
GeForce GTX 780M graphics card. Table 1 shows
the breakdown of the processing times. We believe
that this system can be considered to be running in
real-time frame rates. Also, we compare the runtime
for camera pose estimation with VGL database based
tracking proposed by (Thachasongtham et al., 2013).
Their method takes 0.12 seconds for camera pose es-
timation since requesting the database for finding cor-
responds keypoints is slower than the local area key-
point searching in frame-to-frame tracking.
Table 1: Breakdown of Processing Time.
Process runtime (sec)
Total 0.46
Camera pose estimation 0.10
On-line thermal mapping 0.12
Visualization 0.24
VISAPP2015-InternationalConferenceonComputerVisionTheoryandApplications
484
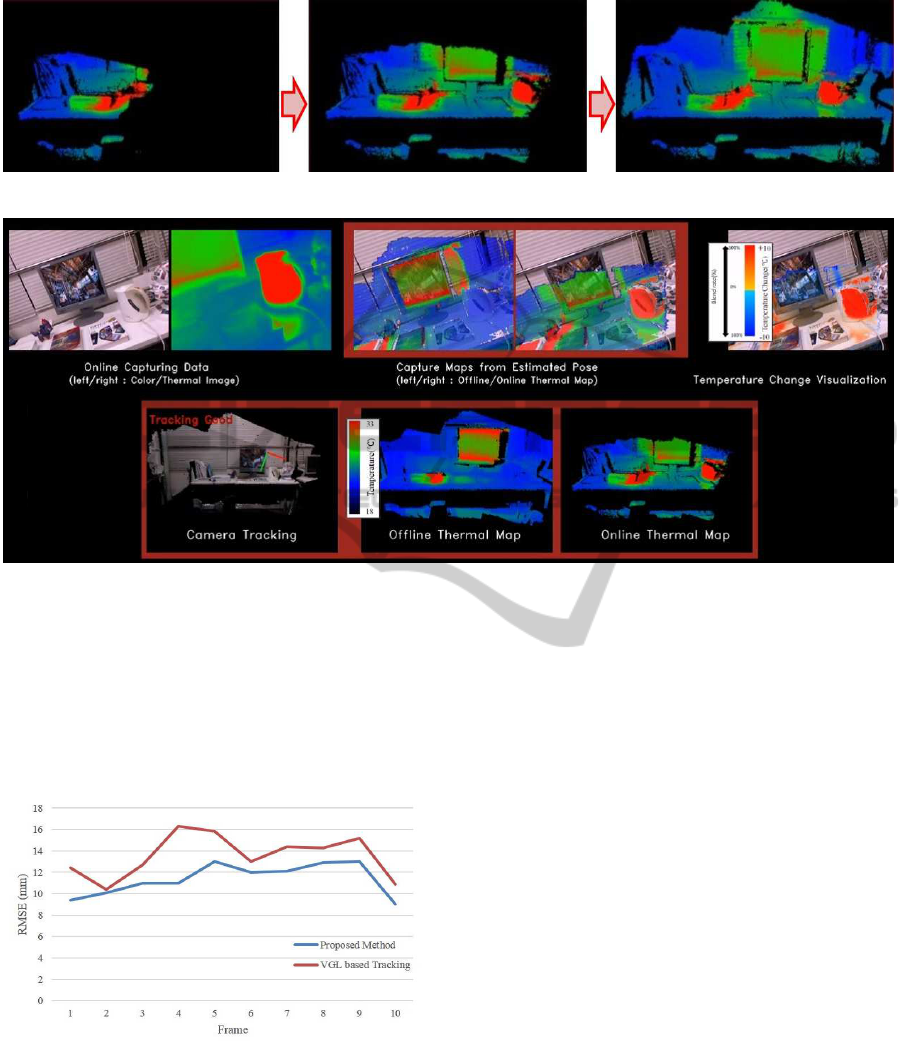
Figure 8: The process of on-line thermal 3D map rendering.
Figure 9: AR temperature change visualization system.
4.2.2 Accuracy Evaluation
In order to evaluate the accuracy of camera pose esti-
mation, we calculate the RMSE score of re-projection
error from estimated camera pose and compare it with
that of VGL based tracking in 10 frames (Figure 10).
As table 10 shows, our proposed method outperforms
Figure 10: RMSE of re-projection error (mm).
the VGL based tracking in terms of re-projection er-
ror. Since our system applies singular value decom-
position to the the corredponding 3D-3D keypoints
for camera pose estimation, it is more accurate than
the VGL based camera pose estimation deduced from
2D-3D correspondences.
Figure 11 shows the Euclidean distances between
the camera positions of two consecutive frames. Even
when the cameras were moved slowly, the VGL based
tracking sometimes fails to track the camera (as high-
lighted in green circles on the graph). Our method is
much more stable, since we combine frame-to-frame
tracking, VGL based initialization and motion model
for camera pose estimation.
4.3 AR Visualization of Thermal 3D
Model on Smartphone
This system consists of a smartphone and a server PC
and they are connected via wireless network in order
to transfer the video data between those devices. Fig-
ure 13 shows communication flow between a smart-
phone and a server. The server has two threads -
one for network operations and one for AR process-
ing. The network thread continuously waits for new
frames from the smartphone and buffers them to be
used in the AR thread. As the AR thread is rather
slow in processing frames, it always retrieves the lat-
est frame in the buffer and drops older frames. The
processed frames with AR overlay are buffered in the
network thread to be sent back to smartphone. In the
server PC, RGB 3D model and thermal 3D model of
a target scene are generated and its robust keypoint
features are stored in VGL database. In the on-line
ARVisualizationofThermal3DModelbyHand-heldCameras
485
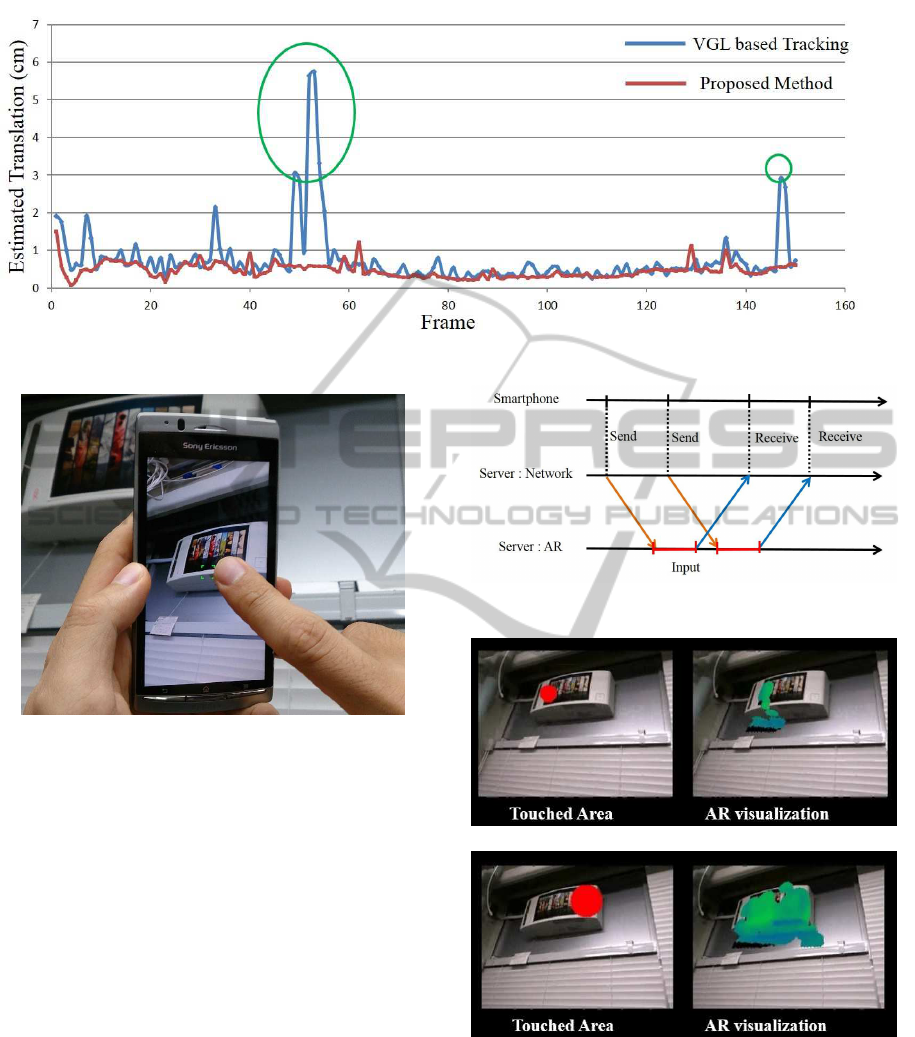
Figure 11: The Euclidean distances between the camera positions of two consecutive frames.
Figure 12: The observer can select the thermal visualization
area.
phase, the observer can capture the scene with the
smartphone and select target area by touching display
of the device (Figure 12). The correspondences be-
tween the keypoints on the current image in 2D and
stable keypoints of the model in 3D are searched in
the same way as the temperature change visualiza-
tion system described in Section 4.1. Since smart-
phones can not obtain depth image of current frame,
the Perspective-n-Point method (Lepetit et al., 2009)
with RANSAC instead of singular value decomposi-
tion is applied to the 2D-3D correspondences for de-
ducing the camera pose. We can finally superimpose
the thermal 3D object on the target area of smartphone
display and visualize the temperature distribution of
the area as shown in Figure 14.
The experimental platform was implemented on
smartphone with 1.0GHz MSM8255 processor and
512MB of RAM and a laptop with 2.5GHz Intel Core
i7-2860QM processor GeForce GTX 560M graphics
card and 16GB RAM. The smartphone camera image
size is 320×240 pixels.
Figure 13: Connection flow between smartphone and
server.
(a) thermal model is superimposed in touched area
(b) The target area is increasing
Figure 14: AR visualization of thermal 3D model in smart-
phone.
5 CONCLUSIONS & FUTURE
WORK
In this paper, two systems for visualizing temperature
distribution of a given scene using an RGB-D cam-
VISAPP2015-InternationalConferenceonComputerVisionTheoryandApplications
486

era and a thermal camera are presented. The first one
is temperature change visualization system compar-
ing on-line and off-line thermal 3D models from any
viewpoint. Another is the interactiveAR visualization
of thermal 3D model on smartphone display. Both ap-
plications use AR visualization of off-line generated
thermal 3D model. In the off-line phase, the uncol-
ored 3D model of a given scene is reconstructed and
the poses of the camera with the corresponding color
and thermal images are saved by using KinectFusion.
After mapping color and thermal images on separate
uncolored models, Viewpoint Generative Leaning is
applied to the RGB 3D model in order to store the
stable keypoints and their clustered descriptors in the
VGL database. During the on-line phase, hand-held
camera poses are estimated by combining frame-to-
frame tracking with the camera pose estimation us-
ing correspondences between keypoint descriptors in
the current image and in the VGL database. Finally,
the thermal 3D model is superimposed on the current
hand-held camera view.
Recently, some devices for converting the smart-
phone camera into thermal camera have appeared in
the market such as Therm-App for Android and FLIR
ONE for iPhone. We plan to use these devices for
getting thermal information from smartphones so that
our AR visualization system can detect temperature
distribution changes on the fly.
REFERENCES
Arthur, D. and Vassilvitskii, S. (2007). k-means++: The
advantages of careful seeding. In Proceedings of the
eighteenth annual ACM-SIAM symposium on Discrete
algorithms, pages 1027–1035. Society for Industrial
and Applied Mathematics.
Borrmann, D., N¨uchter, A., Dakulovic, M., Maurovic, I.,
Petrovic, I., Osmankovic, D., and Velagic, J. (2012).
The project thermalmapper?thermal 3d mapping of in-
door environments for saving energy. In Proceedings
of the 10th International IFAC Symposium on Robot
Control (SYROCO), volume 10, page 1.
Demisse, G. G., Borrmann, D., and Nuchter, A. (2013). In-
terpreting thermal 3d models of indoor environments
for energy efficiency. In Advanced Robotics (ICAR),
2013 16th International Conference on, pages 1–8.
IEEE.
Izadi, S., Kim, D., Hilliges, O., Molyneaux, D., Newcombe,
R., Kohli, P., Shotton, J., Hodges, S., Freeman, D.,
Davison, A., et al. (2011). Kinectfusion: real-time 3d
reconstruction and interaction using a moving depth
camera. In Proceedings of the 24th annual ACM sym-
posium on User interface software and technology,
pages 559–568. ACM.
Kandil, A., Hastak, M., and Dunston, P. S. (2014). Rapid
3d energy performance modeling of existing build-
ings using thermal and digital imagery. Bridges,
10:9780784412329–100.
Lepetit, V., Moreno-Noguer, F., and Fua, P. (2009). Epnp:
An accurate o (n) solution to the pnp problem. Inter-
national journal of computer vision, 81(2):155–166.
Nakagawa, W., Matsumoto, K., de Sorbier, F., Sugimoto,
M., Saito, H., Senda, S., Shibata, T., and Iketani,
A. (2014). Visualization of temperature change us-
ing rgb-d camera and thermal camera. In Com-
puter Vision–ECCV 2014: 13th European Confer-
ence, Zurich, Switzerland, September 6-12, 2014, Pro-
ceedings. Springer.
Saito, H., Honda, T., Nakayama, Y., and de Sorbier, F.
(2014). Camera pose estimation for mixed and di-
minished reality in ftv. In 3DTV-Conference: The
True Vision-Capture, Transmission and Display of 3D
Video (3DTV-CON), 2014, pages 1–4. IEEE.
Szab´o, Z., Berg, S., Sj¨okvist, S., Gustafsson, T., Carleberg,
P., Upps¨all, M., Wren, J., Ahn, H., and Smedby,
¨
O.
(2013). Real-time intraoperative visualization of my-
ocardial circulation using augmented reality tempera-
ture display. The international journal of cardiovas-
cular imaging, 29(2):521–528.
Thachasongtham, D., Yoshida, T., de Sorbier, F., and Saito,
H. (2013). 3d object pose estimation using viewpoint
generative learning. In Image Analysis, pages 512–
521. Springer.
Vidas, S., Moghadam, P., and Bosse, M. (2013). 3d ther-
mal mapping of building interiors using an rgb-d and
thermal camera. In Robotics and Automation (ICRA),
2013 IEEE International Conference on, pages 2311–
2318. IEEE.
Yanai, O. (2014). Thermal imaging as a smartphone ap-
plication: exploring and implementing a new concept.
In SPIE Defense+ Security, pages 90700M–90700M.
International Society for Optics and Photonics.
Yoshida, T., Saito, H., Shimizu, M., and Taguchi, A. (2013).
Stable keypoint recognition using viewpoint genera-
tive learning. In VISAPP (2), pages 310–315.
Zhang, Z. (2000). A flexible new technique for camera cal-
ibration. Pattern Analysis and Machine Intelligence,
IEEE Transactions on, 22(11):1330–1334.
ARVisualizationofThermal3DModelbyHand-heldCameras
487
