
Multiple Biopotentials Acquisition System for Wearable Applications
S. Benatti
1
, B. Milosevic
2
, M. Tomasini
1
, E. Farella
2
, P. Sch
¨
onle
3
, P. Bunjaku
3
, G. Rovere
3
, S. Fateh
3
,
Q. Huang
3
and L. Benini
1,3
1
DEI, University of Bologna, Bologna, Italy
2
E3DA - Fondazione Bruno Kessler, Trento, Italy
3
Integrated System Laboratory, ETHZ, Zurich, Switzerland
Keywords:
PLI removal, EEG, ECG, Wearable computing, Biomedical monitoring, Sensor node.
Abstract:
Wearable devices for monitoring vital signs such as heart-rate, respiratory rate and blood pressure are demon-
strating to have an increasing role in improving quality of life and in allowing prevention for chronic cardiac
diseases. However, the design of a wearable system without reference to ground potential requires multi-level
strategies to remove noise caused from power lines. This paper describes a bio-potential acquisition embedded
system designed with an innovative analog front-end, showing the performance in EEG and ECG applications
and the comparison between different noise reduction algorithms. We demonstrate that the proposed system is
able to acquire bio-potentials with a signal quality equivalent to state-of-the-art bench-top biomedical devices
and can be therefore used for monitoring purpose, with the advantages of a low-cost low-power wearable
devices.
1 INTRODUCTION
Every year in EU and US over 4 million deaths are
caused by cardiac diseases. More than 100 millions
of people conduct their life after a heart attack and
there are 30 million of people suffering from arrhyth-
mia and other cardiac and cardiovascular disorders
(WHF , 2012). On the other hand, there are more
than 1 Billion people suffering from neurological dis-
eases, even if the international community was seri-
ously underestimating in traditional epidemiological
and health statistical methods its effects. The health
cost for treatments associated with these diseases is
about 450.5 B$ per year (WHO, 2012).
The monitoring of hearth rate, blood pressure,
oxygen saturation, brain activity and other physiolog-
ical parameters can help minimize this cost and en-
hance the quality of life for a significant part of the
world’s population. During hospitalization, monitor-
ing these parameters is relatively simple and can be
obtained with high-end bench-top diagnostic systems.
To extend the control and the diagnostic capabilities
out of hospitals it is necessary to provide unobtru-
sive and low cost systems, which should be equipped
with adequate sensor interfaces, sufficient computa-
tional resources and with optimized power manage-
ment strategies.
One open challenge in this field is the design of
unobtrusive systems that can be used in different ap-
plications of human biosignal analysis. Their goal is
to be able to run the needed algorithms for monitoring
and diagnosing the life parameters, while providing
adequate communication interfaces and a prolonged
battery life. The design of a wearable system for
biosignal monitoring presents many challenges, since
it involves integrated circuit design, mixed analog-
digital signal acquisition techniques, digital signal
processing, low power algorithms and adaptive filter-
ing techniques.
Given the nature of the signals to be acquired,
which lie in the 1 µV - 10 mV range, with a frequency
band of 0 − 1 kHz, analog acquisition and robustness
to noise is crucial. Noise interference is caused by
the floating reference potential of the human body
and by the 50/60 Hz power-line interference (PLI).
To achieve a robust design of a wearable system for
biosignal measurement, we need to properly address
the minimization of noise sources.
In this paper, we present a wearable platform
based on a low power Cortex M4 microcontroller
and a high performance Analog Front End (AFE)
(Schonle et al., 2013). The AFE is equipped with
a scalable SPI-interface, allowing accurate acquisi-
tion of bio-potentials. The computing performance of
260
Benatti S., Milosevic B., Tomasini M., Farella E., Schoenle P., Bunjaku P., Rovere G., Fateh S., Huang Q. and Benini L..
Multiple Biopotentials Acquisition System for Wearable Applications.
DOI: 10.5220/0005320302600268
In Proceedings of the International Conference on Biomedical Electronics and Devices (SmartMedDev-2015), pages 260-268
ISBN: 978-989-758-071-0
Copyright
c
2015 SCITEPRESS (Science and Technology Publications, Lda.)

the microcontroller allows advanced signal process-
ing to filter the noise and apply processing techniques
to achieve robust biosignal monitoring.
This work demonstrates the performance of our
platform with two kinds of vital signs: the acquisi-
tion of an Electrocardiogram (ECG), based on a 3
leads configuration, and of an Electroencephalogam
(EEG), using 2 fully differential channels. We imple-
mented, profiled and compared four approaches for
the PLI noise filtering. Furthermore, we show the per-
formance of the acquisition system and we compare
the results with a commercial state-of-the-art AFE
(AD7194) for the ECG and a non-portable hospital
device for multichannel bio-potential acquisition for
the EEG.
ECG data acquired with our system and with the
AD7194 chip exhibit similar characteristics, having a
signal-to-noise ratio (SNR) of 13.4 dB in our case and
12.3 dB for the AD7194. By applying PLI filtering
techniques we were able to improve the performance
of our system and to achieve a SNR of up to 30 dB.
The acquired EEG data was instead compared against
a state-of-the-art non-portable device, used in clini-
cal environments. We verified that data acquired by
the two systems has the same temporal evolution and
frequency spectrum.
The reminder of the paper is organized as follows:
Section 2 introduces related works; Section 3 illus-
trates the system setup and the nature of the signals
we are considering, while Section 4 describes the pro-
cessing techniques applied. Section 5 presents exper-
imental results. Finally, in Section 6 we draw the con-
clusions and discuss some future developments.
2 RELATED WORKS
In recent years, there have been numerous research
and commercial efforts in the design of wearable
biopotentials measurement systems. There are al-
ready several low-cost devices on the market, like
the ones from OMRON (Omron R7, 2004), Philips
(Philips MX40, 2011) and VIVAGO (Vivago 8005,
2012). All these devices offer limited computational
resources and are not designed for applications re-
quiring flexibility e.g. in terms of multi-modality
or number of channels. Their counterparts is repre-
sented by novel wireless portable and quite compact
systems, such as the g.MOBIlab+ by G.TEC (GTEC
g.MOBIlab, ), which at one side are more flexible,
enabling multi-modal multi-channel biosignal record-
ing, however being expensive and often requiring the
use of proprietary software.
At research level, physiological signals monitor-
ing systems have appeared since the MIThrill2003
prototype (DeVaul et al., 2003), which represents a
milestone in wearable computing platforms. It is
based on a PDA connected with a sensor board for
biopotential acquisition. The embedded sensor board
is equipped with a 3-axes accelerometer, temperature
sensor and an analog front-end for EMG-ECG acqui-
sition. Sampled data is transmitted from the sensor
board to the PDA for processing. Another important
similar project is the AMON platform (Anliker et al.,
2004), a monitoring system composed by a wrist-
worn device capable of measuring blood pressure, O
2
saturation, ECG and body temperature, which sends
acquired data to a base station for remote storage,
processing and support functionalities. Furthermore,
there is a 2-axis accelerometer to correlate vital pa-
rameters to user activity. The project (Mundt et al.,
2005) proposes a system to measure and collect bi-
ological data for up to 9 hours in extreme environ-
ments. The board is based on a PIC microcontroller
and can collect ECG, heart rate, blood pressure and
saturation, body temperature and movements. The
user can interact with the acquisition system using a
PDA, thus obtaining an unobtrusive system. How-
ever, the main limitation of all these architectures is
the need to transmit data from sensors to a PDA or
a base station. The sensor nodes are not equipped
with sufficient computational resources, thus the data
transmission limits the bandwidth of the processed
signals and has a significant impact on power con-
sumption. The recent advances in embedded sys-
tem integration enable on-board signal processing re-
quired to improve the quality of the signals and pos-
sibly to perform part of the signal processing, thus
opening the possibility to optimize the power con-
sumption. These are the opportunities we want to ex-
ploit in this work.
A wireless system performing on-board process-
ing is presented in (Buxi et al., 2012). The system is
equipped with a custom DSP and a TI MSP430 micro-
controller. The DSP is used to perform Indipendent
Component Analysis (ICA) and adaptive filtering to
detect heart rates and cardiac arrhythmia. Although
the system is well optimized for low power operation,
it is based on a custom DSP independent from the low
power commercial microcontroller, therefore limiting
scalability in more complex and diverse applications.
(Penders et al., 2011) presents a neck-band system
for cardiac activity monitoring, which implements a
CWT based BPM algorithm and an ECG derived res-
piration rate monitor. The data can be stored in an SD
card or transmitted by a low power radio. The digi-
tal platform is an MSP430 and the ASIC analog front
end offers great performance in terms of power con-
MultipleBiopotentialsAcquisitionSystemforWearableApplications
261

sumption (21µV), but it is connected to the microcon-
troller with an analog interface. An analog back-end
interface can be affected by additional noise and re-
duces the system scalability, when compared to digi-
tal interfaces. Recently, wearable systems started also
to cope with EEG signal acquisition and monitoring.
Several wireless and portable EEG monitoring sys-
tems have been published so far in literature. Some
implementations exploit discrete components (Sulli-
van et al., 2008) and (Chen and Wang, 2011), while
others rely on fully integrated systems, especially for
the implementation of low-noise analog front-end cir-
cuitries. An example of a fully implemented wireless
EEG sensor node is presented in (Brown et al., 2010)
which uses the analog front-end published in (Yazi-
cioglu et al., 2008). All these systems are strongly ori-
ented to a single application scenario therefore lack-
ing in flexibility. Furthermore, they cannot be used in
applications requiring multimodality, where data fu-
sion from heterogeneous sensors is required.
The lesson learned by these inspiring approaches
is that we must join the design of a high perfor-
mance AFE to allow the acquisition of the principal
biopotentials (EEG, ECG and EMG) with an efficient
microcontroller with integrated DSP functions. The
AFE must have a digital back-end with SPI or I2C to
provide a faster communication with the microcon-
troller, which must have sufficient computational re-
sources to locally execute algorithms for filtering and
information extraction, without data transmissions to
a base station.
3 SYSTEM DESCRIPTION
3.1 System Architecture
The Cerebro wearable device is a smart sensor node
designed for medical and fitness applications and its
high-level functional block diagram is shown in Fig.
1. This node consists basically of a multichannel
analog-front-end (AFE) with a digital interface. The
AFE is called Cerebro ASIC (Schonle et al., 2013),
which is responsible for the biomedical signal acqui-
sition. An ARM microcontroller with a FPU DSP
instruction set is used for noise filtering and further
feature extraction. Additional inertial and pressure
sensors have been added in order to collect data on
the patients’ motor activity. After biomedical signals
have been acquired and elaborated, they can be lo-
cally stored on a SD card or wirelessly transmitted by
a Bluetooth module to a nearby smart phone or tablet.
The supply of the system is handled by a dedi-
cated IC equipped with an internal switching voltage
I2C
JTAG
SPI
ELECTRODES
CONNECTOR
JTAG/SWD
USB
BATTERY
IMU
PRESSURE
SENSOR
SD
CARD
BLUETOOTH
MODULE
SENSORS
REGULATOR
MCU
REGULATOR
USART
SPI
ANALOG
DIGITAL
CEREBRO
ARM Cortex M4
MCU
POWER
MANAGEMENT
BLUETOOTH
REGULATOR
CEREBRO DIGITAL
REGULATOR
CEREBRO ANALOG
REGULATOR
Figure 1: Overview of the Cerebro wearable device.
regulator. This power management circuitry automat-
ically detects the power source in use (battery or USB
connector) and manages the recharging of the battery
while providing low-dropout voltage regulators to the
inertial and pressure sensors as well as to the Blue-
tooth module. This flexible solution for controlling
the power management allows us to switch-off sub-
modules of the board that are not required for a tar-
geted biomedical application and thus enhancing bat-
tery lifetime.
The board is designed on a 6 layers printed-
circuit-board (PCB) with a single ground plane, a split
power plane (between analog and digital) and 2 sig-
nal layers (top and bottom). Discrete components
are placed on both top and bottom layers in order
to further reduce the resulting board size, which is
85 × 50 mm.
The Cerebro AFE has already been tested with
ECG signals (Schonle et al., 2013) and for the recog-
nition of hand gestures using EMG signals for pros-
thesis control in (Benatti et al., 2014). In this work,
we aim at a more general scenario where the devel-
oped platform can be used in a large variety of differ-
ent biomedical applications including EMG, ECG and
EEG signal acquisition, or combinations of them. We
further analyze the nature and requirements of ECG
and EEG signals, which are used to prove the capa-
bilities of the biomedical platform.
3.2 ECG Signal
The ECG signal is one of the most important biosig-
nals that can provide a great amount of information in
medical and fitness applications. It senses the electri-
cal activity of the heart during its muscular contrac-
tions. During the heartbeat, the muscular cells on the
hearth surface depolarize their membrane. The result-
ing potential differences can be detected using sur-
face electrodes placed in a proper configuration and a
low noise signal amplifier. The typical frequencies of
ECG signals go from 0.01 to 250 Hz and the ampli-
tude is lower than 5 mV.
BIODEVICES2015-InternationalConferenceonBiomedicalElectronicsandDevices
262

As all the biosignals, the ECG is difficult to man-
age because it is a low amplitude signal affected by
different sources of noise (e.g. power line interfer-
ence, baseline wander, ground loop noise, muscular
contraction and respiration artifacts). For these rea-
sons, in the design of an ECG signal detection system
and, in general, for the design of a wearable device
for biopotentials measurement, the system level hard-
ware and software design is extremely important.
3.3 EEG Signal
EEG represents a collection of electrical voltages
recorded at different locations on the scalp of patients.
Electrical characteristics of these signals show a typ-
ical bandwidth range from 0.5 to 100 Hz with a peak
amplitude of about 100 µV. Such signals are gener-
ated by millions of underlying neurons that fire asyn-
chronously and are responsible for the brain activity.
Hence, the EEG recording does not contain the ac-
tivity of single neurons but the averaged activity of
millions of neurons. For this reason, raw (unpro-
cessed) EEG signals do not show any kind of reg-
ularity in the time-domain. However, after proper
band-pass filtering of the EEG signals, e.g. extract-
ing delta, theta, alpha and beta frequency bands, more
regular patterns can be identified, especially in the
lower frequency bands. These filtered EEG bands
are of high interest because they are strictly correlated
with the states in the brain such as wakefulness, sleep,
or even with some severe diseases including epilepsy
and neoplasms (Moore and Lopes, 1998), (Buzaki,
2006) and (Nunez and Srinivasan, 2006).
EEG evaluation is thus an important tool to learn
about brain functioning. The understanding of brain
functions, however, is currently limited to clinical en-
vironments and may not accurately reflect brain activ-
ities in the real world. Furthermore, long recordings
are feasible only during sleep as the EEG amplifiers
are large, inconvenient for patients, heavy, and need to
be plugged in, making it unable for patients to move
more than a few meters.
On the contrary, a wearable EEG device is not re-
stricted to these limitations, exploiting paradigms of
integration, low power operation, and small device
size (Casson et al., 2010). This increased degree of
freedom for the wearable EEG device allows to record
biological signals also outside of the clinical labora-
tory, increases the interests in the research field that
is currently restricted to medical use cases. Such a
portable device has countless applications with high
market potential, ranging from early detection of dis-
eases to the monitoring of well-being habits and cog-
nitive behavior.
To provide a satisfactory wearable EEG device,
it is essential to build it such that its performance is
comparable to those obtained in the state-of-the-art
clinical devices. We therefore compare our system
with the commonly used bench-top clinical device. It
is shown that we obtain similar performance in field
tests.
3.4 Data Processing
All applications relying on the acquisition of biopo-
tential signals share the common need to reduce noise
and interferences by digital post-processing. The
most common sources of interference are: power-
line interference (PLI), baseline wander (drift), move-
ment and breathing artefacts, changes in the electrode
impedance and intra-channel interference. In particu-
lar, PLI introduces a 50/60 Hz sine interference to the
signal. It is always noticeable, even when the system
is battery-powered (Serrano, 2003), that its accurate
removal is a critical but required task.
Different approaches have been presented in lit-
erature so far for the removal of PLI. The simplest
approach is a notch filter, which is a stop-band fil-
ter that allows to attenuate the frequency of a narrow
band. The rejected band depends on the quality factor
Q of the filter: with a Q = 50 the notch filter provides
10 dB attenuation at the frequency f
pli
± 0.5 Hz. This
approach has the advantage to be easily implemented
and to have low computational requirements, but it
introduces distortion in the signal power spectrum.
More advanced approaches have been developed
in literature to overcome the limitations of the notch
filter and to accurately separate the PLI from the
EEG signal. In particular, there are methods based
on time-domain subtraction (Levkov et al., 2005), re-
gression subtraction (Bazhyna et al., 2003) and sinu-
soidal modeling (Zivanovic and Gonz
´
alez-Izal, 2013).
These methods all share the basic approach, which
consists in the estimation of the sinusoidal interfer-
ence and its removal from the acquired signal. Brief
summaries of these technique is listed below.
The time-domain subtraction method first divides
the signal in linear and non-linear segments which
is performed by setting a threshold on the second
derivate of the signal. Then, in the linear segments,
the signal is averaged and the PLI is estimated, which
is then also removed from non-linear segments.
Regression-subtraction or time-correlated power-
line interference subtraction estimates the amplitude
and phase of the PLI and then subtracts it from sub-
sequent samples. This approach models the interfer-
ence as two quadrature sinusoids with the same fre-
quency and uses blocks of data to estimate it with a
MultipleBiopotentialsAcquisitionSystemforWearableApplications
263

(a) (b)
Figure 2: Raw ECG signals (top) and their FFTs (bottom) for the Cerebro platform (a) and for the AD7194 acquisition board
(b).
least-squares fit.
The sinusoidal modeling approach models the in-
terference by a set of harmonically related sinusoids
modulated by low order time polynomials. The poly-
nomial coefficients can be estimated by minimizing
the quadratic error between the signal and the model
in a given interval. Then the estimated PLI is sub-
tracted from the original signal to obtain a noise free
signal.
Time domain method relies on the separation of
linear and non-linear segments, which is easily ap-
plicable to ECG signals, but is not useful in other
cases. Regression-subtraction and sinusoidal model-
ing, on the other hand, use short intervals of signals
(0.5 − 1.5 s) to estimate the sinusoidal source, which
is then effectively removed from the original signals,
preserving their other characteristics.
4 EXPERIMENTAL RESULTS
4.1 ECG Signal Acquisition
To test the capabilities of our system and to com-
pare the different de-noising approaches, we used a
3-lead ECG acquisition scenario. In this set-up, we
used one differential channel of the AFE to acquire
the ECG signal. We placed two disposable electrodes
on the wrists of the user and an additional electrode
was placed on the ankle as the reference potential (pa-
tient ground).
The ECG signal was acquired with our platform
and with a reference state-of-the-art AFE, which is the
Analog Devices AD7194 chip. We used the develop-
ment board provided for this chip, which is equipped
with 8 analog channels and can be connected to a PC
via USB for the data acquisition. Our device sent the
sampled data to a PC via Bluetooth and all the col-
lected data was stored and processed on the PC. The
two systems have been configured in the most simi-
lar way possible, setting the acquisition frequency at
1 kHz and the gain at 8 for our device, while the ADC
was set to sample at 960 Hz with a gain of 128.
The signals acquired from the two devices are
plotted in Fig. 2, along with their frequency spec-
trums. From the plots we can observe that the two sys-
tems provide signals of comparable quality. The fre-
quency spectrum of the two acquired signals is very
similar. The Cerebro ASIC acquired signal exhibits a
strong PLI component at 50 Hz (the exact measured
frequency of the PLI was 55 Hz). The ADC has an in-
ternal filter, which reduces the PLI contribution. Us-
ing the data acquired with Cerebro, we implemented
and compared the PLI filtering techniques described
in the previous Section. Ideally, the perfect filter-
ing technique should remove the PLI component and
leave the rest of the signal frequency spectrum as it is.
The result of the PLI removal for the considered
approaches is shown in Fig. 3, where we plotted the
frequency spectrum for the raw and the filtered sig-
nals acquired with our system. From the plots we can
see that all the considered algorithms remove the PLI
component, but they alter the rest of the frequency
spectrum in different ways. We can note that the notch
filter removes also frequency components close to the
PLI, while the time-domain approach alters consider-
BIODEVICES2015-InternationalConferenceonBiomedicalElectronicsandDevices
264
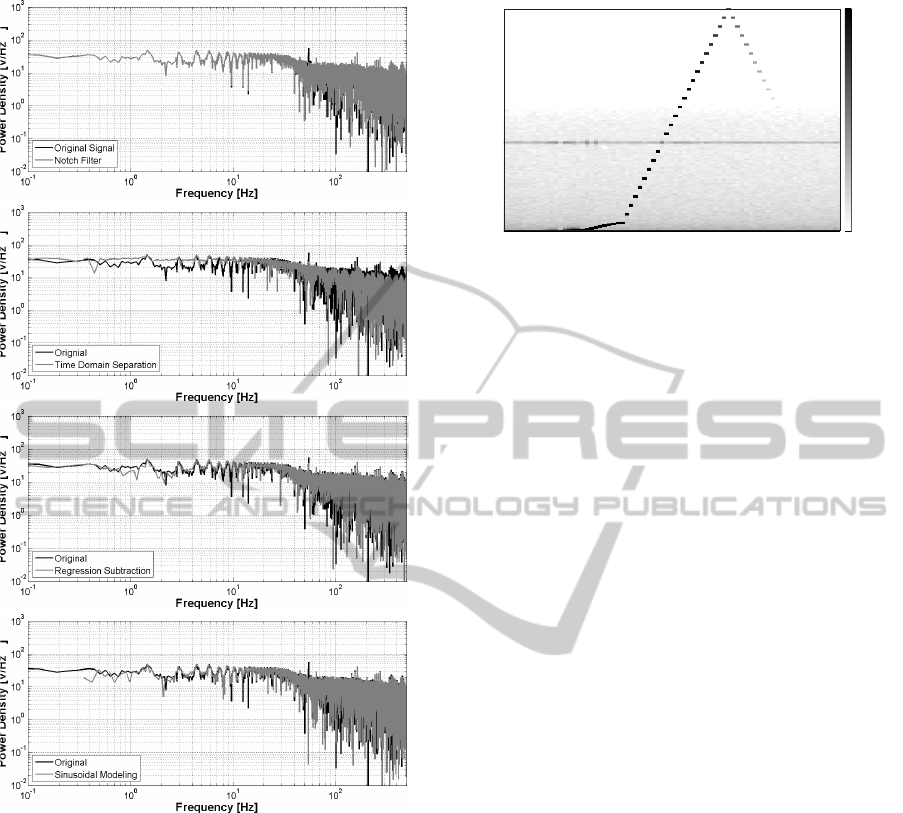
Figure 3: Comparison of the FFT of the PLI filtering tech-
niques (top to bottom): notch filter, time domain subtrac-
tion, regression subtraction and sinusoidal modeling.
ably the spectrum of the output signal, for both lower
and higher frequencies.
The regression-subtraction method is the one that
alters less the frequency spectrum of the signal, only
reducing the PLI component. Also the sinusoidal
modeling approach is very precise and removes cor-
rectly the PLI without additional changes in the sig-
nal. It is worth noting that the signals also present
interferences at frequencies multiple of the main PLI
component (e.g. 100 Hz), which can be removed ap-
plying the considered approaches also for those fre-
quencies.
To summarize the results of this comparison,
we computed the SNR of the filtered signals, ob-
taining 21.9 dB for the notch filter, 28.3dB for the
10 20 30 40 50 60 70
20
40
60
80
100
120
epoch
frequency [Hz]
−20
−15
−10
−5
0
5
10
15
20
25
30
0
0
Figure 4: Color-coded power spectra of consecutive 90-s
epochs (4 s window) with Hanning window. Data was sam-
pled with 250 Hz. Spectra are color coded on a logarithmic
scale, 30 dB corresponds to an input signal with an ampli-
tude of 100µV.
time-domain subtraction, 29.5 dB for the regression-
subtraction and 30.4 dB for the sinusoidal modeling
approach. The latter two methods deliver consider-
ably better signal quality and are the ones chosen to
be used in our system. In particular, the regression
subtraction method has been implemented and used
for the final ECG and EEG applications, since it is
the one that preserves better the frequency response
of the system.
4.2 EEG Signal Acquisition
A spectrogram is shown in Fig. 4, which gives a bet-
ter insight on the overall performance of the wearable
EEG device. The color map on the right hand-side
has the dimension decibel and indicates the power
of the recorded signal. A 100µV sinusoidal signal
is sampled with the device at a sampling frequency
of 250 Hz while the input sinusoidal signal frequency
is increased over time from 0 to 250 Hz. Each EEG
channel of the device is low-pass filtered at a cut-
off frequency of 66 Hz. The dots on the illustration
represents the sinusoidal amplitude changes (from
grey to white) indicating the signal attenuation by the
low-pass filter. The spectrogram also shows signals
aliased back in the Nyquist band which were gener-
ated by feeding the EEG device with sinusoidal sig-
nals with frequencies higher than half of the sampling
frequency. The horizontal gray line at 50 Hz is the
residual of the mains interference being successfully
suppressed to a certain degree and does not signif-
icantly disturb the EEG signal. This spectrogram il-
lustrates that the Cerebro AFE is well-suited to record
EEG signals with amplitudes below 100µV. In the
frequency band of interest, i.e., from 0.5 to 100 Hz, a
signal-to-noise ratio of more than 35 dB is observed.
In order to provide a useful wearable EEG device,
MultipleBiopotentialsAcquisitionSystemforWearableApplications
265

11
22
R1
R2
G
Figure 5: Illustration of the electrodes arrangement on the
head of the patient with the denoted patient ground G. The
pairs of electrodes are split in colors where the gray ones
are referenced to the right ear (R2) and the the white ones
to the left ear (R1).
it is essential to build it such that its performance is
comparable to those obtained in the state-of-the-art in
clinical use. For this reason, a direct comparison with
the commonly used state-of-the-art device in hospitals
is performed in this paper to show that the wearable
EEG device achieves similar performance.
The specification of the wearable EEG device is
performed taking the recorded EEG signals from both
devices, i.e., our wearable EEG device with limited
hardware resources and the state-of-the-art record-
ing device in operation at the University Hospital of
Zurich (USZ) which has no limitations in power con-
sumption and hardware resources. The EEG signals
are simultaneously acquired from the same patient at
a sampling frequency of 250 Hz with the wearable
EEG device and at 256 Hz with the USZ device.
Fig. 5 illustrates the placement of electrodes on
the scalp of the patient. During the recording, a test
subject is connected to different EEG channels, where
two out of four channels are connected to the wear-
able EEG device (numbered gray electrodes), while
the remaining two are connected to the state-of-the-
art device used in USZ (numbered white electrodes).
The pairs of electrodes connected to both devices are
placed next to each other in order to record EEG sig-
nals from the common source.
The current measurement setup in use at USZ con-
sists of polygraphic amplifiers provided by Artisan
(Micromed, Mogliano Veneto, Italy) and the record-
ing is performed using the Rembrandt Datalab (Em-
bla System, Broomfeld, CO, USA). Before analog-to-
0 1 2 3 4 5 6 7 8 9 10
−40
−20
0
20
40
60
time [sec]
amplitude [µV]
state-of-the-art in USZ
wearable EEG device
0 1 2 3 4 5 6 7 8
−20
−10
0
10
20
time [sec]
amplitude [µV]
0 1 2 3 4 5 6
−10
−5
0
5
10
time [sec]
amplitude [µV]
0 0.5 1 1.5 2 2.5 3 3.5 4
−10
−5
0
5
10
time [sec]
amplitude [µV]
zoom
delta band
theta band
alpha band
beta band
Figure 6: First pair of EEG channels comparing the wear-
able EEG device with the state-of-the-art in USZ. Brain
waves are obtained after proper filtering and decomposing
of the EEG signals in delta, theta, alpha, and beta frequency
bands.
digital quantization is done, the analog EEG signals
are high-pass (-3 dB at 0.16 Hz) and low-pass filtered
(-3 dB at 67.2 Hz), as indicated in (Moore and Lopes,
1998).
In the wearable EEG device, the analog front-end
(Schonle et al., 2013) samples the analog signals at
250 Hz. After the analog-to-digital quantization, dig-
ital high-pass (-3 dB at 0.16 Hz) and low-pass filtering
(-3 dB at 66 Hz) is performed on the digitized signals.
After acquiring the EEG signals from the two ac-
quisition systems, a post-processing filter has been
applied in order to highlight major cerebral waves of
the patient. As illustrated in Fig. 6, the EEG Channel-
1 of both devices deliver similar EEG signal patterns
for the different EEG bands of interest (Channel-2
shows very similar behaviour, not shown). For both
devices, waves are obtained according to the follow-
ing scheme: delta low-pass filter at 4 Hz, theta band-
pass filter between 4 and 7 Hz, alpha band-pass filter
between 7 and 15 Hz while beta is band-pass filter be-
tween 15 to 30 Hz.
FFT plots of the two acquired channels are shown
in Fig. 7, which provides a different perspective of the
measured EEG. Frequency responses of both devices
overlap over the whole Nyquist frequency band. The
BIODEVICES2015-InternationalConferenceonBiomedicalElectronicsandDevices
266

state-of-the-art in USZ
wearable EEG device
frequency [Hz]
power density [µV/√Hz]
100101
100
1
10
-2
10
-1
10
-2
10
-4
frequency [Hz]
power density [µV/√Hz ]
100101
100
1
10
-2
10
-1
10
-2
10
-4
state-of-the-art in USZ
wearable EEG device
1 pair of electrodes
st
2 pair of electrodes
nd
Figure 7: Frequency response of the two electrode pairs.
FFTs are very similar in amplitude except for the notch filter
at 50 Hz of the USZ acquisition system.
only noticeable difference is that the USZ device uses
a notch filter to cancel mains interference while the
wearable EEG device handle this problem by apply-
ing the regression subtraction approach and subtract-
ing the estimated interference signals (Schonle et al.,
2013).
5 CONCLUSION
In this paper, we presented the design and evaluation
of a wearable node able to acquire heterogeneous vi-
tal signs and having on-board filtering and processing
capabilities. In particular, we considered the acqui-
sition of EEG and ECG signals, comparing our sys-
tem with state-of-the-art solutions. We also described
the implementation and the results of different de-
noising algorithms that can be executed in real-time
with our platform. We demonstrated that the output
of the Cerebro node for EEG and ECG signal filters
accurately the power-line noise reaching a SNR of
30dB, which is comparable with state-of-the-art de-
vices, while represents a much less expensive solu-
tion.
Furthermore, Cerebro offers higher scalability
w.r.t. comparable commercial devices or other re-
search prototypes and higher flexibility in terms of
multi-modality. Therefore, we think that the proposed
wearable platform has high potential to be used not
only for the monitoring of vital signs, but also for
biomedical real-time signal processing. The Blue-
tooth interface allows to connect the Cerebro board
to mobile devices paving the way to the development
of efficient user interfaces for clinician and patients.
Future work will explore the use of Cerebro out of the
lab, exploiting the scalability of the system and chal-
lenging the ability to perform complex algorithms on-
board.
ACKNOWLEDGEMENTS
The authors gratefully acknowledge the support of T.
Kleier, M. Lanz, F. Schulthess, A. Malafeev, and T.
Burger. Further thanks go to the medical research
partners, particularly P. Achermann. This work is
funded by the Nano-Tera.ch RTD Project WearMe-
Soc, which is financed by the Swiss Confederation
and scientifically evaluated by SNSF. It is also funded
by INAIL Prosthetics Center in Vigorso di Budrio
(Italy) and by EU project PHIDIAS (g.a. 318013).
REFERENCES
Anliker, U., Ward, J., Lukowicz, P., Troster, G., Dolveck,
F., Baer, M., Keita, F., Schenker, E., Catarsi, F., Coluc-
cini, L., Belardinelli, A., Shklarski, D., Alon, M., Hirt,
E., Schmid, R., and Vuskovic, M. (2004). AMON:
a wearable multiparameter medical monitoring and
alert system. Information Technology in Biomedicine,
IEEE Transactions on, 8(4):415–427.
Bazhyna, A., Christov, I., Gotchev, A., Daskalov, I., and
Egiazarian, K. (2003). Powerline interference sup-
pression in high-resolution ECG. In Computers in
Cardiology, 2003, pages 561–564. IEEE.
Benatti, S., Milosevic, B., Casamassima, F., Schonle, P.,
Bunjaku, P., Fateh, S., Huang, Q., and Benini, L.
(2014). EMG-based hand gesture recognition with
flexible analog front end. In proceedings of the 2014
IEEE Biomedical Circuits and Systems Conference
(BioCAS).
Brown, L., van de Molengraft, J., Yazicioglu, R., Torfs, T.,
Penders, J., and Van Hoof, C. (2010). A low-power,
wireless, 8-channel EEG monitoring headset. In En-
gineering in Medicine and Biology Society (EMBC),
2010 Annual International Conference of the IEEE,
pages 4197–4200.
Buxi, D., Berset, T., Hijdra, M., Tutelaers, M., Geng, D.,
Hulzink, J., van Noorloos, M., Romero, I., Torfs, T.,
and Van Helleputte, N. (2012). Wireless 3-lead ECG
system with on-board digital signal processing for am-
bulatory monitoring. In Biomedical Circuits and Sys-
tems Conference (BioCAS), 2012 IEEE, pages 308–
311.
MultipleBiopotentialsAcquisitionSystemforWearableApplications
267

Buzaki, G. (2006). Rhythms of the Brain. Oxford University
press, London, 2nd edition.
Casson, A., Yates, D., Smith, S., Duncan, J., and Rodriguez-
Villegas, E. (2010). Wearable electroencephalogra-
phy. Engineering in Medicine and Biology Magazine,
IEEE, 29(3):44–56.
Chen, X. and Wang, J. (2011). Design and implementa-
tion of a wearable, wireless EEG recording system. In
Bioinformatics and Biomedical Engineering, (iCBBE)
2011 5th International Conference on, pages 1–4.
DeVaul, R., Sung, M., Gips, J., and Pentland, A. (2003).
MIThril 2003: applications and architecture. In Wear-
able Computers, 2003. Proceedings. Seventh IEEE In-
ternational Symposium on, pages 4–11.
GTEC g.MOBIlab. http://www.gtec.at/Products/Hardware-
and-Accessories/g.MOBIlab-Specs-Features.
Levkov, C., Mihov, G., Ivanov, R., Daskalov, I., Christov,
I., and Dotsinsky, I. (2005). Removal of power-line
interference from the ECG: a review of the subtraction
procedure. BioMedical Engineering OnLine, 4(1):50.
Moore, R. and Lopes, J. (1998). IFCN standards for digital
recording of clinical EEG. the international federation
of clinical neurophysiology. In Electroencephalogr
Clin Neurophysiol Suppl. PubMED.
Mundt, C., Montgomery, K., Udoh, U., Barker, V., Thonier,
G., Tellier, A., Ricks, R., Darling, B., Cagle, Y.,
Cabrol, N., Ruoss, S., Swain, J., Hines, J., and Ko-
vacs, G. (2005). A multiparameter wearable physio-
logic monitoring system for space and terrestrial ap-
plications. Information Technology in Biomedicine,
IEEE Transactions on, 9(3):382–391.
Nunez, P. and Srinivasan, R. (2006). Electric fields of the
brain: the neurophysics of EEG. Oxford University
Press, London, 2nd edition.
Omron R7 (2004). http://www.omron-healthcare.com/eu/
en/our-products/blood-pressure-monitoring/r7.
Penders, J., van de Molengraft, J., Altini, M., Yazicioglu,
F., and Van Hoof, C. (2011). A low-power wireless
ECG necklace for reliable cardiac activity monitoring
on-the-move. Proc. of the Intl. Conf. of the IEEE En-
gineering in Medicine and Biology Society.
Philips MX40 (2011). http://www.usa.philips.com/healthcare-
products/HC862115/intellivue-mx40-wearable-
patient-monitor.
Schonle, P., Schulthess, F., Fateh, S., Ulrich, R., Huang, F.,
Burger, T., and Huang, Q. (2013). A DC-connectable
multi-channel biomedical data acquisition ASIC with
mains frequency cancellation. In ESSCIRC (ESS-
CIRC), 2013 Proceedings of the, pages 149–152.
Serrano, Roberto E., e. a. (2003). Power line interference
in ambulatory biopotential measurements. Proceed-
ings of the 25th Annual International Conference of
the IEEE, 4.
Sullivan, T., Deiss, S., Jung, T.-P., and Cauwenberghs, G.
(2008). A brain-machine interface using dry-contact,
low-noise EEG sensors. In Circuits and Systems,
2008. ISCAS 2008. IEEE International Symposium
on.
Vivago 8005 (2012). http://www.vivago.com/products-and-
services/products/care-8005/.
WHF(2012). http://www.world-heart-federation.org/cardio
vascular-health/global-facts-map/.
WHO (2012). http://www.who.int/mental
health/neurology/
neurological disorders report web.pdf.
Yazicioglu, R., Merken, P., Puers, R., and Van Hoof, C.
(2008). A 200 uw eight-channel EEG acquisition
ASIC for ambulatory EEG systems. Solid-State Cir-
cuits, IEEE Journal of, 43(12):3025–3038.
Zivanovic, M. and Gonz
´
alez-Izal, M. (2013). Simultaneous
powerline interference and baseline wander removal
from ECG and EMG signals by sinusoidal modeling.
Medical engineering & physics, 35(10):1431–1441.
BIODEVICES2015-InternationalConferenceonBiomedicalElectronicsandDevices
268
