
Procedural City Model using Multi-source Parameter Estimation
Cornelis Stal
1,2
, Britt Lonneville
1
, Philippe De Maeyer
1
, Annelies Vandenbulcke
1
,
Mieke Paelinck
2
and Alain De Wulf
1
1
Department of Geography, Ghent University, Krijgslaan 281 (building S8), Ghent, Belgium
2
Department of Real Estate and Land Surveying, Faculty of Nature and Technology, Ghent University College,
Valentin Vaerwyckweg 1, Ghent, Belgium
{cornelis.stal, britt.lonneville, philippe.demaeyer, annelies.vandenbulcke, alain.dewulf}@ugent.be
{cornelis.stal, mieke.paelinck}@hogent.be
Keywords: City Modelling, Parameterization, 3D, Scripting, Airborne Laser Scanning.
Abstract: Most current digital 3D city modelling procedures have either a low degree of automation or require
specialized skills. Moreover, the construction process is the result of an equilibrium between the desired
level of detail on the one hand and modelling performance on the other hand. Although environmental 3D
models and 3D city models in particular are essential for a wide range of applications and disciplines, these
difficulties are substantial bottle necks for the availability of the models. In this paper, initial steps and ideas
behind a novel approach for the construction of 3D city models are presented using an Airborne Laser
Scanning (ALS) point cloud and standard digital 2D data. The first step involves point processing and
feature detection for an ALS point cloud, resulting in the separation of building and ground points from
vegetation and other points in the point cloud. Secondly, the detected building features are described in
more detail using the 2D data, allowing the distinction between roof points and façade points. A texture map
is assigned to the detected features using image libraries. The 2D data are also used for the improvement of
vegetation mapping. The novelty of this approach is the fact that the actual city modelling is performed
using recently made available software. The used software allows the interpretation of conceptual rules for
the automated modelling of real-world environments. The proposed workflow is illustrated by the
construction of a city model of some part of Geraardsbergen (Belgium).
1 INTRODUCTION
Digital 3D models of urban environments and
landscapes play an essential role in a large range of
applications. Urban planning, city management,
calamity control, solar panel potential mapping,
noise mapping or the development of the 4G
network require virtual models with various Levels
of Detail (LoD), non-spatial attributes and spatial
context. Especially for higher LoDs, the manual
production of these models is common practice (Heo
et al. 2013), whereas the automatic construction of
3D city models using airborne data is still a
challenging task (Nguyen et al., 2012). It is often
required to describe the geometry of the digital
urban model by a limited number of features, while
the study area is oversampled by a point cloud. In
general, two types of 3D models can be developed
starting from an urban point cloud. On the one hand,
the simplest type contains a triangulation or series of
tetrahedrons of the ALS point cloud, possibly after a
point classification is performed (Penninga et al.
2006). This type of model is easy to construct, but is
hard to handle because of the considerable
computational requirements and difficulty to
explicitly define real-world objects. On the other
hand, 3D models built using geometric solid
primitives, are very easy to describe, but they
require complex extraction techniques and they
result in a significant loss of detail.
Regardless of the kind of 3D model that is aimed
at, 3D urban environmental models are mostly
generated using multiple spatial data sources. 3D
city mapping using aggregates of spatial data is
based on a chain of multiple processes. These
processes have been discussed for many decades and
involve filtering, classification, detection, modelling
and simplification of geometric features, as well as
texture mapping and semantic enrichment of these
features (Haala and Kada 2010). Map digitation,
photogrammetric processing or ALS-based feature
extraction are the most common techniques for 3D
233
Stal C., Lonneville B., De Maeyer P., Vandenbulcke A., Paelinck M. and De Wulf A..
Procedural City Model using Multi-source Parameter Estimation.
DOI: 10.5220/0005466602330238
In Proceedings of the 1st International Conference on Geographical Information Systems Theory, Applications and Management (GISTAM-2015), pages
233-238
ISBN: 978-989-758-099-4
Copyright
c
2015 SCITEPRESS (Science and Technology Publications, Lda.)
city mapping (Gruen 2008). The modelling
workflow proposed in this paper is based on the
geometric reconstruction of a city model using ALS
point clouds, repetitive texture mapping through
image libraries and semantic enrichment using large
scale 2D digital data. ALS is a common 3D data
acquisition technique for the modelling of urban and
rural environments (Doneus et al., 2008; Oude et al.,
2011; Stal et al., 2013).
Although 3D city mapping is still a dynamic
research topic, it appears that most contributions
mainly focus on either data acquisition, data
processing or data management as separated steps
for city modelling. In this paper, an integrated
approach on 3D city modelling is presented.
Different governmentally acquired large scale data
sets will be used for the construction of a 3D virtual
model. The final objective of this project is the
automated construction of 3D city models, defined
by CityGML. CityGML is a standard for modelling
and exchanging virtual 3D city maps (Kolbe et al.,
2005). Interesting attempts to use such data in a
national or state context are presented for the
Netherlands (van den Brink et al., 2013) and
Germany (Over et al., 2010). In a Belgian context,
challenges on the implementation of CityGML for
the Flemish large scale map (GRB: Grootschalig
Referentie Bestand or Large Scale Reference File)
are discussed (De Cubber and Van Orshoven, 2012).
These authors mainly focus on the different
approaches in defining relations between features
and on the rather divergent ontology.
The proposed methodology is illustrated by a
case study in the city of Geraardsbergen (Belgium).
It will be clear that this procedure results in very
good models in LoD2 and after some modifications
in LoD3 as well. The workflow enables a smooth
integration of city modelling projects in other
projects, where spatial data are used for
environmental studies, planning or management. For
example, the data could efficiently be used in smart
city projects, especially if the city models are further
enriched with available data sets of a different kind,
including, for instance, building information, public
transport data, electricity grid data, and so forth.
2 USED DATA
The Flemish Geographical Agency (AGIV) has
organized an ALS campaign over the city of
Geraardsbergen in April 2012, aiming at updating
the previous point cloud of the Flemish Region
(Belgium). In contrast with the previously acquired
data set in 2003, the new point cloud has a relatively
high density (25 p/m
2
against 0.25 p/m
2
). For the
new campaign, an IGI LiteMapper 6800 was used at
a flying height of 390 m and having a measuring
frequency of 266·000 Hz. The test area has a size of
approximately 30 km
2
and has a great variability of
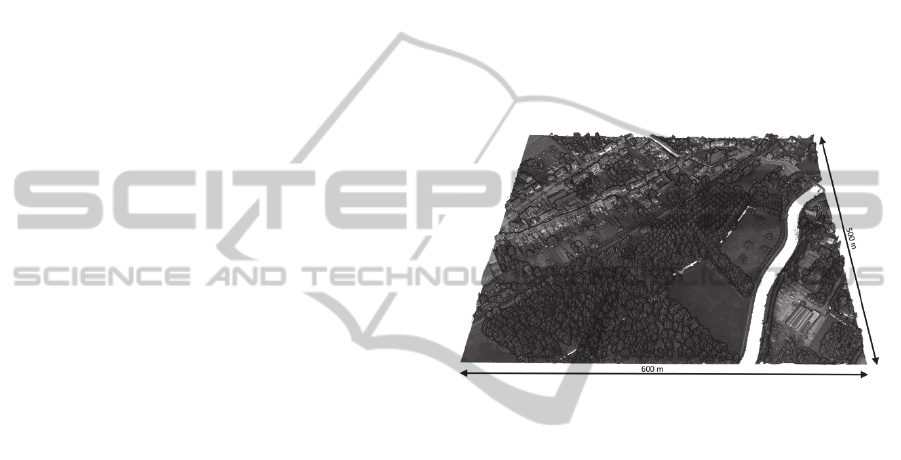
rural landscapes (AGIV 2013). A sample of the ALS
data is presented in Figure 1. The semantic data for
the city models are gathered from the GRB, which is
a Flemish kind of cadastre. OpenStreetMap (OSM)
data is used for further modelling of infrastructure in
the study area. For this research, it is assumed that
the ALS data set, the GRB data set and the OSM
data set are geometrically consistent (Stal et al.,
2013).
Figure 1: Bird’s eye view of the ALS point cloud.
3 METHODOLOGY
3.1 Point Cloud Filtering
One of the main requirements when dealing with
ALS point clouds, is an accurate and efficient point
classification or filtering (Briese, 2010; Pfeifer and
Mandlburger, 2008). Using ALS sensors, the
backscatter of the laser signal can occur on either
ground or non-ground objects, resulting in a single
point per transmitted signal. Moreover, due to the
laser beam footprint size, several objects at different
distances may contribute to the echo waveform, e.g.
the canopy of a tree and the underlying ground. In
this case, it is useful to distinct first, second,…
echoes. Since point sets are frequently just a large
list of point coordinates without further attributes,
most classification algorithms are typically based on
geometrical properties and neighbourhood functions
(Sithole and Vosselman, 2004). In the 3D city
mapping workflow presented in this paper, the point
classifier of LASTools is used (Isenburg and
Shewchuk, 2013). The software has the ability to
perform the entire point processing workflow in a
GISTAM2015-1stInternationalConferenceonGeographicalInformationSystemsTheory,ApplicationsandManagement
234

batch process or in a Python script in ESRI ArcGIS.
Based on generated messages during the point
classification, the following pseudo-code can be
formulated:
Input unclassified point cloud
Set units, step size, spike size and
offset size (m, 5, 1+10, 0.05)
Find initial ground points
Generate initial ground estimate
Refine ground points
Add terrain features
Integrate points higher than the
threshold
Calculate elevation of non-ground
points above the ground
Classify non-ground points
If point in planar neighbourhood
then roof
Else if Point in rough
neighbourhood than vegetation
Else set unknown
The resulting point cloud contains ground points and
points classified as buildings (actually as roofs, since
building façades are not explicitly detected) and
vegetation. If no class can be assigned to a point
with a certain probability, the class of this point is
set to unknown. Ground points are converted to an
equidistant terrain model, but all other points are
used for the actual feature modelling. An example of
a classified point cloud is presented in Figure 2.
Figure 2: Classified ALS point cloud with separated
ground (green), building (red), vegetation (yellow) and
unknown (blue) points.
3.2 Rule-based Geometric Modelling
For the succeeding modelling steps, Autodesk
Infraworks (360) is used. This software allows the
import of various spatial data sets and the
unambiguous establishment of the behaviour of each
feature in the model. Interesting scripting tools,
based on JavaScript, are available to this purpose.
The definition of buildings, roads and vegetation are
described below.
3.2.1 Building Geometry
Points belonging to a building are classified in
correspondence to the LAS specifications.
Consequently, these points are actually
corresponding to measured roof points and do not
include façades. In order to reconstruct façades, an
additional filter is required for all unclassified points
situated inside a building polygon from the 2D data
set. As all other points, the extracted façade points
contain a RGB colour value. This value will be used
to define the appearance of the features,
corresponding with an image library. This procedure
is not yet implemented in the current version of the
workflow.
LASTools is also used to calculate the normalized
height of each roof point (i.e. height above the
ground). Instead of considering the maximum
normalized elevation value for the height of a
building, the maximum of the 95% lowest elevations
is taken. This allows the elimination of outliers,
assuming that the number of points per building is
relatively large.
The shape of the roof is derived by calculating a
slope map for each building. The slope of a building
is then defined by the mean value of all pixels within
the building polygon. In the current version of the
workflow, only one roof type is considered with an
equal upwards slope starting from each side of the
building. Hence, more complex roof type detectors
or geometrical reconstruction algorithms are
required for further optimization.
3.2.2 Vegetation Geometry
For the determination of the location of trees in the
study area, LASTools is used again. As for the
building points, a normalized elevation is calculated
for each vegetation point. Then, all points with an
elevation between [1.5;2.5] m above the ground are
extracted. It is assumed that these points correspond
with isolated tree stems. Thereafter, a series of
disjoint convex hulls is calculated. In the current
version of the workflow, it is assumed that each
centre point of these hulls corresponds with the
actual coordinates of a tree. The centre point is
defined by the centre of gravity for each polygon.
Again, the maximum of the 95% lowest points is
taken to define the height above the ground for each
tree.
Additionally, very intuitive criteria are
implemented for the final acceptation or rejection of
a tree. Trees cannot be situated on roads, railway
beds or in the water. Furthermore, detected trees
inside building polygons are rejected as well. These
ProceduralCityModelusingMulti-sourceParameterEstimation
235
situations may occur with erroneously calculated
centre points of very complex hulls.
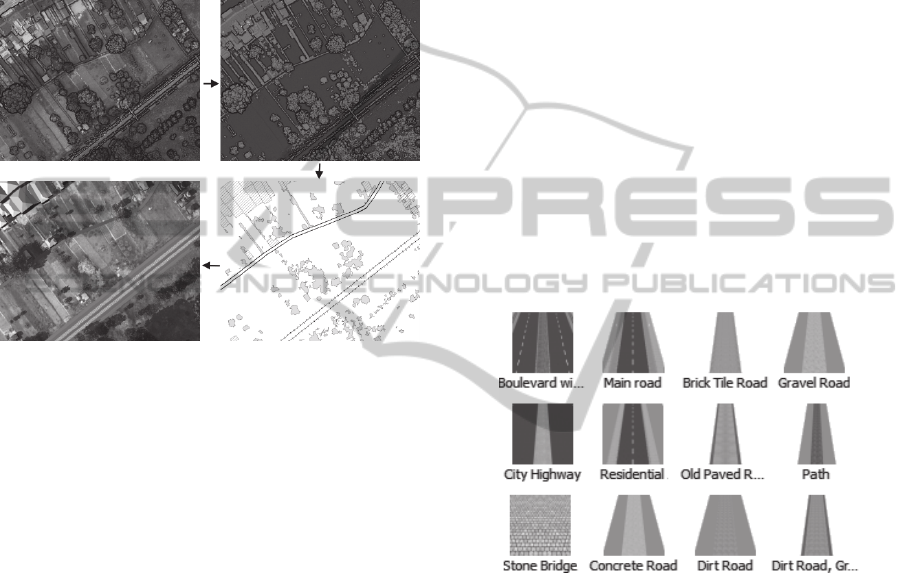
The vegetation modelling steps are summarized
in Figure 3, where the original point cloud (upper
left) is classified (upper right) and boundary
polygons are calculated based on the disjoint convex
hulls of each clustered point cloud subsample (lower
right), resulting in a final tree set within the model
(lower left).
Figure 3: Modelling vegetation: original and classified
point cloud (top), disjoint convex hulls (lower right) and
resulting trees (lower left).
3.3 Model Appearance
3.3.1 Buildings and Vegetation
As with the geometric modelling of the roofs of
buildings, the appearance of each building is
simplified by the random selection of a standard
texture map. The same holds for the detected trees in
the model, where only the height above the ground
is considered as a variable for each unique object. In
both cases, the representation of each feature is
determined by the creation of a relation between
each feature and an entry in the internal style library
of the software. In this context, a feature is an object
or part of an object (for trees) or part of an object
(for buildings, which contain a roof and a façade).
As will be mentioned in the discussion, a more
advanced representation selection will be
implemented in the near future using texture
correlation indices.
3.3.2 Infrastructure
The feature type attributes of the OSM data set are
used to explicitly define the visual representation of
roads, railways and waterways. A sample of a
JavaScript is presented below to illustrate this
procedure, where a switch case statement is
implemented.
switch(streetType) {
case("primary"): ROADS.RULE_STYLE
= "Street/Main road"; break;
case("secondary"):
ROADS.RULE_STYLE =
"Street/Sidewalk and Greenspace";
break;
case("residential"):
ROADS.RULE_STYLE =
"Street/Residential"; break;
case
...
default:ROADS.RULE_STYLE =
"Street/Cobblestone - Loose";
}
In this case, the attribute ‘streetType’ calls a specific
representation from the style library (Figure 4). Both
the definition of a list of relevant street types and the
appearance of each style can be modified as a
function of the requirements of the project.
Figure 4: Sample of different standard street type styles.
4 RESULTS
A sample of the results is presented in Figure 5, with
approximately the same viewpoint as in Figure 1 and
Figure 2. It must be mentioned that this view is
pointing from south to north. Shading in these
models are managed by the software and can be set
as desired. Two additional close-ups are presented in
Figure 6 and Figure 7, indicating the high visual
quality of the 3D city models.
These models can easily be exported by the
software to various 3D file formats, such as Collada
(DAE) or Wavefront (OBJ). The conversion of these
models to CityGML is straightforward, provided that
the relation between the 3D features in the model
and the attribute data from the 2D data are retained.
GISTAM2015-1stInternationalConferenceonGeographicalInformationSystemsTheory,ApplicationsandManagement
236
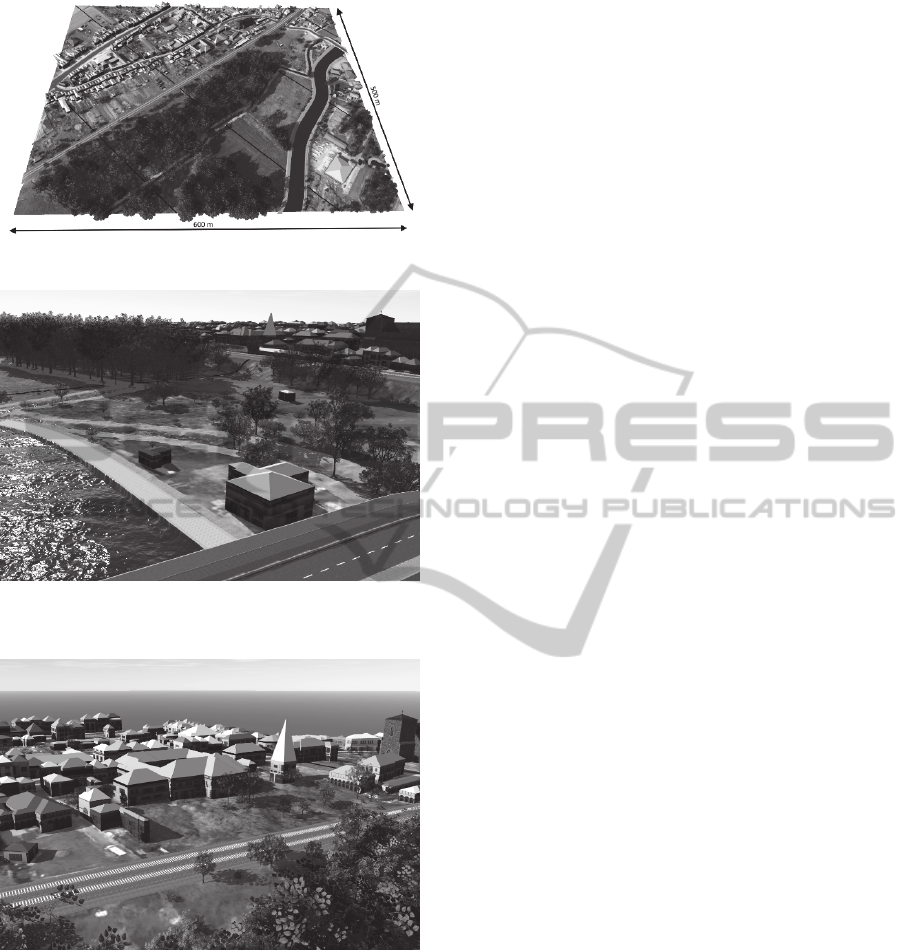
Figure 5: Overview of the resulting 3D model.
Figure 6: Close-up of the resulting 3D model, taken from
the bridge over the water in south-western direction.
Figure 7: Close-up of the resulting 3D model, taken from
above the forest in north-western direction.
5 DISCUSSION
Despite the visually attractive results of the proposed
city modelling workflow, some reflections and
suggestions for further work are presented in this
section. First of all, more complex geometric and
appearance modelling definitions are required for
buildings and vegetation. The outline of buildings is
simply defined by polygons from the 2D data set.
Neither these polygons, nor the modelling software
take the actual roof shape into account (saddle roof,
pyramidal roof, composite of complex structures…).
Consequently, a geometric roof reconstruction
algorithm has to be implemented, either model-
based or data-based (Dorninger and Pfeifer 2008).
This reconstruction is required prior to the data
import in Autodesk Infraworks (360). An important
challenge for such a classifier is the occurrence of
complex building structures, such as a main building
with a saddle roof and an annex with a flat roof.
Furthermore, 3D information should be extracted
from the ALS point cloud to model extensions in the
façades (balconies, bay windows, …). Feature
splitting is advisable for these buildings. A roof type
library could be implemented in a comparable
fashion as the road appearance protocol described
above. Regarding the appearance of the buildings,
the ability to use the RGB values from the ALS
should be reiterated. Roof appearance generally has
a low textural complexity, whereas (geometric and
radiometric) façade information from ALS data is
limited. An interesting approach to correlate
building objects with the most appropriate texture
map from a library, is therefore based on matching
techniques and conceptual texture synthesis (Wei et
al. 2009). In this case, the cumulative distribution of
the (normalized) RGB-values of the separated roofs
and façades are compared to cumulative
distributions, calculated for a series of candidate
texture maps. The resulting texture map is then
draped over the geometry of the feature. Specifically
for vegetation, the use of the tree height was the only
unique parameter for each tree. In order to
distinguish various trees based on species and object
shape (height, crown shape, spatial distribution of
ALS subsample), a more detailed descriptor is
required (Holmgren and Persson 2004).
6 CONCLUSION
The proposed workflow is a good starting point for
automated conceptual 3D city modelling. A
combination of governmental data and open data is
used for the construction of visually attractive but
accurate 3D city models. Notwithstanding the huge
number of degrees of freedom in the used software,
reasonable automation is gained by the
implementation of JavaScript code. Buildings,
vegetation and infrastructure are processed in the
workflow, but more sophisticated approaches are
required for an increased accuracy. Hence, advanced
ProceduralCityModelusingMulti-sourceParameterEstimation
237

geometric feature detection algorithms and texture
synthesis techniques will be implemented in the
workflow in the near future.
ACKNOWLEDGEMENTS
The authors would like to express their gratitude to
the Flemish Geographical Information Agency
(AGIV) for providing the various data sets.
REFERENCES
AGIV, 2013. www.geopunt.be.
Briese, C., 2010. Extraction of digital terrain models. In
Airborne and terrestrial laser scanning. Dunbeath,
UK: Whittles Publishing, p. 135–167.
Van den Brink, L., Stoter, J., Zlatanova, S., 2013.
Establishing a national standard for 3D topographic
data compliant to CityGML. International Journal of
Geographic Information Science, 27(1), p. 92–113.
De Cubber, I., Van Orshoven, J., 2012. Towards an
internationally more accessible data model for the
GRB, the 2D-large scale topographic inventory of
Flanders. In R. Billen et al., eds. USB-Proceedings of
the Spatial Analysis and Geomatics. Liège, Belgium,
p. 145–157.
Doneus, M., Briese, C., Fera, M., Janner, M., 2008.
Archaeological prospection of forested areas using
full-waveform airborne laser scanning. Journal of
Archaeological Science, 35(4), p.882–893.
Dorninger, P., Pfeifer, N., 2008. A comprehensive
automated 3D approach for building extraction,
reconstruction and regularization from airborne laser
scanning point clouds. Sensors, 8(11), p.7323–7343.
Gruen, A., 2008. Reality-based generation of virtual
environments for digital earth. International Journal
of Digital Earth, 1(1), p.88–106.
Haala, N., Kada, M., 2010. An update on automatic 3D
building reconstruction. ISPRS Journal of
Photogrammetry and Remote Sensing, 65(6), p.570–
580.
Heo, J., Jeong, S., Park, H., Jung, J., Han, S., Hong, S.,
Sohn, H., 2013. Productive high-complexity 3D city
modeling with point clouds collected from terrestrial
LiDAR. Computers, Environment and Urban Systems,
41(5), p.26–38.
Holmgren, J., Persson, Å., 2004. Identifying species of
individual trees using airborne laser scanner. Remote
Sensing of Environment, 90(4), p.415–423. Available
at: http://www.sciencedirect.com/science/article/pii/
S0034425703001408 [Accessed January 2, 2015].
Isenburg, M., Shewchuk, J., 2013. LAStools. Available at:
http://www.cs.unc.edu/~isenburg/lastools/.
Kolbe, T.H., Gröger, G., Plümer, L., 2005. CityGML:
interoperable access to 3D city models. In First
International Symposium in Geo-Information for
Disaster Management. Delft, the Netherlands:
Springer Verlag, p. 883–899.
Nguyen, H., Pearce, J., Harrap, R., Barber, G., 2012. The
application of LiDAR to assessment of rooftop solar
photovoltaic deployment potential in a municipal
district unit. Sensors, 12(4), p.4534–4558.
Oude Elberink, S., Vosselman, G., 2011. Quality analysis
on 3D building models reconstructed from airborne
laser scanning data. ISPRS Journal of
Photogrammetry and Remote Sensing, 66(2), p.157–
165.
Over, M., Schilling, A., Neubauer, S., Zipf, A., 2010.
Generating web-based 3D city models from
OpenStreeMap: the current situation in Germany.
Computers, Environment and Urban Systems, 34(6),
p.496–507.
Penninga, F., van Oosterom, P., Kazar, B., 2006. A
tetrahedronized irregular network based dbms
approach for 3D topographic data modeling. In
Progress in Spatial Data Handling. Heidelberg,
Germany: Springer, p. 581–598.
Pfeifer, N., Mandlburger, G., 2008. LiDAR data filtering
and DTM generation. In Topographic laser ranging
and scanning: principles and processing. Boca Raton,
Fl, USA: CRC Press.
Sithole, G.,Vosselman, G., 2004. Experimental
comparison of filter algorithms for bare-Earth
extraction from airborne laser scanning point clouds.
ISPRS Journal of Photogrammetry and Remote
Sensing, 59(1-2), p.85–101.
Stal, C., Tack, F., De Maeyer, P., De Wulf, A., Goossens,
R., 2013. Airborne photogrammetry and LiDAR for
DSM extraction and 3D change detection over an
urban area: a comparative study. International Journal
of Remote Sensing, 34(4), p.1087–1110.
Stal, C., De Roo, B., De Maeyer, P., Nuttens, T., De Wulf,
A., 2013. Considerations on the fusion of multi-sensor
spatial data for cultural heritage. In 16th AGILE
conference on Geographic Information Science.
Leuven, Belgium, p. 3.
Wei, L., Lefebvre, S., Kwatra, V., Turk, G., 2009. State of
the Art in Example-based Texture Synthesis.
Eurographics 2009, State of the Art Report, EG-STAR,
p.93–117.
GISTAM2015-1stInternationalConferenceonGeographicalInformationSystemsTheory,ApplicationsandManagement
238
