
Data Collection and Management for Stratigraphic Analysis
of Upstanding Structures
Elisabetta Donadio
and Antonia Spanò
Politecnico di Torino – DAD (Architecture and Design Dept), viale Mattioli, 39, 10125 Torino, Italy
{elisabetta.donadio, antonia.spano}@polito.it
Keywords: GIS, Masonries, Stratigraphy, Cultural Heritage, TLS, SfM.
Abstract: Stratigraphic analysis, used in principle for study of archaeological excavation, has been adapted and ap-
plied to upstanding structures with the same aim to reconstruct a building’s history. Stratigraphy, as well as
data excavation management, has found a useful and versatile tool in geographic information systems
(GISs). Such systems allow support of this kind of analysis, which is mainly related to the reconstruction of
the chronological sequence, statistical analysis, and their representation. This paper examines the process
that leads to the production of information and storage in a GIS, applicable for the management of the stra-
tigraphy of an upstanding structure. This process involves data acquisition, processing, 3D modelling, 2D
representation, graphical entities, and their topological relationships, determinations, and representations.
We also touch on the relationship between 3D GIS and 2D GIS; even if complex 3D archives are currently
achievable, from another point of view it can be also useful for carrying out a 2D workflow aiming at
achieving sharable guidelines that are valuable for specialists in Cultural Heritage conservation.
1 INTRODUCTION
The widespread use of information and communica-
tion technology (ICT) has radically improved the
availability of spatial information over the Internet,
and GIS tools have became powerful instruments to
perform complex analyses both on thematic and
geometric content.
Cultural heritage documentation is a field where
GIS applications have ensued general improve-
ments, also arisen from the increasing application of
GIS to urban cartography and the consequential
requirement to handle 3D representation.
In recent years, many proposals and ad hoc solu-
tions for digital documentation systems based on
GIS tools have been aimed at cultural assets (two
example among others: Apollonio et al., (2012) and
Katsianis (2008).
The GIS tools played a relevant role, first in the
archaeological field since they enable management
and analysis of a large amount of data according to
basic assumptions used by archaeologists for collect-
ing and managing site or ancient building infor-
mation. Moreover, archaeological practices pay
close attention to the spatial components of archaeo-
logical data. The reconstruction of past event or site
changes is initiated through reading and storing of
recognisable evidence related to the landscape in
which they are discovered. Effectively, the great
esteem for GIS tools has led to many disciplinary
considerations linked to archaeological science and
experiences (Scollar, 1999; Wheatley and Gillings,
2002).
In the last two decades, the community devoted
to CH protection has shown an interest in new tech-
nologies of data acquisition and management. In this
context, particularly GIS use has taken root.
This phenomenon is not unanticipated, since
some keywords or concepts included in international
conventions concerning the protection of the world
heritage (UNESCO, 1972, and later) are appropriate
for use with GIS tools.
The knowledge of the extent and the state of CH
in a region is related to the ability of managing geo-
graphical locations. The involvement of many spe-
cialists belonging to different fields of studies and
generally of stakeholders
active in CH protection
plans means that many different kinds of data must
be collected, produced, and stored. The ability to
connect diverse databases and to manage the tem-
poral dimensions are remarkable GIS skills. The GIS
tools are also widely used in CH documentation for
technical reasons; orthoimages and Digital Elevation
Models are easily managed and are increasingly
34
Donadio E. and Spanò A..
Data Collection and Management for Stratigraphic Analysis of Upstanding Structures.
DOI: 10.5220/0005470200340039
In Proceedings of the 1st International Conference on Geographical Information Systems Theory, Applications and Management (GISTAM-2015), pages
34-39
ISBN: 978-989-758-099-4
Copyright
c
2015 SCITEPRESS (Science and Technology Publications, Lda.)

used in built heritage applications.
Orthoimages, which are processed from terrestri-
al laser scanning (TLS) and/or from digital photo-
grammetry techniques, represent a particularly fa-
vourable representation for different specialists since
they include both metric and radiometric values.
Moreover, archaeologists or other non-experts in
survey techniques are autonomously able to extract
data from such orthographic building representations.
2 GOALS AND OPEN ISSUES IN
THE WORKFLOW OF DATA
ARRANGING FOR
STRATIGRAPHIC ANALYSIS
There are three main necessary phases for collecting
data for a stratigraphic analysis of an upstanding
structure. In the first phase, we need to choose the
method for data acquisition and process, in order to
obtain 3D models and orthoimages. In the second
phase, we need to make the survey results available
in a spatial data structure and format properly for
GIS management. To do this, we frequently need
data digitisation.
In the third phase, we must organise graphical
datasets and all other information. To make spatial
data available for queries and visualisation in con-
nection with other archaeological, technological, or
historical information, it is necessary to design a
model that identifies a correspondence between
spatial features and conceptual model data. The
issue of this operation is related to the necessity of
matching a structure based on topology with a struc-
ture that conforms to the geometric representation of
the architectural structure. Therefore, the generated
geometric entities must be compliant with topologi-
cal data structures.
This task, representing constructive or restoration
phases of buildings or sites, is usually performed to
fulfil chronological plans and is widely used by the
users community (e.g., Semeraro et al., 2012;
Bortolotti et al., 2013).
In this paper, we favour the first two phases;
therefore, some methods are discussed in the next
paragraphs.
2.1 Terrestrial Laser Scanner (TLS)
and Structure-from-Motion (SfM)
Techniques
Today, it is well accepted that a 3D model of data
derived from a digital survey using both active and
passive sensors is more rapid and provides more
details than using other survey systems. These mod-
els enable obtaining very useful shape documentation
and thematic characterisations that are more sustainable
in terms of cost and the amount of available information.
However, when comparing image-based techniques with
laser scanning, the former have a better chance for low
cost equipment and tools.
Recent digital photogrammetric software uses algo-
rithms derived from the computer vision community;
they take advantage of Structure-from-motion (SfM)
tools that enable estimated 3D positions of points repre-
sented in multiple images. Such systems can provide the
reconstruction of objects’ shapes and points’ positions
(Lowe, 2004).
Many other image-matching techniques have been
developed earlier than SfM, such as area-based matching
and feature-based matching, in order to solve the tie
points (TPs) extraction; after that phase, epipolar geome-
try is used to process internal and external orientation
and to create dense points clouds.
Section profiles or orthophotos are comparable
for metric accuracy (Chiabrando and Spanò, 2013)
and can be extracted to measure buildings, to exam-
ine safety conditions, and for deriving proper infor-
mation for stratigraphic analysis.
2.2 Features Extraction and
Automation in Digitising
Usually, some editing efforts are implemented in 3D
models or orthoimages generation in order to digitise
surveyed objects.
Architectural and archaeological fields usually
derive drawings after the measuring phase, and the
huge amount of information provided by accurate
and highly detailed 3D models make the manual
tracing well accepted.
Some commercial and open source tools offer
solutions to support and simplify this phase. Some
tools enable insertion of section planes cutting a
registered points cloud anywhere in the scene space.
In this way, it is possible to generate a mosaic of
images representing a parallel projection of the
cloud model on which extracts vectors.
Vector extraction, when manually performed, is
very time consuming, and even if this is a relevant
phase in reading assets, many automated or semi-
automated aiding tasks and algorithms can be taken
into account.
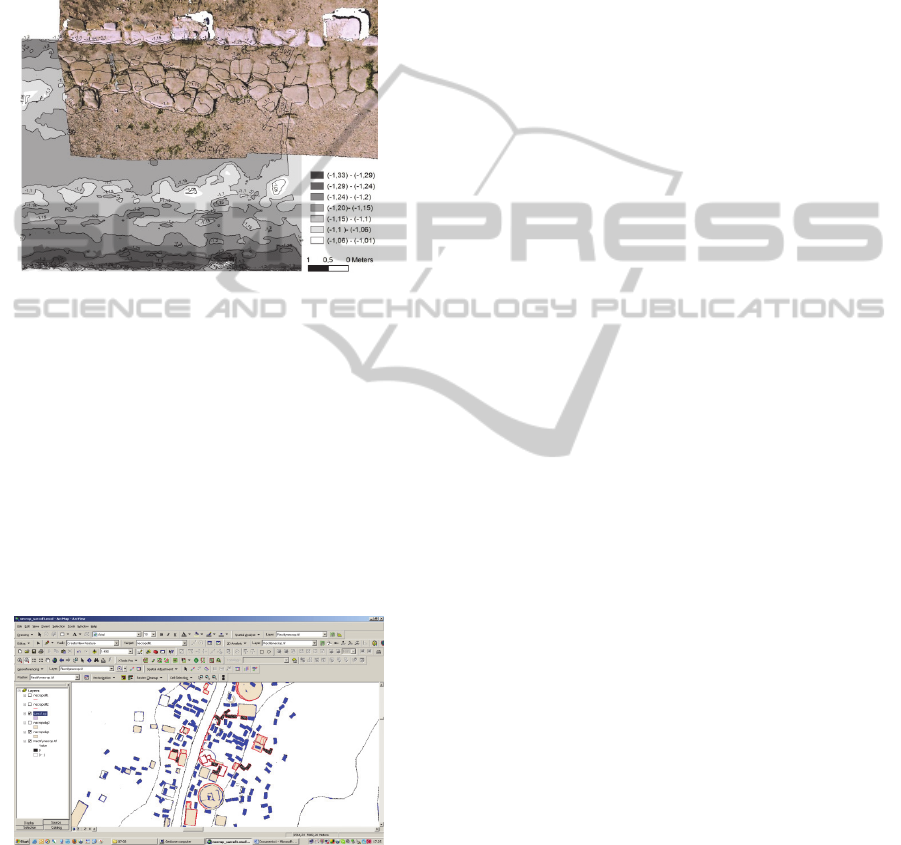
Sometimes a contours extraction tool applied on
the archaeological object surface, usually represent-
ed by a DEM, can be helpful as shown in Figure 1.
The success of this method depends on the re-
DataCollectionandManagementforStratigraphicAnalysisofUpstandingStructures
35
quired scale of analysis and is rarely proper for ma-
sonries analysis.
More often, the algorithms that are able to rec-
ognise the radiometric boundaries can be used to
process the vectorisation, usually by means of geo-
metric constraints, such as extension, shape, or
number of vertices for the recognised objects (Figure
2).
Figure 1: Vector sketches of the shape of evidence are
obtained with the help of a contours extraction task
(Costamagna et al., 2010).
A relevant request of process automation affects
many phases and aspects of CH documentation, and
occasionally some solutions are adapted from inno-
vative applications of other sectors.
The feature extraction and matching techniques
have traditionally been used in aerial photogramme-
try. Many operators, such as SIFT, are widely im-
plemented for automatic TP extraction and approxi-
mate digital surface model (DSM) generation (Lin-
gua et al., 2009).
Figure 2: An example of automatic vectorisation per-
formed by geometric constraints (tombs of Hierapolis
North necropolis (Spanò, 2008).
In order to automatically extract break-lines of a
surveyed object, some solutions foresee a continuous
exchange of information between Lidar and Photo-
grammetric techniques. The result is the complete
3D description of the object through break-lines
(Nex and Rinaudo, 2011).
An interesting tool, based on active contour and
fulfilled specifically for a stone-by-stone digitisation
aimed toward stratigraphical analysis, can be found
in Drap et al., (2007).
3 STRATIGRAPHIC ANALYSIS
REQUESTS: CHRONOLOGY
ISSUES
The use of archaeological methods in the study of
architecture aims to enrich the knowledge base,
since buildings show signs of transformation, resto-
ration, reconstruction, and demolition.
The application of the stratigraphic method to ar-
chaeology hails from Edward Harris’ experiences
dating back to the mid-twentieth century (Harris,
1989). The goal of archaeology is to define construc-
tion phases of the building (chronological sequenc-
es) within a relative chronology and subsequently,
their settings in an absolute chronology introducing
dates or periods.
The dating process starts with identification on a
3D or 2D representation of stratigraphic units (Unità
Stratigrafiche Murarie (USM)) intended as construc-
tive action with temporal autonomy.
There are two different types of stratigraphic
units: positive USM, if they result from a single
constructive action, and negative USM, if they result
from a removal action due to human action. Some
units are then defined as covering units if they cover
other units, such as plasters, paints, wall coverings,
and flooring.
Starting from this recognition, the analysis con-
tinues seeking temporal relationships between adja-
cent units and processing the stratigraphic sequenc-
es, consisting of all USM in temporal order. All of
these data are recorded in a data sheet. Likewise, for
the archaeological excavations, the USM are then
grouped into a construction phase to be able to better
study the history of the building.
The final step of a stratigraphic analysis consists
of the abstraction of the relationships between units
using a matrix diagram, conceived by Harris, which
is a system of representation of the stratigraphic
relationships that represent through a system of
symbols the chronological sequence of all actions,
constructive and destructive.
The stratigraphic method, which provides map-
ping of stratigraphic units on graphic representations
and their cataloguing in a descriptive database, re-
presents an example of a useful implementation of a
GISTAM2015-1stInternationalConferenceonGeographicalInformationSystemsTheory,ApplicationsandManagement
36
GIS. The advantage of this application is to exploit
the topological relationships resulting from vectori-
sation (and georeferencing) of each stratigraphic
unit.
4 CASE STUDY: THE NORTH
FRONT OF THE SANTA MARIA
CHURCH OF THE STAFFARDA
ABBEY
4.1 The Cistercian Staffarda Abbey
The Cistercian Staffarda Abbey is a monastery lo-
cated near Saluzzo in northwest Italy that was
founded in the XII century by Cistercian monks. The
abbey complex grew larger between XII-XIII centu-
ries with a gradual decline from that date onwards
(Rotunno, 2011). In 1750, the Holy See declared the
autonomous abbey’s role to be over, and the com-
plex was given to the Order of St. Maurice.
Due to the modifications over the centuries, the
monastery combines both Roman and Gothic archi-
tectural styles, and it includes the Santa Maria
Church, the cloister, other monastic rooms (the dor-
mitory, the refectory, etc.), the covered market, and
the guestrooms (Beltramo, 2010).
Much of the complex was built in red brick and
red sandstone. The church has a nave and two aisles,
and is a splendid example of Romanesque-Gothic
style.
Figure 3: 3D Model processed from LIDAR data.
The inside is austere, and the cross vault and the
pillars (all different from one another) are decorated
with alternating colours, which range from red to grey.
Externally, the overload of the roof led to the
construction in early medieval sites of the flying
buttresses that have improved but not solved the
problem. Currently, the monastery represents one of
the most important testimonies of medieval architec-
ture in Piedmont.
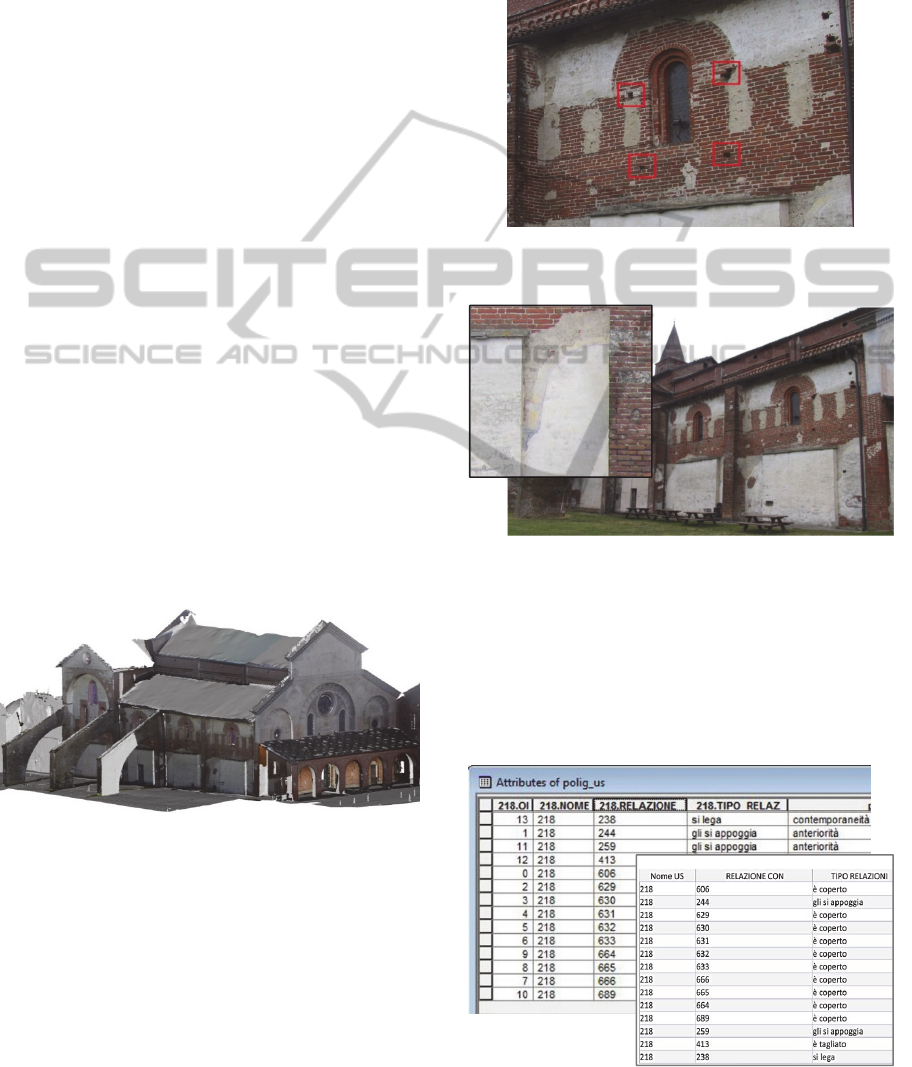
The stratigraphic analysis involved in the north
facade, particularly the three spans and the transept,
are characterised by many visible stratifications. For
example, the signs of demolition and filling of the
eighteenth-century chapels and some of their decora-
tions are still evident as well as the holes of their
coverage.
Figure 4: Holes on the masonries determined by a recent
restoration.
Figure 5: Zoom-in on an example of a chapel decoration.
4.2 The Stratigraphic Analysis
The analysis has been carried out recognising and
contouring units on orthoimages generated from the
3D point laser cloud. This phase led to the recogni-
tion of 74 positive USM, 22 negative USM, and 115
covering units.
Figure 6: Attribute data tables implemented in GIS.
DataCollectionandManagementforStratigraphicAnalysisofUpstandingStructures
37
The next step consisted of the identification of
the temporal relationship between each unit and its
adjacent units. In order to archive and link this kind
of descriptive information, an attribute database has
been created.
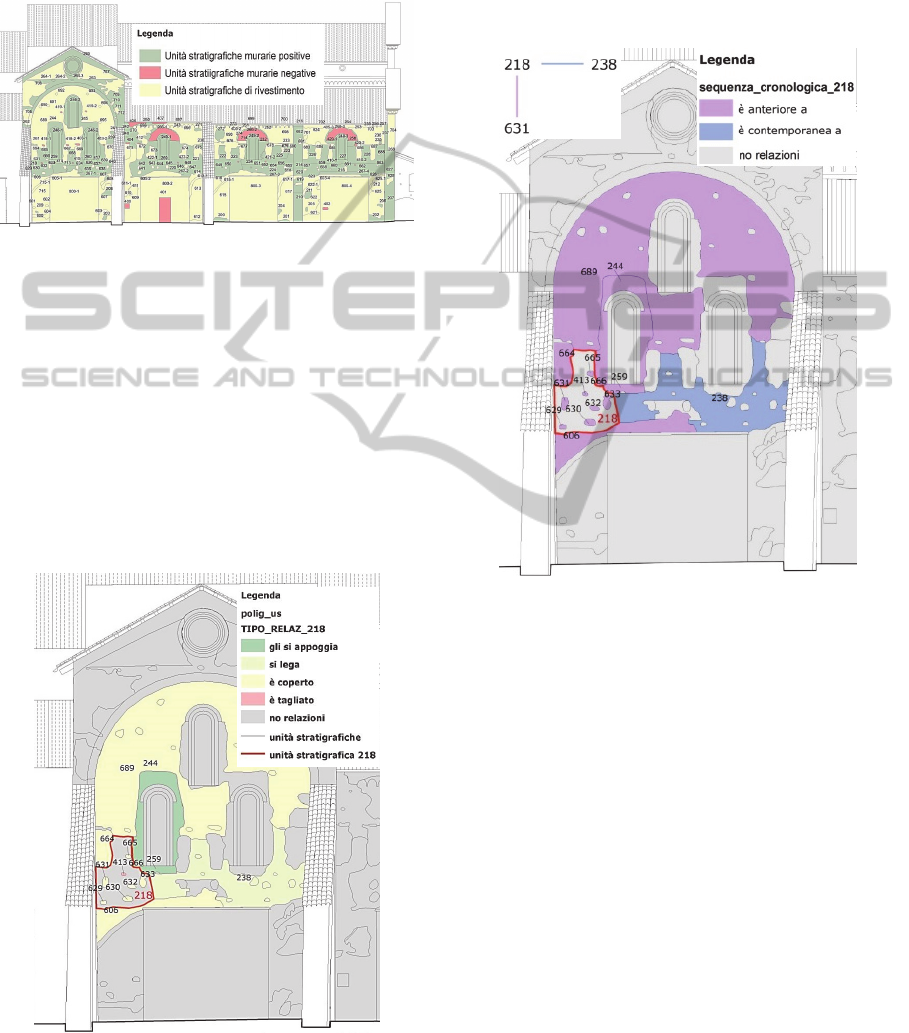
Figure 7: Example of a data thematisation: in green posi-
tive USM, in red negative USM, in yellow covering units.
In 2D or 2.5 representation GIS projects, the co-
ordinate system cannot be the original system of the
laser model that coincides with the topographical
reference system. Necessarily, the graphical vector
dataset representing the front façade is projected
onto a vertical plane measured by xy coordinates.
The original coordinate system must be shifted and
turned for each face of the building that is analysed
and represented; corresponding features in different
drawing projections that represent the same real
elements can be connected by a relationship.
Figure 8: Result of a select by attribute query about the
218 USM. The system allows highlighting all the USM
that have a relationship with it and to thematise features
based on the type of relationships they have.
The implementation of features representing
USMs and the related chronological relationships
allow generation of several useful thematisations.
It also allows querying the data by location or at-
tributes, depending whether it is proper to take ad-
vantage of topological relationships or when it is
better to use attribute data.
Figure 9: Harris matrix processed using GIS attribute
selection.
5 CONCLUSIONS AND
PERSPECTIVES
Despite the fact that this sketchy experience is based
on 2D representation GIS, it shows two evident
positive points. The first is that a powerful analysis
for a CH conservation plan is achievable through
well-known functionalities among GIS users. Later,
but even more relevant, the use of many graphical
frameworks, each representing a drawing projection
of the building (plan, fronts, and cross sections),
offer the chance to manage the entire complex of the
building. Architects and archaeologists are used to
using different 2D representations in studies of 3D
spaces or objects. Further, by means of exploiting
the capability to connect different features represent-
ing the same real elements, they can enhance their
analyses.
In addition to the easy to use tools, another profitable
GISTAM2015-1stInternationalConferenceonGeographicalInformationSystemsTheory,ApplicationsandManagement
38

issue for the CH documentation community is the low
cost systems. The increasingly common use of open
source tools, such as PostGis, is placed side-by-side to
commercial tools, such as the popular ESRI products
even among the CH preservation plans.
The development of 3D GIS (i.e., systems where
the same importance to the (x,y,z) coordinates is
assigned) is attractive in the CH conservation com-
munity. The 3D management, both in data visualisa-
tion operations and in data retrieving or editing
operations, offers the achievement of specialised
analyses.
In some cases, open source framework and ad-
vanced ad hoc systems for some relevant contexts
are used (e.g., Coralini et al., 2010)
A very interesting specialised system has been
developed for the Shawbak project. A 3D GIS al-
lows management of both photogrammetric models
and 3D shape restitution of built structures in spatial
archive as well as processing and automatic visuali-
sation of the Harris matrix with clusterisation of
geometric elements (Drap et al., 2012)
A section of the scientific community, which has
been working on information systems for CH preserva-
tion, started to investigate the benefits of switching from
a 3D content model to historic building information
modelling (HBIM) to support conservation plans (Oreni
et al., 2013). Furthermore, studies comparing the ad-
vantages and disadvantages of both BIM and GIS ap-
proaches are available (Saygi et al., 2013).
In both cases, BIM or GIS adoption, there is the
need to enhance the automatic digitisation tools
starting from orthoimages and points models, since
only more sustainable and easily approachable pro-
cedures can represent an effective strategy for basic
and common use in CH conservation plans.
REFERENCES
Harris E. C., 1989. Principles of Archaeological Stratig-
raphy. Academic Press; 2
nd
edition (Jun 15, 1989).
Scollar I., 1999. 25 years of Computer Applications in
Archaeology, in L. Dingwall, S. Exon, V. Gaffney, S.
Laflin, M. van Leusen (Eds.), Archaeology in the Age
of the Internet, Computer Applications and Quantita-
tive Methods in Archaeology 1997, BAR International
Series 750, Oxford, 5-10.
Wheatley D., Gillings M., 2002. Spatial technology and
archaeology: the archaeological applications of GIS,
Taylor and Francis, London.
Lowe D., 2004. Distinctive Image Features from Scale-
Invariant Keypoints. IJCV, vol. 60, number 2, pp.
91—110.
Drap P., Durand A., Nedir M., Seinturier J., Papini O., et
al., 2007. Photogrammetry and archaeological
knowledge: toward a 3D information system dedicated
to medieval archaeology: a case study of Shawbak
Castle in Jordan. In Proceedings of the 3
rd
ISPRS, In-
ternational Workshop 3D ARCH, pp.1-8.
Katsianis M., Tsipidis S., Kotsakis K., Kousoulakou A.,
2008. A 3D digital workflow for archaeological intra-
site research using GIS, Journal of Archaeological
Science 35 pp. 655-667.
Lingua A., Marenchino D., Nex F., 2009. Performance
Analysis of the SIFT Operator for Automatic Feature
Extraction and Matching in Photogrammetric Applica-
tions, Sensors, 9, 3745-3766; doi:10.3390/s90503745
Beltramo S., 2010. L’abbazia cistercense di Santa Maria
di Staffarda, l’Artistica editrice, Cuneo.
Coralini A., Guidazzoli A., Scagliarini Corlàita D.,
Toffalori E., 2010. VISMAN-DHER Project: Integrat-
ed Fruition of Archaeological Data through a Scien-
tific Virtual Model, In Euromed 2010, pp. 409-421.
Costamagna E., Chiabrando F., Rinaudo F., Spano' A.,
2010. Very close nadiral images: a proposal for quick
digging survey. In: ISPRS Archive, vol. XXXVIII/5,
pp. 155-160. - ISSN 1682-1750.
Nex F., Rinaudo F., 2011. LiDAR or Photogrammetry?
Integration is the answer. In: Rivista Italiana di
Telerilevamento, vol. 43 n. 2, pp. 107-121.
Apollonio F., Gaiani M., Benedetti B., 2012. 3D reality-
based artefact models for the management of archaeo-
logical sites using 3D GIS: a framework starting from
the case study of the Pompeii Archaeological area,
Journal of Archaeological Science 39, pp. 1271-1287.
Drap P., Merad D., Seinturier J., Boï J. M., Peloso D.,
Vannini G., Nucciotti M., Pruno E., 2012. An Infor-
mation System for Medieval Archaeology Based on
Photogrammetry and Archaeological Database: The
Shawbak Castle Project, In Euromed 2012.
Semeraro G., Pecere B., Mianulli A., 2012. Applicazioni
GIS alla ricerca archeologica: Il santuario di Tas Silg a
Malta, In SCIentific RESearch and Information
Technology, Vol. 2, Issue 1 (2012), pp. 83-104, e-
ISSN 2239-4303, DOI 10.2423/i22394303v2n1p83
Bortolotto S., Castiglioni A., Cattaneo N., Massa S., 2013.
Complex Archaeological Sites: An integrated strati-
graphic framework for progressive knowledge acquisi-
tion and representation. In Built Heritage 2013 Moni-
toring Conservation Management, pp. 719-728.
Chiabrando F., Spanò A., 2013. Points clouds generation
using TLS and dense-matching techniques. A test on
approachable accuracies of different tools. In: ISPRS
Annals, Volume II-5/W1. pp. 67-72.
Oreni D., Burmana R., Georgopoulos A., Cuca B., 2013.
HBIM for conservation and management of built Her-
itage: towards a library of vaults and wooden bean
floors, In ISPRS Annals of the Photogrammetry, Re-
mote Sensing and Spatial Information Sciences, Vol-
ume II-5/W1, 2013.
Saygi G., Agiugiaro G., Hamamcıoğlu-Turan M.,
Remondino F., 2013. Evaluation of GIS and BIM roles
for the information management of Historical Build-
ings, In ISPRS Annals Volume II-5/W1.
DataCollectionandManagementforStratigraphicAnalysisofUpstandingStructures
39
