
Insights for Manage Geospatial Big Data in Ecosystem Monitoring
using Processing Chains and High Performance Computing
Fabián Santos
1
and Gunther Menz
2
1
Center for Remote Sensing of Land Surfaces, University of Bonn, Walter Flex Straße 3, Bonn, Germany
2
Remote Sensing Research Group, Department of Geography, University of Bonn,
Meckenheimer Allee 166, 53115 Bonn, Germany
1 RESEARCH PROBLEM
Big data (BD) is nowadays a research frontier and a
strategic technology trend, which is still emerging as
a new scientific paradigm in many fields (Chen and
Zang, 2014). It is commonly conceptualized by the
3V´s model of (Laney, 2009), who defines three
dimensions in BD known as: volume (data size),
variety (data types) and velocity (production rate);
that could be challenging to analyze, especially in
large quantities. For these reasons, processing and
analysis of BD requires new approaches, which are
not suitable for conventional software and hardware.
According to (Percival, 2009) Geospatial data
(GD) has always been BD but not as it is today, due
the accelerated increase and accessibility of
geographical technologies (as for example: state-of-
art earth observation satellites, mobile devices,
ocean-exploring robots, unmanned aerial vehicles,
etc.). Moreover, the distribution policies in favor of
free and open access to archives are giving way to
automated mass processing of large collections of
Geospatial data (Hansen and Loveland, 2012).
Thereby, this type of data can be considered (under
certain conditions), as a synonym of BD which
requires not only powerful processors, software,
algorithms and skilled data researchers (European
Commission, 2014) but also a set of conditions that
are not fully met to make possible and accessible the
data-intensive scientific discovery.
For these reasons, this research aims to explore
the link between Geospatial data and BD, especially
in the design and programming of processing chains,
which usually do not show explicit considerations to
manage the BD dimensions, moreover applied to
ecosystem monitoring research.
2 OUTLINE OF OBJECTIVES
Due that the BD and Geospatial data involves many
combinations; only two cases will be analyzed on
this research. The first case involves the analysis of a
large set of satellite images, so the volume
dimension of BD will be the main challenge. The
second case implies a unique large database of
different Geospatial data sources and types, thus the
variety dimension of BD will be the main problem.
For these reasons, this research is divided in two
empirical objectives and one theoretical, whose
purposes will be the following:
Analyze the restoration process of disturbed
tropical forests in Ecuador. For this reason, a
processing chain for prepare a large collection of
Landsat images and a time series analysis will be
developed, applying the high performance
computing approach.
Identify the environmental drivers that influence
the restoration process of disturbed tropical
forests in Ecuador. To this purpose, an
exploratory statistical analysis and pattern
extraction from a database composed by different
sources and types of Geospatial data will be
review. This will require the development of
another processing chain using the high
performance computing approach for harmonize
and extract the patterns inside the data.
Describe the linkages of BD in Geospatial data
and the benefits of the high performance
computing approach in processing chains. Due
this reason, the processing chains already
developed will be debugged and optimized in
order to guarantee their reproducibility and
distribution as open source software. Moreover, a
detailed description of their design and
processing efficiency will allow the conclusion
of the technical aspects of this objective.
3 STATE OF THE ART
In the early seventies, the term “information
3
Santos F. and Menz G..
Insights for Manage Geospatial Big Data in Ecosystem Monitoring using Processing Chains and High Performance Computing.
Copyright
c
2015 SCITEPRESS (Science and Technology Publications, Lda.)

overload” was mention by (Toffler, 1970) to explain
the difficulties associated with decision making due
the presence of excessive information. After that, a
concern for the management and interpretation of
large volumes of data became more relevant;
however, without a proper solution.
When computer systems were developed enough
for recognize or predict patterns on data (Denning,
1990), the scientific community was able to describe
with more details the properties of the BD. The first
known scientists who conceptualized the term were
(Cox and Ellsworth, 1997) and they described it as
the large data sets which exceed the capacities of
main memory, local disk, and even remote disk.
Consequently, the term was mainly associated with
the size or volume of the data but (Laney, 2001)
proposed two additional properties for describe BD
calling them: variety, for refer to the diversity of
data types and; velocity, for indicate the production
rate of data. This concept approach is called the
three V´s of BD and nowadays inspires most of the
BD management strategies. However, other authors
as (Assunção et al., 2013) suggest additional V´s
properties and considerations for BD management
calling them: veracity, value, visualization and
vulnerability.
Regarding to Geospatial data as BD, its use
constitutes a research frontier which is making
conventional processing and spatial data analysis
methods no longer viable. The increasingly data
collection and complexity of sensors aboard the
earth observation satellites and other technology
devices based in Geospatial data production is
nowadays demanding new platforms for processing,
which are now accessible through cloud computing
services (Sultan, 2010). However, the scientific
literature related to this field is not so numerous than
the research done over individual or small
collections of satellite images using conventional
computing methods. A decline on this tendency over
time is concluded by (Hansen et al., 2012), who
affirms that methods in the future will evolve and
adapt to greater data volumes and processing
capabilities; and (Gray, 2009) who anticipated a
revolution of scientific exploration based on data-
intensive and high-performance computing
resources.
The release by NASA and the USGS of a new
Landsat Data Distribution Policy (National
Geospatial Advisory Committee, 2012) which
enables the free download of the whole available
data collection constitutes an example of a data-
intensive source which demands new approaches for
extract meaningful information. In this sense,
(Potapov et al., 2012) demonstrated the feasibility to
work with large Landsat collections developing a
methodology which enable the quantification of
forest cover loss through the analysis of a set of
8,881 images and a decision tree change detection
model. Moreover, (Flood et al., 2013) proposed an
operational scheme for process a standardized
surface reflectance product for 45,000 Landsat
TM/ETM+ and 2,500 SPOT HRG scenes,
developing an innovative procedure for correct the
atmosphere, bidirectional reflectance and
topographic variability between scenes. However, in
both cases, is unknown the computing strategies
adopted for manage and process such large
collection of images.
Nonetheless, other authors describe with detail
the use of High Performance Computing and
Geospatial data. For instance, (Wang et al., 2011)
develop a prototype of a scientific Cloud computing
project applied in remote sensing, which describes
the requirements and organization of the resources
needed; (Almeer, 2012; Beyene, 2011) investigated
the MapReduce programming paradigm for process
large collection of images; and (Christophe et al.,
2010) describes some benefits of Graphical
processing units (GPU) respect to Multicore Central
Processing Units (CPU) on the processing time of
different algorithms types, commonly used in remote
sensing.
From all the references consulted, these two
approaches were mainly found, in other words,
separating the design of the remote sensing
processing chains from the BD management
strategies. For this reason, this research aims to
couple them on two specific cases of large
Geospatial data collections applied on Ecosystem
monitoring, which involve the design of processing
chains and BD management strategies.
4 METHODOLOGY
As is mention in the section 2, the empirical research
will be applied in two cases, therefore each research
objective has their own specific data sources,
analysis methods, validation procedures and study
areas (except for the third one which is mainly
theoretical). The materials and methods are
summarized in the next paragraphs (subsections 4.1
to 4.4):
Data sources: multispectral and radar remote
sensing products, aerial photography, ancillary
cartography, climatic databases, GPS inventories,
field recognition and surveys.
CLOSER2015-DoctoralConsortium
4

Data analysis: literature research, parallel
computing paradigm, image processing, machine
learning, time series analysis and exploratory
statistics
Validation procedures: multi-scale accuracy
assessment
Study areas: selected sites of different tropical
forest in Ecuador
The study areas considered for this research
represent sites which the available Geospatial data
achieves the minimum information requirements,
furthermore with a good register of field data and
fidelity needed for the validation procedures.
Finally, on this review only the first objective
materials and methods are described in detail due the
advances achieved until now.
4.1 Geospatial Data
For categorize the Geospatial data of the first
objective, two types are listed with their respective
sources:
Primary sources (all in raster format):
1) A set of Landsat 4, 5, 7 and 8 images (±350
data sets collected) acquired for the
multispectral sensors TM, ETM+ and OLI-
TIRS (all with 7 spectral bands in the optical,
infrared and thermal regions) over 3 scenes
(each scene covers 33,300 km2); processed
until the level L1T (which means a geometric
correction but not a radiometric correction).
This information covers a period of ± 30
years with time intervals of 0.5 to 2 years;
and with a spatial resolution of 30 meters.
2) A set of digital elevation models obtained
from the Shuttle Radar Topography Mission
for the respective Landsat scenes, with a
correction of the data voids (however with a
fair quality). The spatial resolution of this
data is 30 meters
3) A set of very high resolution images from the
RapidEye satellites (5 meters of spatial
resolution with a geometric correction) and
from historical archives of aerial photography
(this information is under request).
Secondary sources (raster and vector format):
4) Ancillary cartography, which describes the
ecosystems and the different forest types in
Ecuador; and other layers for describe the
human and biophysical features of landscapes
(roads, rivers, administrative boundaries,
cities, soil types, climates, etc.)
5) Climate databases from the WorldClim and
metereological stations.
6) GPS inventories of plant species and forest
carbon stock measures on the field.
4.1.1 Open Issues
Due that the processing capabilities are restricted to
a multicore computer; the raster data used for the
analysis is reduced to a set of small study areas
inside the image scenes. However, our interest is
extend the processing capabilities using a cloud
computing service for modify and upgrade the
processing chain developed with the complete area
of the images.
4.2 High Performance Computing
According to (Christophe et al., 2011) high
performance computing is a natural solution to
provide the computational power, which have
several approaches like cluster, grid or cloud
computing. Moreover, this approach not only refers
to a connected groups of computers locally or
geographically distributed; it refers as well to the
parallel computing paradigm which is the
simultaneous assign of tasks when is possible to
divide a big processing problem into smaller ones.
This can be done through the central processing
units (CPU) or the graphical processing units (GPU)
which nowadays computers have as hardware
resources.
The design of the processing chain for the
Landsat images applies the parallel processing
paradigm through the use of the cores in a multicore
computer and the division of the collection of
images acquired. For this purpose, an automatic
detection of the cores in the computer makes
possible to obtain the factor needed for subdivide the
complete list of images. This is done in the R
language through the package “foreach” (Weston,
2015) which allows the management of the cores in
a loop programming structure. The next R script
shows this design:
#list the data repository in the
variable “load.data” which is the
set of images
load.data <- list.files(load.data,
full.names= T)
#detect the number of cores
available in the computer
ncores <- detectCores(all.tests =
TRUE, logical = TRUE)
InsightsforManageGeospatialBigDatainEcosystemMonitoringusingProcessingChainsandHighPerformance
Computing
5

#subdivide the “load.data” list in
groups according to the cores
load.data <-
split(load.data,as.numeric(gl(length
(load.data),ncores,length(load.data)
)))
#for each element “j” in the
“load.data” subdivided list, take
only a set (which #represent a set
of 4 image directories when a
computer have 4 processing cores)
for (j in 1:length(load.data)){
data.set <- load.data[[j]]
#register cores for apply in
parallel
clusters <-makeCluster(ncores)
registerDoParallel(clusters)
#apply the parallel loop for
each element “i” inside the
variable #“data.set”. Due that
each core need to load an
environment, the command
# “package=raster” specify that
is needed this package to
execute the script
foreach(i=1:length(data.set),.packag
es="raster") %dopar% {
#here comes the script which
indicates the different
operations that should #be done
to each image folder, which is
indexed by the “i” element
inside #the variable “data.set”
…
#for close the parallel loop for
the “i” element
}
#for stop the cores and prepare
them for the next element of the
loop
stopCluster(cl)
#finally, for close the loop of the
subdivided list “load.data” another
curly #brackets is needed
}
This structure allowed the distribution and
application of complex algorithms over set of
images, instead individual images, decreasing the
processing time and according to (Zecena et al.,
2012) a more efficient energy consumption and
algorithm processing.
4.2.1 Open Issues
This approach leads to a further experimentation in a
cluster, grid or cloud computing environment as is
mentioned before, however is needed a feedback for
validate the data distribution between the cores when
they are parallelized, as well the management of
cores in a cloud computing service.
4.3 Image Processing
The image processing approach of this research
follows five modules, each one composed of
different sets of processing tasks which accomplish
specific objectives. This is showed in the figure 1,
which is a flowchart that summarizes the steps of the
processing chain developed, however not yet
finished.
The design of this approach is inspired by the
work of (Flood et al., 2013; Hansen et al., 2007;
Potapov et al., 2012) who developed processing
chains for large collections of Landsat images and;
agreed in almost all cases with the order of the next
required steps: 1) georectification/resampling; 2)
conversion to the top of atmosphere (TOA)
reflectance/atmospheric correction; 3)
cloud/shadow/water masking; 4) standardization of
the reflectance; 5) topographic and bi-directional
reflectance normalization; 6) radiometric validation;
7) index generation/image classification/change
detection/time series analysis; and 8) accuracy
assessment.
4.3.1 Open Issues
Some steps of the processing chain are missing due:
a fail in the processing algorithms used or an
absence of the algorithm in the R language packages
repository. This involves new challenges and in
some cases a change in the language used (as for
example the coregister script which had to be
programmed in Python). Due that our aim is produce
and distributes a pure R application for process large
collections of Landsat images, this can interrupt the
sequence of steps involved. Therefore, new
algorithms, libraries, software and package
alternatives are being searched, but with the only
requirement that they should be open source.
Respect to the accuracy assessment, the results of
the classifications of the images, will allow the
measurement of the precision through the use of
very high resolution satellite images and aerial
photography. This approach called multi-scale
accuracy has been proven for validate MODIS
CLOSER2015-DoctoralConsortium
6
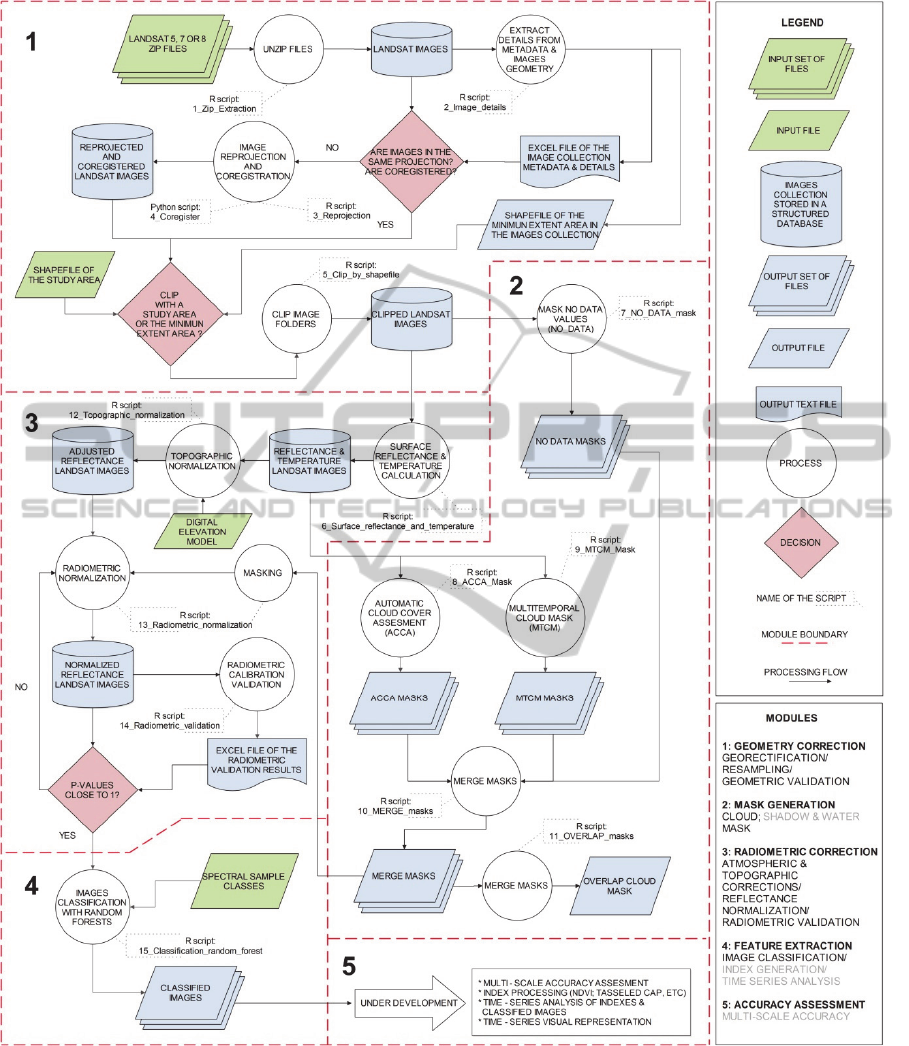
Figure 1: Flowchart of the processing chain under development for large collection of Landsat images.
(Morisette et al., 2012) and Landsat products
(Goward et al., 2003); however with long time series
a further literature research is needed for adopt a
robust method.
4.4 Tropical Forests in Ecuador
Ecuador, despite its small size (only 283,560 km2),
is one of the most diverse countries in the world
(Sierra et al., 2002) and is counted 91 terrestrial
ecosystems in its continental extension and 9 forest
InsightsforManageGeospatialBigDatainEcosystemMonitoringusingProcessingChainsandHighPerformance
Computing
7

types (MAE, 2013). However, with a deforestation
rate of 0.68 – 1.7 % annual, which equals to
61,764.50 hectares per year (MAE, 2012) put it on
the list of the countries with highest deforestation
rate in the world (Tryse, 2008). Due of this, is
needed better ecosystem monitoring methodologies,
which can manage the lack of high quality remote
sensing data and corresponding ground data sets
(Avitabile et al. 2012).
4.4.1 Open Issues
Respect to the study areas of tropical forest in
Ecuador, three study areas along an altitude gradient
in the Amazon region are being considered for the
first objective; principally for their accessibility and
data availability. Moreover, due that they are
integrated in a watershed; their results can be useful
for the second objective.
5 EXPECTED OUTCOME
At the end of the first part of this research, our
expectations are: 1) generate a first version of a open
source processing chain designed to prepare time
series analysis with large collections of Landsat
images; 2) evaluate the regeneration time of different
forest types in Ecuador; 3) contribute with some
ideas about the links between Geospatial data and
BD; and 4) demonstrate some benefits of the high
performance computing approach in remote sensing
and processing chains.
6 STAGE OF THE RESEARCH
This research started one year ago and its proposal
was accepted six months ago. Since then, the
processing chain has been under active development
and in six additional months will be totally finished.
In the other hand, the redaction of the scientific
paper about this chapter started time before and will
be ready, as well too, in six months. After that
period, a field work of six months in Ecuador will be
done for collect the necessary information of the
second research objective and corroborate the results
of the first research objective.
REFERENCES
Almeer, M. 2012. Cloud Hadoop Map Reduce For Remote
Sensing Image Analysis. Journal of Emerging Trends
in Computing and Information Sciences 3 (4).
Assunção, M., R. Calheiros, S. Bianchi, M. Netto, and R.
Buyya. 2014. Big Data Computing and Clouds: Trends
and Future Directions. Journal of Parallel and Dis-
tributed Computing.
Avitabile, V., A. Baccini, M. Friedl, and C. Schmullius.
2012. Capabilities and limitations of Landsat and land
cover data for aboveground woody biomass estimation
of Uganda. Remote Sensing of Environment 117:366-
380.
Beyene, E. 2011. Distributed Processing Of Large Remote
Sensing Images Using MapReduce A case of Edge De-
tection, Institute for Geoinformatics, Universität Mün-
ster, Münster - North-Rhine Westphalia - Germany.
Buckner, J., and M. Seligman. 2015. Package ‘gputools’:
R-Project.
Chen, P., and C.-Y. Zhang. 2014. Data-intensive applica-
tions, challenges, techniques and technologies: A sur-
vey on Big Data. Information Sciences 275 (2014)
314–347.
Christophe, E., J. Michel, and J. Inglada. 2010. Remote
Sensing Processing: From Multicore to GPU. IEEE
Journal of Selected Topics in Applied Earth Observa-
tions and Remote Sensing 1.
Cox, M., and D. Ellsworth. 1997. Application-Controlled
Demand Paging for Out-of-Core Visualization. Paper
read at The 8th IEEE Visualization '97 Conference.
Denning, P. 1990. Saving All the Bits: Research Institute
for Advanced Computer Science, 15.
European Commission. 2014. Communication from the
Commission to the European Parliament, The Council,
The European Economic and Social Committee and
The Committee of the Regions. Brussels 2.7.2014.
Flood, N., T. Danaher, T. Gill, and S. Gillingham. 2013.
An Operational Scheme for Deriving Standardised
Surface Reflectance from Landsat TM/ETM+ and
SPOT HRG Imagery for Eastern Australia. Remote
Sensing 5:83-109.
Goward, S., P. Davis, D. Fleming, L. Miller, and J.
Townshend. 2003. Empirical comparison of Landsat 7
and IKONOS multispectral measurements for selected
Earth Observation System (EOS) validation sites. Re-
mote Sensing of Environment 88 (2003) (80 – 99).
Gray, J. 2009. Jim Gray on eScience: A Transformed
Scientific Method. In The Fourth Paradigm Data In-
tensive Scientific Discovery. Washington - EEUU: Mi-
crosoft Research, xxii.
Hansen, M., and T. Loveland. 2012. A review of large area
monitoring of land cover change using Landsat data.
Remote Sensing of Environment 122 (2012) 66–74.
Hansen, M., D. Roy, E. Lindquist, B. Adusei, C. Justice,
and A. Altstatt. 2007. A method for integrating
MODIS and Landsat data for systematic monitoring of
forest cover and change in the Congo Basin. Remote
Sensing of Environment (2008) 112 2495–2513.
Laney, D. 2001. 3D Data Management: ControLling Data
Volume, Velocity, and Variety. Application Delivery
Strategies META Group Inc.
MAE. 2012. Línea Base de Deforestación del Ecuador
CLOSER2015-DoctoralConsortium
8

Continental edited by Subsecretaría de Patrimonio Na-
tural. Quito - Ecuador: Ministerio del Ambiente
(MAE).
MAE. 2013. Metodología para la representación Cartográ-
fica de los Ecosistemas del Ecuador Continental, edi-
ted by Subsecretaría de Patrimonio Natural. Quito -
Ecuador: Ministerio del Ambiente del Ecuador (MAE).
Morisette, J., J. Privette, and C. Justice. 2002. A frame-
work for the validation of MODIS Land products. Re-
mote Sensing of Environment (2002) 83:77 – 96.
National Geospatial Advisory Committee. 2012. Statement
on Landsat Data Use and Charges.
Percivall, G. 2013. Big Processing of Geospatial Data:
Open Geospatial Consortium.
Potapov, P., S. Turubanova, M. Hansen, B. Adusei, M.
Broich, A. Altstatt, L. Mane, and C. O. Justice. 2012.
Quantifying forest cover loss in Democratic Republic
of the Congo, 2000–2010, with Landsat ETM+ data.
Remote Sensing of Environment 122 (2012) (106–116).
Sierra, R., F. Campos, and J. Chamberlin. 2002. Assesing
biodiversity conservation priorities: ecoszstem risk and
representativeness in continental Ecuador. Landscape
and Urban Planning 59 (2002):95-110.
Sultan, N. 2009. Cloud computing for education: A new
dawn? International Journal of Information Manage-
ment 30 (2010) 109–116.
Toffler, A. 1970. Future Shock. United States: Random
House.
Tryse, D. 2008. David' s Google Earth files:Disappearing
Forests of the World: Google Earth.
Wang, L., M. Kunze, J. Tao, and G. v. Laszewski. 2011.
Towards building a cloud for scientific applications.
Advances in Engineering Software 42 (2011):714–722.
Weston, S. 2015. Package ‘foreach’: Revolution Analytics
R-Project.
Wyborn, L. 2013. It’s not just about big data for the Earth
and Environmental Sciences: it’s now about High Per-
formance Data (HPD) In Big Data: Geoscience Aus-
tralia.
Zecena, I., Z. Zong, R. Ge, T. Jin, Z. Chen, and M. Qiu.
2012. Energy Consumption Analysis of Parallel Sort-
ing Algorithms Running on Multicore Systems. Paper
read at Green Computing Conference (IGCC), at San
Jose, CA.
InsightsforManageGeospatialBigDatainEcosystemMonitoringusingProcessingChainsandHighPerformance
Computing
9
