
Term-frequency Inverse Document Frequency for the Assessment of
Similarity in Central and State Climate Change Programs: An
Example for Mexico
Iván Paz-Ortiz
1
, Diego García-Olano
2
and Carlos Gay-García
3
1
Soft Computing Research Group, Laboratory for Relational Algorithmic Complexity and Learning, Barcelona Tech,
C. Jordi Girona, 31 08034 Barcelona, Spain
2
Laboratory for Relational Algorithmic Complexity and Learning, Data Management Group, Barcelona Tech,
C. Jordi Girona, 31 08034 Barcelona, Spain
3
Programa de Investigación en Cambio Climático, Universidad Nacional Autónoma de México, Edificio de Programas
Universitarios, Circuito de la Investigación Científica s/n, Ciudad de México, Mexico
Keywords: Text Mining, tf-idf, Policy Assessment, Climate Change.
Abstract: In the present work we present a preliminary approach intended for the assessment of the development of the
climate change programs. Particularly we are interested in policies that are develop top-to-bottom by
following specific central guidelines. To this end, the numerical statistic “term frequency-inverse document
frequency” is used to compare the similarity between the action plans on climate change at national and state
level in the case of Mexico. The results allow us to construct a similarity matrix to extract information about
how these plans capture local level characteristics and their degree of attachment to the central policy.
1 INTRODUCTION
The design and monitoring of public policies has
shown to be more effective when schemes of
development-implementation-evaluation are used. As
an example see the ideas expressed in (Edenhofer et
al., 2015). These design approach require the
development of tools for policy assessment that can
be flexible, multipurpose, and updatable in real time.
In addition, a large part of the information used in
policy design, evaluation and implementation is
published and stored in the form of text documents.
In fact, generally speaking, it is estimated that 80% of
the stored information is in text format (see reference
“
Unstructured Data and the 80 Percent Rule”). In recent
years the construction of text databases for different
proposes has increased. At the same time, new tools
for the extraction of useful and meaningful
information have been also developed (Rajaraman
and Ullman, 2011). These tools allow for the
extraction of different levels of information. For
example low-level information, if we are interested in
locate a specific paragraph (having particular
sentences) in different documents within a database
and compare it with each other. We can also look for
high-level information. In that case, we would extract
the semantic content of the texts. For example, find
all the reported conflicts related to water contained in
the database. In general, low-level information is the
information that depends on the format itself, and that
do not explicitly depend on any other object, for
example a particular word in a text. On the other hand,
high-level information is information that is derived
from low level content, for example, the analysis of
sentences that could indicate the presence of
conflicts.
The analysis of document data bases is performed
by text-mining techniques. This term denotes the
process of deriving high-quality information from the
analysis of the text. This information is extracted
through the search and identification of patterns and
trends. This processes are performed by using tools
like statistical pattern learning, similarity measures,
and sparse distributed representations. Text-mining
techniques are an ideal tool for the analysis of the
information contained in text data bases, from the
perspective of evaluation and public policy
implementation. These have been recently used in the
context of environmental sciences for the analysis of
effects of climate change (Shanmuganathan, 2013), to
extract qualitative variables and their relationships
from documents for climate change modeling
purposes (Marsi et al., 2011), to analyze opinion
542
Paz-Ortiz I., García-Olano D. and Gay-García C..
Term-frequency Inverse Document Frequency for the Assessment of Similarity in Central and State Climate Change Programs: An Example for Mexico.
DOI: 10.5220/0005578005420546
In Proceedings of the 5th International Conference on Simulation and Modeling Methodologies, Technologies and Applications (MSCCES-2015), pages
542-546
ISBN: 978-989-758-120-5
Copyright
c
2015 SCITEPRESS (Science and Technology Publications, Lda.)

about climate change in social networks (Xiaoran et
al., 2014), as well as for conservation planning (Pino-
Díaz et al., 2014). In this work we present a
preliminary approach intended for the assessment and
analysis of the developed climate change programs in
Mexico. We considered the documents that give the
general guidelines as well as the documents that were
derived from them. We wanted to infer, for each
document, their degree of attachment to the central
policy by comparing the documents by means of text
mining techniques. In other words, the idea is to
analyze the different levels of implementation
(national and state level) as well as to assess up to
what point the developed programs are close to the
national documents, and if clusters showing regions
of Mexico can be found. For this purpose, the
numerical indicator “term frequency-inverse
document frequency” (tf-idf) is calculated and used
for the analysis of a data base containing the climate
change policy plans of Mexico. The rest of the
document is structured as follows: Section 2
introduces the methodology and the construction of
the model, and Section 3 presents the results and
some further lines of research.
2 METHODOLOGY AND MODEL
DESIGN
The hierarchical structure of the climate change
programs is the following:
1. The national climate change strategy (NCCS),
which defined the policies on climate change at the
national level, it is at the top of the hierarchy. This
document was developed by a group of specialists
working at the central government.
2. The special program of climate change (SPCC)
is the legal implementation of the national climate
change strategy. It captures the general lines of action
contained in the NCCS. It is developed by the central
government and contains the specifications of the
regulations, rules, and the specific programs to be
followed.
3. The state programs of climate change (StPCC)
are the documents developed for each state (Mexico
is currently divided into 32 federal entities). They
have to implement at local level the policies and
programs established in the SPCC. The StPCC are
developed by committees of local specialists which
depend on the local governments.
There are also municipal programs of climate change,
1
The source code of the NLTK is available at
http://www.nltk.org/_modules/nltk/text.html
which implement the state policies at the lowest
organization level. However, they are not included in
this study because very few of them had developed at
the moment of the construction of the data base.
However, the natural enrichment of the created base
for the project should include these documents.
At the time of the elaboration of the project’s data
base only 14 federal entities had a finished document.
These are: Mexico city, State of Mexico, Nuevo
León, Tabasco, Baja California Norte, Baja
California Sur, Chiapas, Veracruz, Hidalgo, Quintana
Roo, Yucatán, Coahuila, y Guanajuato. A draft
version for the State of Oaxaca was added to these
documents.
The documents were obtained in pdf format and
converted to plain text in UTF-8 encoding. Texts
were processed in the following way:
1. A pre-processing stage for removing the
documents' stop words (Rajaraman and Ullman,
2011). In the case of the Spanish language these are
for example, “el”, “la”, “los”, “a”, etc. (for a quick
reference in Spanish see
http://www.ranks.nl/stopwords/spanish). These
words are filter out because, by the number of times
they appear, they are considered as less informative
terms. Then, the documents are itemized, i.e. they are
separated until word level. Each term is considered an
"atom" or minimum component, since it is given by
the format of the document itself and do not
dependent on other terms. These words, or tokens, are
consider low-level data, because they do not
explicitly depend on any other term. And the
structures or information that are obtained from them
is considered high-level information. This step also
included the stemming, which roughly speaking, is a
methodology for reduce the space by compacting
words that are derived from others, i.e, reducing
inflected (or derived) words to their word stem, base
or root form. In this way the dimension of the space
of words remains “manageable”.
2. With the extracted tokens, a vector space
containing the documents is created. There, each
document is represented in a vector that contains an
entry for each word or token. There is a zero if the
document does not contain the word, a 4 if it appears
4 times, etc. The processing and pre-processing steps
were performed by using the Natural Language
Toolkit NLTK 3.0 for the Python programing
language (for more information and a quick
introduction to the library the reader is refer to
http://www.nltk.org/).
1
To compare the documents
Term-frequencyInverseDocumentFrequencyfortheAssessmentofSimilarityinCentralandStateClimateChange
Programs:AnExampleforMexico
543
similarity the numerical statistic term frequency-
inverse document frequency (Rajaraman and Ullman,
2011; Luhn, 1957; Spärck, 1972; Manning et al.,
2008; Robertson 2004) was calculated. Then, the
class similarity form the gensim
(http://radimrehurek.com/gensim/similarities/docsim
.html) python library was used to compare the
representations among all the documents. gensim
contains functions and classes for computing
similarities across a collection of documents in the
created vector space. The similarity measure used is
the cosine between two document vectors (Spärck,
1972; Manning et al., 2008; Robertson, 2004). The
results were stored in a similarity matrix which allow
us to compare the documents and to extract some
initial conclusions and elucidate further lines of
analysis.
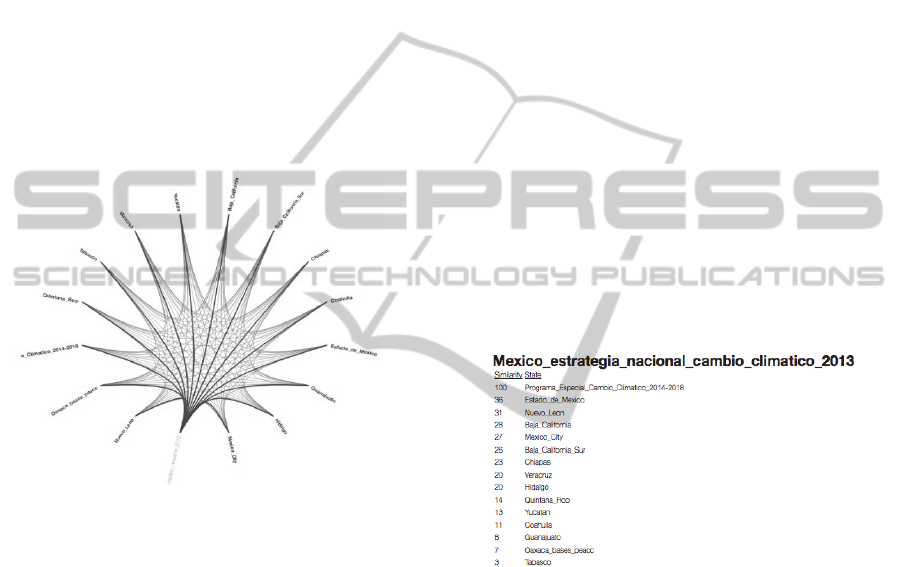
Figure 1: Graphic visualization of the document similarity.
The selected document is connected with all similar
documents. In this case no threshold for the similarity was
used.
The tf-idf reflects how important a word is to a
particular document contained in a set of documents.
Term frequency (tf) essentially counts the times that
a word appears in a document.
The inverse document frequency term (idf), is a
weighting factor. It considers the number of times a
word appear in the set of documents. In other words,
it established that the words that appear less are more
informative than those with higher presence.
The value of tf-idf increases with the frequency of
a word in a document, but is offset by the number of
times that the word appears in the corpus. Generally
speaking the term is highest when occurs many times
within a small number of documents. In this case the
word “tags” the documents. The term is lower when
occurs fewer times in a document, or occurs in many
documents. And lowest when the term is present in
almost all the collection.
Although many expressions exist for tf-idf its
general is:
tf-idf (t,d,D) = tf(t,d) x idf(t,D) (1)
Where t refers to the term, d denote a document
within a collection of documents D. For tf and idf
variants see (Rajaraman and Ullman, 2011; Spärck,
1972; Manning et al., 2008; Robertson, 2004).
The resulting similarity matrix is showed in Table
1. It is also possible to use the interactive
visualization (described below) to explore this matrix.
The abbreviations used are: NS – National Strategy
on Climate Change. P – Special Program on Climate
Change. SM – State of Mexico. NL – Nuevo Leon.
BC – Baja California Norte. MC – Mexico City. BCS
– Baja California Sur. CH – Chiapas. V – Veracruz.
H – Hidalgo. QR – Quintana Roo. Y – Yucatan. CO
– Coahuila. G – Guanajuato. O – Oaxaca. T –
Tabasco.
Values range from 0 to 100. In the tables the
number 100 is represented by 1. The values in the
diagonal are “1” because each document is identical
to itself. The greatest similarity value (100) is reached
between the National Strategy and the Special
Program.
Figure 2: Display of the similarities of the node National
strategy of Climate change (Mexico_estrategia_nacional_
de_cambio climatico). We can see that the more similar
document, as it was expected is the Special program of
climate change (Programa especial de Cambio climatico)
given that is the legal implementation of the NSCC. It can
also be seen that the less similar document corresponds with
the climate program of the state of Tabasco.
An interactive visualization can be found at
(http://diegoolano.com/ivanpaz/). When "click" on
each item, the similarities of the selected document
respect to the others are displayed on the right side of
the screen. We decided to generate a visual
representation of the results, because it could help the
decision-makers to establish new relations among the
data that otherwise could be difficult to find just
looking at the numbers. A screenshot of the
visualization, displaying the similarities respect to
node “National strategy on Climate Change” is shown
SIMULTECH2015-5thInternationalConferenceonSimulationandModelingMethodologies,Technologiesand
Applications
544

in Figure 1. Figure 2 shows the display on the right
side for the same node.
Table 1: Similarity matrix of compared documents using tf-
idf. The name's abbreviations are: NS – National Strategy
on Climate Change. P – Special Program on Climate
Change. SM – State of Mexico. NL – Nuevo Leon. BC –
Baja California Norte. MC – Mexico City. BCS – Baja
California Sur. CH – Chiapas. V – Veracruz. H – Hidalgo.
QR – Quintana Roo. Y – Yucatan. CO – Coahuila. G –
Guanajuato. O – Oaxaca. T – Tabasco. The similarities of
100 are denoted by “1”.
NS SP SM NL BC MC BCS CH V H QR Y CO G O T
NS 1 1 36 31 28 27 26 23 20 20 14 13 11 8 7 3
SP 1 1 55 29 17 56 19 12 15 13 11 50 9 11 10 2
SM 36 55 1 20 27 33 26 26 25 23 8 16 13 8 10 3
NL 31 29 20 1 14 17 14 17 15 13 4 7 12 4 9 3
BC 28 17 27 14 1 14 43 15 22 15 15 11 8 4 8 4
MC 27 56 33 17 14 1 17 13 14 10 7 22 8 5 8 3
BCS 26 19 26 14 43 17 1 23 26 13 8 9 11 5 9 3
CH 23 12 26 17 15 13 23 1 23 12 6 9 9 3 9 3
V 20 15 25 15 22 14 26 23 1 13 6 8 12 4 13 3
H 20 13 23 13 15 10 13 12 13 1 5 5 5 3 6 1
QR 14 11 8 4 15 7 8 6 6 5 1 13 4 2 4 -
Y 13 50 16 7 11 22 9 9 8 5 13 1 6 4 4 2
CO 11 9 13 12 8 8 11 9 12 5 4 6 1 2 3 1
G 8 11 8 4 4 5 5 3 4 3 2 4 2 1 3 -
O 7 10 10 9 8 8 9 9 13 6 4 4 3 3 1 2
T 3 2 3 3 4 3 3 3 3 1 - 2 1 - 2 1
NS SP SM NL BC MC BCS CH V H QR Y CO G O T
3 RESULTS, DISCUSSION, AND
FURTHERWORK
In a first analysis we are interested in comparing the
similarity among the documents, examine whether or
not there are clusters, analyze if all the documents are
equally distanced, identify the closest ones, etc. As
we are not extracting semantic information form the
documents. The index of similarity functions as a
qualitative measure. However, it functions as a
general tool for a first qualitative and general
assessment of the documents data base. In this section
the overall results are presented as well as some
possible lines for future work.
From Table 1 and Figure 2, it can be seen that the
most similar documents are the National Strategy and
the Special Program of Climate Change. As said, this
was expected, since one is the program
implementation of the other. However, this result also
serves as a general validation of the model, because
we expected this two documents to be the more
similar ones.
By inspection of the Table 1, it is possible to
identify a cluster formed by the NSCC, the SPCC, the
Mexico City, and the State of Mexico. Another
cluster is formed by Baja California Norte and Baja
California Sur. Which is remarkable in these clusters
is the strength of the similarities, 43 for BCN and
BCS and around 40 in the case of the second cluster,
which is twice the mean strength of the other
similarities (around 20).
As mentioned earlier, although, this is a
qualitative measure of the documents' similarity, we
can obtain information about its general spatial
distribution in the created vector space. From this
point we can assess them, and preview possible
omissions and conflicts, i.e. if they are attached or not
to the general terms, as well as if they reflect
geographic regions, or regions that share greater
threat to climate change, for example.
So far the only regions that have "cluster" are the
region of the peninsula (BCN and BCS) and the
Mexico City-State of Mexico, but it can also be seen
that are they have great similarity among them.
If we establish a hypothetical threshold, for
example a distance of “15” with respect to the
Nacional Strategy and Special Program on Climate
Change documents. We found that the similarities for
the states of Guanajuato, Oaxaca, Chiapas, Coahuila
and Tabasco are below this value. Then, this could be
a “call for attention” for a carefully review of this
programs.
In this regard, the case of the state of Tabasco is
the most remarkable result, as it could be seen as an
isolated point within the space of documents. If we
analyze its similarity with the other documents, the
closest one is at a distance of 4 and the less similar is
at zero, since it does not appear similar to the states
of Quintana Roo and Guanajuato.
Thus a first analysis of the spatial structure of the
documents can show the points that need a deep
revision. It is clear that the tf-idf in this case allow for
an analysis comparing low-level structures, so we
cannot extract higher-level information with this
method. Then, a next level of analysis could include
the extraction of semantic content, for example
comparing similarity of phrases containing the most
informative terms (less present).
ACKNOWLEDGEMENTS
The present work has been developed with the
support of the Programa de Investigación en Cambio
Term-frequencyInverseDocumentFrequencyfortheAssessmentofSimilarityinCentralandStateClimateChange
Programs:AnExampleforMexico
545

Climático of the Universidad Nacional Autónoma de
México.
REFERENCES
Edenhofer, Ottmar; Kowarsch, Martin (2015) Cartography
of pathways: A new model for environmental policy
assessment. Environmental Science & Policy Volume
51, August 2015, Pages 56–64.
Marsi E, Ozturk P, Aamot E, Sizov G, Ardelan M. (2011)
Towards Text Mining in Climate Science:
Extraction and their Relations. LREC-Language
Resources and Evaluation Conference, BioTXM
Workshop, At Reykjavik, Iceland.
Luhn, Hans Peter (1957). "A Statistical Approach to
Mechanized Encoding and Searching of Literary
Information" (PDF). IBM Journal of research and
development (IBM) 1 (4): 315. doi:10.1147/rd.14.0309.
Retrieved 2 March 2015.
Manning, C. D.; Raghavan, P.; Schutze, H. (2008).
"Scoring, term weighting, and the vector space model".
Introduction to Information Retrieval (PDF). p. 100.
doi:10.1017/CBO9780511809071.007. ISBN
9780511809071. edit.
Pino-Díaz J, Chiadmi-García L, Cebrián-Menchero D, and
Bailón-Moreno R. (2014) Text Mining of Scientific Big
Data for Decision Making in Conservation of
Mediterranean Marine Biodiversity. Journées
d'Intelligence Économique - BIG DATA MININ.
Rajaraman, A.; Ullman, J. D. (2011). "Data Mining".
Mining of Massive Datasets (PDF). pp. 1–17.
ISBN 9781139058452.
Robertson, S. (2004). "Understanding inverse document
frequency: On theoretical arguments for IDF". Journal
of Documentation 60 (5): 503–520.
doi:10.1108/00220410410560582.
Shanmuganathan, S. (2013). “Data/Text mining techniques
in modeling climate change effects on crops.” The
International Conference on Computational and
Network Technologies 2013 (ICCNT), University of
South Australia, Adelaide.
Spärck Jones, K. (1972). "A Statistical Interpretation of
Term Specificity and Its Application in Retrieval"
(PDF). Journal of Documentation 28: 11–21.
doi:10.1108/eb026526.
"Unstructured Data and the 80 Percent Rule". Breakthrough
Analysis. (http://breakthroughanalysis. com/2008/08/
01/unstructured-data-and-the-80-percent-rule/)
Retrieved 2015-02-23.
Xiaoran A, Auroop R. Ganguly, Yi Fang, (2014) Tracking
Climate Change Opinions from Twitter Data. Available
at (http://www.cse.scu.edu/~yfang/climate-fang.pdf).
SIMULTECH2015-5thInternationalConferenceonSimulationandModelingMethodologies,Technologiesand
Applications
546
