Predicting Stock Market Movement: An Evolutionary Approach
Salah Bouktif and Mamoun Adel Awad
College of Information Technology, UAE University, Al Ain, U.A.E.
Keywords:
Stock Market, Data Mining, Ant Colony Optimization, Bayesian Classifiers.
Abstract:
Social Networks are becoming very popular sources of all kind of data. They allow a wide range of users
to interact, socialize and express spontaneous opinions. The overwhelming amount of exchanged data on
businesses, companies and governments make it possible to perform predictions and discover trends in many
domains. In this paper we propose a new prediction model for the stock market movement problem based on
collective classification. The model is using a number of public mood states as inputs to predict Up and Down
movement of stock market. The proposed approach to build such a model is simultaneously promoting per-
formance and interpretability. By interpretability, we mean the ability of a model to explain its predictions. A
particular implementation of our approach is based on Ant Colony Optimization algorithm and customized for
individual Bayesian classifiers. Our approach is validated with data collected from social media on the stock
of a prestigious company. Promising results of our approach are compared with four alternative prediction
methods namely, bagging, Adaboost, best expert, and expert trained on all the available data.
1 INTRODUCTION
Social networks and portable devices have made ex-
change and sharing a huge amount of personal expe-
riences possible. More than 500 million tweets are
shared daily. In particular, tweets on stock markets
are taking part in the everyday traffic on these social
networks. Mining such social behavior of users in so-
cial networks, like Twitter and Facebook, has become
a hot research topic. In social data mining, the behav-
ior of users can be used in predicting global phenom-
ena (Asur and Huberman, 2010) such as stock mar-
ket (Bollen et al., 2011), disease epidemic (Ginsberg
et al., 2008), elections (Gayo-Avello, 2012), movie
box office (Liu, 2006), and marketing (Yu and Kak,
2012). In order to mine social data, we need to con-
sider standard measures of human behavior. The Pro-
file of Mood States (POMS) and its variations (e.g.,
GPOMS), quoted from psychology, are used to mea-
sure individuals mood (Ginsberg et al., 2008). The
combination of these moods can represent individual
sentiment. Doubtlessly understanding the user behav-
ior and relating it to stock market index can affect
positively traders behaviors. However, unlike other
works (Ginsberg et al., 2008; Asur and Huberman,
2010; Gayo-Avello, 2012; Yu and Kak, 2012; Liu,
2006), our focus is to build an ensemble prediction
model that preserves two properties, namely, inter-
pretability and performance. In the context of finan-
cial market, one would like to predict the stock mar-
ket movement not only accurately but also with an
easy understanding of the causality relationship that
leads a particular direction of the stock values. For ex-
ample, one wants to know how specific public mood
states are related to stock changes. Different mining
techniques, in social engineering, have been used in
order to obtain highest prediction performance (Yu
and Kak, 2012). Examples of such techniques include
ANN, Regression, Decision Trees, Rule Mining, and
SVM (Michalski et al., 1986; Goebel and Gruen-
wald, 1999). However, some of these techniques suf-
fer from interpretability shortcomings. Interpretabil-
ity is the ability for an expert to interpret prediction
model by analyzing/examining the causality relation-
ship between input features and prediction outcome.
Such quality is of a critically important; especially
when the user wants to focus her effort to improve
input features to prevent undesirable outcomes. Deci-
sion Trees, Bayesian classifiers, rule set systems, and
fuzzy rules are examples of interpretable techniques
because we can visualize the effect of input features
on the final prediction outcome (Lavra
ˇ
c, 1999). Ex-
amples of non-interpretable techniques include SVM,
Regression, ANN, and ensemble techniques such as
Bagging and Boosting. Although some of the non-
interpretable techniques feature high performance and
strong mathematical background, they are still un-
acceptable by experts in many domains (Kim et al.,
Bouktif, S. and Awad, M..
Predicting Stock Market Movement: An Evolutionary Approach.
In Proceedings of the 7th International Joint Conference on Knowledge Discovery, Knowledge Engineering and Knowledge Management (IC3K 2015) - Volume 1: KDIR, pages 159-167
ISBN: 978-989-758-158-8
Copyright
c
2015 by SCITEPRESS – Science and Technology Publications, Lda. All rights reserved
159
2007; Lavra
ˇ
c, 1999). In this paper, we propose an en-
semble classifiers technique to build prediction model
that is more interpretable and accurate. The model is
based on Ant Colony Optimization (ACO) to com-
bine Bayesian classifiers. We show that our model
preserves the interpretability of individual Bayesian
classifiers and attains higher performance. We apply
such model in the stock market prediction because it
is essential to have highly accurate and interpretable
prediction model according to the market dynamics.
The rest of this paper is organized as follows: Sec-
tion 2 summarizes the related work. Section 3 de-
scribes the problem we are addressing and gives an
overview of the proposed solution. Background tech-
niques are introduced in Section 4. A customization
of Ant Colony Optimization to our problem is pre-
sented in Section 5. A validating experiment is de-
scribed in Section 6. Conclusions and future work are
drawn in Section 7.
2 RELATED WORK
Prediction in social media context has generally gone
three main streams, namely, marketing (Bollen et al.,
2011), movie box-office (Liu, 2006), and informa-
tion dissemination (Yu and Kak, 2012). In market-
ing, Bollen et al. (Bollen et al., 2011) analyzed the
text content of daily Twitter feeds to measure pos-
itive vs. negative mood in terms of 6 dimensions,
namely, Calm, Alert, Sure, Vital, Kind, and Happy.
The main conclusion is that mood states can improve
the accuracy of predictions of the Dow Jones Indus-
trial Average (DJIA). Trasov et al. (Trusov et al.,
2009) employ Word of the Mouth (WOM) in mar-
keting and link it with the number of new members
joining the site (sign-ups). Liu et al. (Liu, 2006)
analyzed data collected from yahoo/movies to show
that WOM activities are very informative during pre-
release and the opening week, and the movie view-
ers tend to hold relatively high anticipation before re-
lease, but become more critical in the opening week.
Other social mining applications include election pre-
diction using Twitter data (Gayo-Avello, 2012), mea-
suring flue spread using Google search queries (Gins-
berg et al., 2008), analyzing and measuring athletic
success based on POMS (Yu and Kak, 2012), and oth-
ers. Although, Bollen’s proposed model is accurate, it
cannot explain precisely how some mood indexes are
related to Dow Jones Industrial Average. In predic-
tion models, the trade-off between interpretability and
performance is gaining an increasing interest. Gener-
ally, researchers have gone in one of the following
two directions to build quality models. First, in order
to improve prediction accuracy, selected models are
combined composing a wisdom council which makes
the final decision. Prediction is done by consulting all
models in the council. The methods known as Ensem-
ble Classifiers Methods (ECM) dominate this strat-
egy. They have demonstrated an out-performance of
classifiers combination on the individual ones when
it is applied to unseen data sets. Namely, averaging,
boosting, bagging, and voting (Moerland and May-
oraz, 1999; Oza and Tumer, 2008; Galar et al., 2012)
are the most commonly used techniques of classifiers
combination. The second strategy aims at preserv-
ing an easy understanding of the causality buried in
the classification models. This is what we refer to
as interpretability of the classifiers. Such a property
is preserved by employing modeling techniques that
outcome white boxy classifiers able to explain the
causal relationship between inputs and outputs. Ex-
amples include the use of decision tree, Networks and
Bayesian classifier, rule set system, fuzzy rule, etc.
In particular, Bayesian classifiers and networks have
been proposed as solution of lack of interpretability in
several domains such as clinical diagnosis (Van Ger-
ven et al., 2007), text and mail classification (Chen
et al., 2009), and software engineering (Fenton and
Neil, 1999; Bouktif et al., 2006).
With respect to the problem of stock market predic-
tion, company managers would like prediction mod-
els to explain precisely how some user mood states are
related to the stock movement direction. Hence, we
propose a high performance and interpretable model
for stock market prediction problem. We build such
a model using Ant Colony Optimization that com-
bines classifiers structures while preserving the inter-
pretability and increasing the accuracy. Our approach
is customized for the case of individual Bayesian
Classifiers (BC) used for stock market movement pre-
diction and validated using empirical experiment.
3 PROBLEM STATEMENT AND
SOLUTION PRINCIPLE
3.1 Problem Statement
Our goal in this work is to construct a prediction
model that maps public mood states collected from
social media to stock market movement. Such a
model is generally built/validated using a representa-
tive data set on the problem being predicted. Particu-
larly, in the problem of stock market movement pre-
diction, the data set D
c
is assumed to be descriptive
of the particular context of a stock market changes.
KDIR 2015 - 7th International Conference on Knowledge Discovery and Information Retrieval
160

Accordingly, if we want to be representative of all
the possible world-wide stock markets contexts, we
have to consider collecting data from all the world,
which is infeasible. A compromising solution is to
reuse learned patterns from different contexts as an
attempt to approximate more representative data. As
an opinion of experts (Bouktif et al., 2002; Bouktif
et al., 2010; Bouktif and Awad, 2013), adopted by
our approach, a high quality prediction model should
be a mixture of domain common knowledge and con-
text specific knowledge. On the one hand, the reuse
of existing experiences of prediction, allows to inte-
grate the common domain knowledge represented by
a diversity of contexts. On the other hand, the adapta-
tion of the models driven by the specific context data
takes into account the specific knowledge represented
by the available context data D
c
. In other words, more
generalizable prediction model is attained by cover-
ing more contexts and building higher performance
expert is achieved by adapting and reusing multiple
expertise. For evaluating our proposed solution and
validating our approach assumption, the best expert
among others, used as a benchmark.
Our problem can be seen as a problem of reusing
N predefined prediction classifiers f
1
, .. . , f
N
called
experts. The objective of our solution is how to im-
prove performance of stock market prediction while
preserving interpretability. Therefore, the challenging
question is how to produce a new optimal BC that in-
herits the ”white-boxy’ property (i.e., interpretability)
of BCs, while improving the prediction performance
on the available context represented by D
c
.
3.2 Solution Overview
To achieve our goal, we propose to reuse existing clas-
sifiers to derive new accurate and interpretable ones.
Our proposed approach is founded on three operations
(1) expertise identification (2) expertise pooling and
(3) expertise adaptation. In the former operation, each
expert is decomposed into chunks of expertise. Each
chunk is a subset of the entire input domain. The
decomposition of a Bayesian classifier, leads to ex-
pertise chunks expressed as a set of prior probabili-
ties attached to each range (interval) of attribute val-
ues (See details in Section 5.1). The rational behind
the decomposition is to give more flexibility to the
process of combination, specially when selecting the
appropriate chunk of expertise. Moreover, the de-
rived expert which is a collection of chunks of exper-
tise, is intended to be interpretable since we know the
particular chunks responsible for the final decision.
The expertise pooling operation consists in reusing
the chunks of expertise coming from different experts
to progressively build more accurate combinations of
these experts using D
c
to guide the search. The exper-
tise adaptation operation consists in modifying some
expertise chunks in order to obtain more refined ex-
pertise combinations to a particular context D
c
.
Our proposed solution can be seen as a search-
ing problem where the goal is to select and gen-
erate the best set of expertise suitable for perform-
ing well in the context D
c
. Therefore, several ex-
isting experts will be decomposed into chunks of
expertise. However, searching an optimal combi-
nation of these chunks will degenerate combinato-
rial explosion. This situation makes the problem an
NP-complete one. Typically, such a problem can
be circumvented by using search-based techniques in
a large search space (Bouktif et al., 2010) (Ahmed
et al., 2008). In this, work, we propose a cus-
tomization of the Ant Colony Optimization to com-
bine Bayesian Classifier based experts.
4 BACKGROUND
4.1 Naive Bayesian Classifier
A Bayesian classifier (BC) is a classification method,
that assigns the most probable class c to a d-
dimensional observation x
i
. by determining its com-
puted as:
c = argmax
c
m
p(c
m
|a
1
, . . . , a
d
),
where c
m
ranges of the set of possible classes
C = {c
1
, . . . , c
q
} and the observation x
i
is written as
generic attribute vector. Assuming that all attributes
are conditionally independent, BC degenerates to a
Naive Bayes. An attribute domain is divided into m
intervals I
jt
j
and p(I
jt
j
|c
m
) will be the prior condi-
tional probability of a value of the j
th
attribute to be
in the interval I
jt
j
when the class is c
m
; t
j
∈ N is the
rank of the interval in the attribute domain. To classify
a new observation x
i
, a BC with continuous attributes
applies Bayes rule to determine the a posteriori prob-
ability p(c
m
|a
1
, . . . , a
d
). as:
p(c
m
|I
1t
1
, . . . , I
dt
d
) =
∏
d
j=1
p(I
jt
j
|c
m
)
∑
q
h=1
∏
d
j=1
p(I
jt
j
|c
h
)p(c
h
)
p(c
m
).
(1)
where a
j
∈ I
jt
j
.
4.2 ACO Metaheuristic
Ant Colony Optimization (ACO) is an algorithm in-
spired by the efficient process by which ants look
Predicting Stock Market Movement: An Evolutionary Approach
161
for food and carry it back to their nest (Deneubourg
et al., 1990). Throughout its trip, an ant deposits
a chemical substance called pheromone which con-
stitutes a mean of indirect communication between
species members (Dorigo et al., 2006). The amount
of pheromone deposited by an ant reflects the quantity
of food as well as the optimality of the traversed path.
Investigations show that at the beginning of the food
search, the ants randomly choose their paths. Never-
theless, after some time and based on their commu-
nications through pheromone trails, the ants tend to
follow the same optimal path. A static graph mod-
eling all the possible paths followed by the ants is
used to represent an optimization problem. Based
on this representation, an artificial ant builds a solu-
tion by moving along the graph and selecting the suit-
able edges towards the optimal path. The deposited
amount of pheromone mirrors the optimality of the
traversed path.
5 CUSTOMIZATION OF ANT
COLONY APPROACH
Customizing ACO algorithm for Bayesian classifiers
combination needs the definition of the following el-
ements; a solution representation, a graph on which
the artificial ants will progressively construct the so-
lutions, a measure of solution quality, a suitable strat-
egy for the ants communication via pheromone up-
date and finally a moving rule that decides for an ant
to move from one node to the next in the graph.
5.1 Solution Structure
The decomposition of BC into expertise chunks is
critical to our based approach. This operation fa-
cilitates the exploration of the search space defined
by all the combinations of expertise chunks. Conse-
quently, it makes the steps of reusing and adapting
the existing BC experts easy and efficacious. Accord-
ing to the description of Naive BCs in Section 4.1,
two BC parameters can represent an expertise chunk,
namely, marginal probabilities of classes, and prior
conditional probabilities of attributes. Since prior
conditional probabilities are more determinant in the
BC structure, we use them to characterize a chunk of
expertise.
For a given attribute j, there are m
j
chunks of ex-
pertise. An expertise chunk can be coded as a triplet
made up of one interval and two conditional proba-
bilities. To elaborate on expertise chunk, let us con-
sider the prediction of stock market movement prob-
lem. The used BCs are binary and each of them pre-
dicts the stock price movement directions. The set of
used class labels is C = {c
1
, c
2
}, with c
1
= up and
c
2
= down. In this example a chunk of expertise is a
triplet, denoted by (I
jt
j
, p(I
jt
j
|c
1
), p(I
jt
j
|c
2
)). It can
be interpreted as follows: the probability of a value
of the j
th
attribute to be within the interval I
jt
j
when
the class is set to c
1
, is equal to p(I
jt
j
|c
1
) and is equal
to p(I
jt
j
|c
2
) when the class is set to c
2
. The index
t
j
∈ N is the rank of the interval in the attribute do-
main that contains N intervals. In this illustrative pre-
diction problem, a mood state attribute j in a BC will
be encoded by the following vector:
[0, 11], 0.241, 0.296
,
[11, 19], 0.303, 0.192
,
[19, 44], 0.209, 0.254
,
[44, 96], 0.253, 0.258
,
where each line encodes a vector of expertise
chunks. An expertise chunk is defined by the triplet
(interval, cond. probability|c
1
, cond. probability|c
2
).
For example, the stock market chunk of expertise
([0, 11], 0.241, 0.296) means that the conditional
probability of a mood state score to be in the interval
[0, 11] when the class is c
1
= up, is equal to 0.241 and
0.296 when the class is c
2
= down. In this particular
example, the mood state attribute is divided into 4
intervals.
5.2 Solution Construction Mechanism
5.2.1 Possible Strategies
There are two candidate strategies of modeling BCs
combination. The first one considers the modular
structure of BC, in which, ACO is applied on each
single attribute. In other words, the artificial ants will
progressively construct, for each attribute, a new com-
position until obtaining a near optimal set of expertise
chunks. On each attribute, the ants work to derive a
new decomposition (i.e., new slicing) of the attribute
domain, and a new distribution of conditional proba-
bilities. Then a final classifier is built-up by grouping
all the near optimal derived compositions for all the
attributes, respectively.
The second strategy considers all the attributes, si-
multaneously. A new BC solutions is built-up from
expertise chunks that contain knowledge from all the
attributes. In this paper, we adopt the first strategy,
however, we will empirically study both in future
work. Therefore, we focus on constructing a solution
at the BC attribute level. The solution construction
mechanism aims at searching the optimal path in a di-
rected graph G(V, E) where V is a set of nodes and E
is a set of edges that will map a BC-attribute structure.
KDIR 2015 - 7th International Conference on Knowledge Discovery and Information Retrieval
162
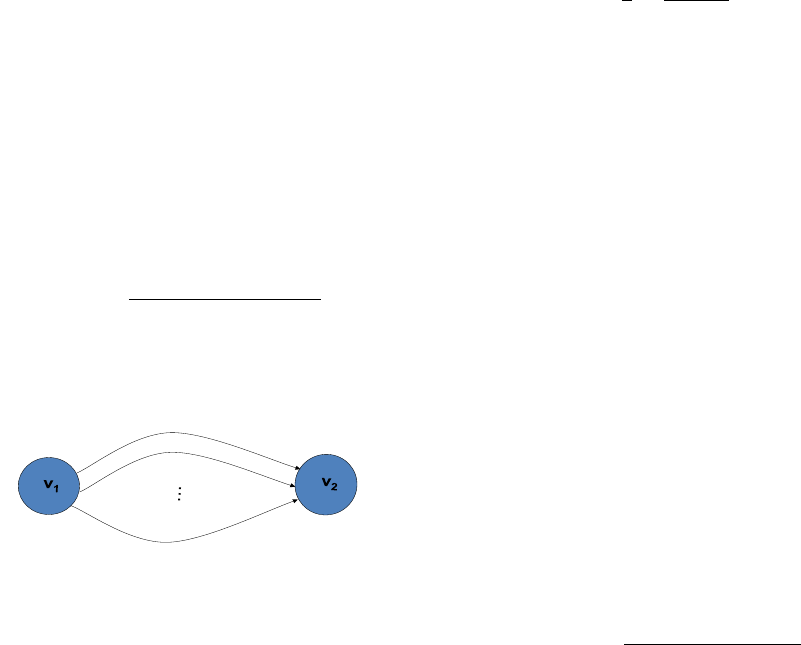
5.2.2 Graph Construction
The first step of the ACO customization is to con-
struct the graph to model the possible paths for the
ants moves. To construct the attribute graph G(V, E),
we first consider all attribute compositions through-
out all the BCs and create a new slicing of the domain
attribute. The new slicing is defined by considering
all the boundaries of the attribute intervals in all
the BCs. The list of all these boundaries sorted in
an ascending order, denoted by B, is used to create
the new slicing such that each interval is bounded
by two adjacent values from B. Therefore, each
node v in V , represents a boundary from the list B
of boundaries of the attribute being processed. The
nodes of an attribute graph are then ordered by value
of boundary. With respect to the set of edges E, we
consider the combination of N BCs, subsequently
N instances of the attribute are to be taken into
account. Therefore, between two consecutive nodes
v
i
and v
i+1
there are N edges e
ik
, k = 1..N. Each
edge e
ik
in E, is labeled with a couple of conditional
probabilities (i.e., p(e
ik
|c
1
) , p(e
ik
|c
2
)). These
probabilities are calculated based on the conditional
probabilities distribution of the original instance of
attribute coming from the k
th
BC. For example, the
conditional probabilities associated with the edge e
11
are computed in the following way:
p(e
11
|c
m
) =
p([v
1
1
, v
1
2
]|c
m
) ∗ (v
2
− v
1
)
(v
1
2
− v
1
1
)
,
where, m = 1, 2 and [v
1
1
, v
1
2
] is the interval contain-
ing the interval [v
1
, v
2
] in the original composition of
the attribute j in the BC number 1. Figure 1 shows
e
11
e
12
e
1N
P(e
11
|c
1
) ; p(e
11
|c
2
)
P(e
12
|c
1
) ; p(e
12
|c
2
)
P(e
1N
|c
1
) ; p(e
1N
|c
2
)
Figure 1: Two-Node Graph for the Mechanism of Solution
Construction.
two nodes from the graph constructed for an attribute
j. As described above, the solution construction
mechanism assumes that the used graph is static,
built on quantized pairs of conditional probabilities;
all possible values of conditional probabilities are pre-
determined, listed, and used to build the static graph.
Thus, attribute compositions that form the candidate
solutions are derived from simple combinations of
edges.
5.3 Solution Quality Measure
The mission of our ACO based approach is to max-
imize the performance of derived BC containing the
attribute composed by the ants. Our approach can be
seen as a learning process where the data set D
c
, the
particular context data, is used to guide the ants in
their trails to construct solutions. Therefore, the set
D
c
is used as evaluation data to compute the predic-
tive accuracy of the derived classifier.
The predictive accuracy of a BC can be evaluated
with different measures as discussed in (Bouktif et al.,
2010). In order to avoid falling in either constant or
guessing classifiers, we decided to use Youden’s J-
index (Youden, 1961), defined as
J( f ) =
1
2
2
∑
i=1
n
ii
∑
2
j=1
n
i j
.
, where n
i j
is the number of cases in the evaluation
data set with real label c
i
classified as c
j
. Intuitively,
J( f ) is the average correctness per label. In statistical
terms, J( f ) measures the correctness assuming that
the a priori probability of each label is the same.
5.4 Ant Walk, Attractiveness and
Visibility
When an ant on a node v
i
moves to the next node
v
i+1
, it chooses an edge e
ik
representing the k
th
cou-
ple of conditional probabilities associated to the in-
terval [v
i
, v
i+1
] and originally copied from the k
th
BC.
Hence, the ant’s task after each move, is to assign a
pair of conditional probabilities to the attribute inter-
val [v
i
, v
i+1
].
Initially, the ants start by moving randomly from
one node to the following one. After some iterations,
the ants become guided by a transition strategy. Such
a strategy consists in choosing the edge to be traversed
based on the amount of pheromone deposited on that
edge. The higher the amount, the higher the proba-
bility of choosing that edge. This probability is com-
puted by the following equation:
p(choosing(e
ik
)) =
τ(e
ik
)
α
∗ η(e
ik
)
β
∑
N
h=1
τ(e
ih
)
α
∗ η(e
ih
)
β
, (2)
where τ(e
ik
and η(e
ik
) are respectively the attractive-
ness and the visibility of the edge e
ik
to be chosen.
The attractiveness function is based on the quality of
the previous solutions. It is modeling the amount of
pheromone accumulated on the trail of ants and de-
fined by the Equation 3. However, the visibility func-
tion is defined as the sum of conditional probabilities
associated with the edge e
ik
. The two parameters α
Predicting Stock Market Movement: An Evolutionary Approach
163
and β are used to balance the impact of attractiveness
(i.e., pheromone) versus visibility. These are two pa-
rameters of the ACO Algorithm and have to be tuned
empirically after several runs. After computing the
probability of choosing every edge e
ik
, k = 1..N, a
Casino wheel method is used to select an edge.
5.5 Pheromone Update Strategy
An ant deposits a quantity of pheromone on ev-
ery edge it traverses. The accumulated quantity of
pheromone constitutes the attractiveness of an edge.
It can also be considered as long-term memory of
the ant colony. In our proposed ACO algorithm,
this long-term memory is updated after an ant fin-
ishes one tour. The schema of updating the deposited
pheromone amount during the iteration t on an edge
e
ik
, k = 1..N, is given by the following equation:
τ(e
ik
)
t
=
(
(1 − ρ) ∗ τ(e
ik
)
t−1
, i f edge is not traversed
(1 − ρ) ∗ τ(e
ik
)
t−1
+ Q ∗ J( f ), otherwise,
(3)
where 0 ≤ ρ ≤ is a parameter of the ACO algorithm
representing the evaporation rate of the pheromone
substance. This parameter indicates low evaporation
at small values and vice-versa. The quantity of the
newly deposited pheromone, ∆τ = Q ∗J( f ), is propor-
tional to both the base attractiveness constant Q and
the quality measure J( f ) that has to be maximized.
6 EXPERIMENTAL RESULTS
In this section, we present the empirical results to val-
idate our proposed approach. We focus on evaluating
the accuracy of the obtained model for stock market
movement prediction derived by combining Bayesian
classifiers. Two inputs are needed for such an eval-
uation. (1) A set of ”existing” models, called stock
market experts that predict stock price movement. In
our case, these prediction models are Bayesian Clas-
sifiers. (2) A representative data set that serves as a
guidance for the classifiers combination process.
6.1 Data Description
Inspired by Bollen’s work (Bollen et al., 2011) and
for the sake of a future comparison with the results
obtained in our previous work (Bouktif and Awad,
2013), we have decided to use public mood states
collected on Twitter as input attributes for the indi-
vidual classifiers. A set of 18 mood states is used
by a prestigious company (i.e. IBM). These 18 mood
state attributes are used to track the negative and pos-
itive mood sentiments during the 9 days preceding
the closing price of a particular stock. Precisely, two
mood state attributes are used to capture, respectively,
the score of negative mood sentiments and the score
of positive mood sentiments of one day. The stock
movement data (i.e., up or down) of the IBM com-
pany is obtained from Google Finance. Let PM
j
and
NM
j
be respectively, the number of positive and the
number negative mood sentiments for a the IBM com-
pany stock j days before closing price, j = 1..9. A
sample of data row could be (16, 32, 43, 13, 28,10, ...,
15,36, Down), where for example, the score of pos-
itive public mood sentiments one day before closing
price is 16 ( i.e., PM
1
= 16) and the score of neg-
ative public mood sentiments one day before closing
price is 32 ( i.e., NM
1
= 32). Besides, the stock move-
ment direction (i.e., Up or Down) as well as the the
mood scores are tracked for a period of more than
20 months. The collected data set contains 462 data
points capturing each 18 mood scores followed by the
stock movement direction.
6.2 Building Individual Stock Market
Experts
For the sake of performing a controlled experiment,
the individual stock market experts are built ”in-
house”. Therefore, we use random combinations of
attributes from the 18 stock mood states (i.e., of two,
three,..., and nine days). By these combinations, we
imitate different opinions of stock market experts that
may predict the direction of the particular stock value
based on different set of mood states about the stock
of the studied company. Randomly, we formed 20
subsets of mood states, and subsequently 20 training
data sets were created. Therefrom, one classifier is
built on each data set by using the RoC machine learn-
ing tool (Ramoni and Sebastiani, 1999).
6.3 Experimental Context Data Set
A data sample called particular context consists of
154 records of mood states about IBM company ex-
tracted randomly from the whole data set (i.e., from
the 462 data points). Also, each record is described by
the 18 mood state attributes and labeled by the stock
movement direction (i.e., up or down). We recall that
the context data set D
c
is supposed to represent stock
market movement prediction circumstances.
KDIR 2015 - 7th International Conference on Knowledge Discovery and Information Retrieval
164

6.4 ACO Algorithm Setting
After several runs, the termination criterion is deter-
mined by the maximum number of iterations (i.e.,
number of tours performed by each ant) which was
set to 150 and the number of artificial ants used to se-
lect the conditional probabilities was set to 100. The
pheromone update is conducted by two parameters,
namely, the pheromone variation that was set to 2.0
and the pheromone evaporation rate ρ that was set
to 1%. In order to balance between the impacts of
pheromone and visibility, α and β were fixed at 1.0
and 1.0, respectively.
6.5 Experimental Design and Results
Four alternative approaches are used as benchmarks
to evaluate the performance of our proposed ACO-
based model construction; the ”best expert selection”
approach, the ”data combination” approach, and two
other methods from the ECM, namely, the bagging
and boosting algorithms. The ”best expert selection”
approach consists in analyzing the performance of the
existing expert across a spectrum of available data
(D
c
), in order to choose the one having the best per-
formance, referred to as f
Best
. The “data combina-
tion” approach takes advantages of the availability of
data sets that served in building the “simulated” ex-
isting experts in this controlled experiment. With the
latter approach an expert, f
AllData
, is trained on the
combination of all the available data sets. With re-
spect to the ECM, the bagging is a voting based meth-
ods that consists in assigning the class that collects
the higher number of votes among the individual ex-
perts (Merz, 1998). In our experiment, it is denoted
f
bagg
. Finally the boosting approach implemented by
the well-known Adaboost algorithm, a sophisticated
weighted sum of individual classifiers outputs (Fre-
und and Schapire, 1997). It is referred to as f
boost
.
Table 1 compares the accuracy of the resulting expert
f
ACO
to those of f
Best
, f
AllData
, f
bagg
and f
boost
, re-
spectively. The accuracies of the obtained classifiers
are evaluated using J-index of Youden and estimated
with 10-fold cross validation. The process of deriving
the new BC is guided by the union of 9 folds from
the context data D
c
. A new classifier is then trained
on the union of 9 folds, and tested on the one remain-
ing fold. The process is repeated 10 times for all 10
possible combinations. The mean and standard devi-
ation of accuracies J-index are computed on both the
training and the test data.
When compared to the best expert f
Best
, the gen-
erated BC f
ACO
has gained 15.90% in predictive ac-
curacy on the training data set and 7.41% on the test-
Table 1: ACO-Based Expert Accuracy compared to other
approaches: Mean(standard deviation if applicable) per-
centage values of the J-index.
Approaches Training J-index Test J-index
f
best
50.10(1.22) 51.41(14.25)
f
AllData
52.84(8.4) 49.84(10.03)
f
Bagg
56.92(-) 53.22(-)
f
Boost
57.43(1.4) 54.93(2.4)
f
ACO
66.00(1.28) 58.82(2.60)
ing data. On both training and testing data, the per-
formance improvement is significantly greater than
each of the standard deviations computed respec-
tively for f
Best
accuracy (e.g., 1.22 or 14.25 ) and
for f
ACO
accuracy (1.28 or 2.6). The null hypothesis
H01, assuming that no differences exist between f
Best
and f
ACO
, is rejected by the statistical testing t-test,
with very strong evidence (Two-tailed t-test, p-value
<1%). Thus a result shows a significant improve-
ment in the accuracy of stock market expert derived
by our approach. Moreover, the accuracy of the de-
rived BC f
ACO
is compared to that of the BC trained
on all the available data denoted f
AllData
and the result
shows a significant difference in performance (i.e.,
13.16% on training data and about 9.00% on testing
data) on the favor of f
ACO
. T-test statistical analysis
shows a signicant accuracy difference between f
ACO
and f
AllData
. The null hypothesis H02, assuming that
no differences exist between f
AllData
and f
ACO
, is re-
jected with very strong evidence (Two-tailed t-test, p-
value <1%).
In order to compare our approach to similar ones,
two ensemble classifiers methods are implemented,
namely, bagging (i.e., f
Bagg
) and boosting (i.e., f
Boost
). The performance of the derived model f
ACO
, shown
in Table 1, is not only comparable to f
Bagg
and f
Boost
but surprisingly higher. A t-test statistics reject with
high significance of more than 95% both the the null
hypothesis H03, assuming that the accuracy of f
ACO
is
significantly lower than that of the bagging f
Bagg
and
the null hypothesis H04, assuming that f
ACO
is signif-
icantly more better than f
Boost
obtained by boosting
technique. Figure 2 shows a summary of the perfor-
mance achieved by the prediction model derived by
our approach (J( f
ACO
)).
7 CONCLUSION
In this paper, we have applied our previously pro-
posed approach of mixture of experts to the problem
of stock market movement prediction. Ant Colony
Optimization was tailored and improved to combine
stock market experts. A data driven combination was
Predicting Stock Market Movement: An Evolutionary Approach
165
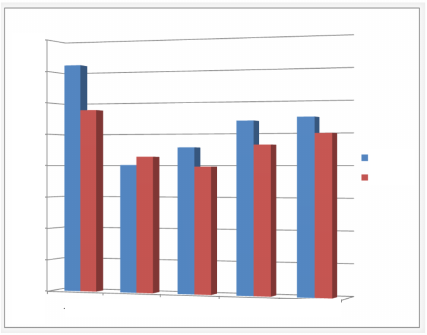
J-index
0.7
0.65
0.6
0.55
0.5
0.45
0.4
0.35
0.3
fACO fBest fAllData fBagg fBoost
Training
Test
Figure 2: Experimental results: Predictive accuracy im-
provement with ACO.
performed and new expert is learned on public mood
data collected from social networks. The novelty of
the proposed models combination resides in the reuse
of the structural elements of individual models rather
than their outputs. This way of combining models
does not only improve the performance of the com-
posite model but it also promotes model interpretabil-
ity. The latter model property is very critical in the
context of stock market decision making. In par-
ticular it is very useful in discovering which mood
states attributes and which mood scores are responsi-
ble for a particular movement of the stock value. The
high complexity of combining expert chunks was re-
solved by the application of a metaheuristic, namely,
ACO algorithm. Bayesian Classifiers are used as in-
terpretable type of prediction models. The results ob-
tained on data of a particular company in the stock
market, show the higher performance of the derived
model when compared to four alternative approaches
including bagging and boosting. Other types of pre-
diction models are to be considered in our future
works. Besides, we will continue collecting more rep-
resentative data from social media. In particular, for
maturing the problem of stock market prediction and
discovering better predictors.
REFERENCES
Ahmed, F., Bouktif, S., Serhani, A., and Khalil, I. (2008).
Integrating function point project information for im-
proving the accuracy of effort estimation. In Advanced
Engineering Computing and Applications in Sciences,
pages 193–198. IEEE.
Asur, S. and Huberman, B. A. (2010). Predicting the fu-
ture with social media. In International Conference
on Web Intelligence and Intelligent Agent Technology,
pages 492–499.
Bollen, J., Mao, H., and Zeng, X. (2011). Twitter mood
predicts the stock market. Journal of Computational
Science, 2(1):1–8.
Bouktif, S., Ahmed, F., Khalil, I., Antoniol, G., and
Sahraoui, H. (2010). A novel composite model ap-
proach to improve software quality prediction. Infor-
mation and Software Technology, 52(12):1298–1311.
Bouktif, S. and Awad, M. A. (2013). Ant colony based ap-
proach to predict stock market movement from mood
collected on twitter. In Proceedings of IEEE/ACM
International Conference on Advances in Social Net-
works Analysis and Mining, pages 837–845.
Bouktif, S., K
´
egl, B., and Sahraoui, S. (2002). Combining
software quality predictive models: An evolutionary
approach. In Proceeding of the International Confer-
ence on Software Maintenance, pages 385–392.
Bouktif, S., Sahraoui, H. A., and Antoniol, G. (2006). Sim-
ulated annealing for improving software quality pre-
diction. In Genetic and Evolutionary Computation
Conference proceeding, Seattle, USA, pages 1893–
1900.
Chen, J., Huang, H., Tian, S., and Qu, Y. (2009). Feature se-
lection for text classification with na
¨
ıve bayes. Expert
Systems with Applications, 36(3):5432–5435.
Deneubourg, J., Aron, S., Goss, S., and Pasteels, J. (1990).
The self-organizing exploratory pattern of the argen-
tine ant. Journal of insect behavior, 3(2):159–168.
Dorigo, M., Birattari, M., and Stutzle, T. (2006). Ant colony
optimization. Computational Intelligence Magazine,
IEEE, 1(4):28–39.
Fenton, N. and Neil, M. (1999). A critique of software de-
fect prediction models. IEEE Transactions on Soft-
ware Engineering, 25(5):675–689.
Freund, Y. and Schapire, R. (1997). A decision-theoretic
generalization of on-line learning and an application
to boosting. Journal of Computer and System Sci-
ences, 55(1):119–139.
Galar, M., Fern
´
andez, A., Barrenechea, E., Bustince, H.,
and Herrera, F. (2012). A review on ensembles for
the class imbalance problem: bagging-, boosting-, and
hybrid-based approaches. IEEE Transactions on Sys-
tems, Man, and Cybernetics, Part C: Applications and
Reviews, 42(4):463–484.
Gayo-Avello, D. (2012). I wanted to predict elections with
twitter and all i got was this lousy paper a balanced
survey on election prediction using twitter data. arXiv
preprint arXiv:1204.6441.
Ginsberg, J., Mohebbi, M. H., Patel, R. S., Brammer, L.,
Smolinski, M. S., and Brilliant, L. (2008). Detecting
influenza epidemics using search engine query data.
Nature, 457(7232):1012–1014.
Goebel, M. and Gruenwald, L. (1999). A survey of data
mining and knowledge discovery software tools. ACM
SIGKDD Explorations Newsletter, 1(1):20–33.
Kim, H., Loh, W.-Y., Shih, Y.-S., and Chaudhuri, P. (2007).
Visualizable and interpretable regression models with
good prediction power. IIE Transactions, 39(6):565–
579.
Lavra
ˇ
c, N. (1999). Selected techniques for data mining in
KDIR 2015 - 7th International Conference on Knowledge Discovery and Information Retrieval
166
medicine. Artificial intelligence in medicine, 16(1):3–
23.
Liu, Y. (2006). Word of mouth for movies: Its dynamics and
impact on box office revenue. Journal of marketing,
pages 74–89.
Merz, C. (1998). Classification and Regression by Com-
bining Models. PhD thesis, university of California
Irvine.
Michalski, R. S., Carbonell, J. G., and Mitchell, T. M.
(1986). Machine learning: An artificial intelligence
approach, volume 2. Morgan Kaufmann.
Moerland, P. and Mayoraz, E. (1999). DynaBoost: Combin-
ing boosted hypotheses in a dynamic way. Technical
report, IDIAP, Switzerland.
Oza, N. and Tumer, K. (2008). Classifier ensembles: Select
real-world applications. Information Fusion, 9(1):4–
20.
Ramoni, R. and Sebastiani, P. (1999). Robust bayesian clas-
sification. Technical report, Knowledge Media Insti-
tute, the Open University.
Trusov, M., Bucklin, R. E., and Pauwels, K. (2009). Effects
of word-of-mouth versus traditional marketing: Find-
ings from an internet social networking site. Journal
of marketing, 73(5):90–102.
Van Gerven, M., Jurgelenaite, R., Taal, B., Heskes, T., and
Lucas, P. (2007). Predicting carcinoid heart disease
with the noisy-threshold classifier. Artificial Intelli-
gence in Medicine, 40(1):45–55.
Youden, W. J. (1961). How to evaluate accuracy. Materials
Research and Standards, ASTM.
Yu, S. and Kak, S. (2012). A survey of prediction using
social media. arXiv preprint arXiv:1203.1647.
Predicting Stock Market Movement: An Evolutionary Approach
167
