Commonalities of Motor Performance Metrics are Revealed by
Predictive Oscillatory EEG Components
M. Tangermann
1
, J. Reis
2
and A. Meinel
1
1
Brain State Decoding Lab, Cluster of Excellence BrainLinks-BrainTools,
Dept. of Computer Science, Albert-Ludwigs-University, Freiburg, Germany
2
Dept. of Neurology, University Medical Center Freiburg, Germany
Keywords:
EEG, Oscillatory Components, Single-Trial Analysis, Performance Prediction, Machine Learning, Spatial
Filters, Subspace Decomposition, Hand Motor Task, Isometric Force, Performance Metrics, Reaction Time,
Jerk, Motor Rehabilitation.
Abstract:
The power of oscillatory components of the electroencephalogram (EEG) can be predictive for the single-trial
performance score of an upcoming task. State-of-the-art machine learning methods allow to extract such pre-
dictive subspace components even from noisy multichannel EEG recordings. In the context of an isometric
hand motor rehabilitation task, we analyse EEG data of n=20 normally aged subjects. Predictive oscillatory
EEG subspaces were derived with a spatial filtering method (source power comodulation, SPoC), and the
transfer of these subspaces between five performance metrics but within data of single subjects was investi-
gated. Findings suggest, that on the grand average of 20 subjects, informative SPoC subspace components
were extracted, which could be shared between a set of three metrics describing the duration of subtasks and
jerk characteristics of the force trajectories. Transfer to any other of the remaining four metrics was not possi-
ble above chance level for a metric describing the reaction time and a metric assessing the length of the force
trajectory. Furthermore we show, that these transfer results are in line with the structure of cross-correlations
between the performance metrics.
1 INTRODUCTION
Motor tasks are performed in rehabilitation scenarios
or in basic research of the human motor system. The
execution quality of repeated trials of the same task
varies and can be assessed on a trial-by-trial basis by
a large number of performance metrics. Examples
are the reaction time, the smoothness of the trajectory
produced, its length, or the duration of trial/repetition.
Each of these metrics focus on different aspects of the
motor task.
Trial-to-trial variations of the motor performance
can have many different causes ranging from an un-
stable experimental setup over varying starting posi-
tions of the user or fluctuating muscle tone to alter-
ations of the mental state of the user. The latter can
be expressed e.g. by varying attention levels during
the presentation of cues or the predisposition of brain
regions involved in the motor execution, and is of in-
terest especially in the context of motor rehabilitation
after stroke. Analysing electroencephalogram (EEG)
data recorded immediately before the execution of
each single motor execution trial with machine learn-
ing methods (M
¨
uller et al., 2008; Parra et al., 2005;
Delorme et al., 2011) can reveal oscillatory activity
of the EEG, which is informative about the perfor-
mance metric of the upcoming trial and may be the
basis for brain-state dependent training paradigms.
For the SVIPT hand motor task used in stroke re-
habilitation (Meinel et al., 2015; Casta
˜
no-Candamil
et al., 2015b) it was proposed to use the supervised
spatial filtering method source power comodulation
(SPoC, (D
¨
ahne et al., 2014)). SPoC finds spatial fil-
ters, which extract oscillatory subspace components
of the EEG within a narrow frequency band. The al-
gorithm optimizes these filters in such a way, that the
resulting subspace components comodulate in power
to a variable which is accessible for every trial. In
the case of SVIPT training, the values of a trial-wise
performance metric can be used as labels to guide the
SPoC algorithm. For the SVIPT task five different
trial-wise performance metrics have been extracted to
describe the quality of the force control.
Concerning the search for comodulating oscilla-
32
Tangermann, M., Reis, J. and Meinel, A..
Commonalities of Motor Performance Metrics are Revealed by Predictive Oscillatory EEG Components.
In Proceedings of the 3rd International Congress on Neurotechnology, Electronics and Informatics (NEUROTECHNIX 2015), pages 32-38
ISBN: 978-989-758-161-8
Copyright
c
2015 by SCITEPRESS – Science and Technology Publications, Lda. All rights reserved
tory components of the EEG, it must be expected that
the exact type of performance metric used (the la-
bels for SPoC) will influence both, the optimal fre-
quency band for the extraction of SPoC components,
and the actual spatial filters/components revealed by
SPoC. While the cross-correlations between the five
metrics can easily be computed, it is an open ques-
tion, if informative oscillatory subspace components
can be transferred successfully between metrics.
2 METHODS
2.1 Hand Motor Task
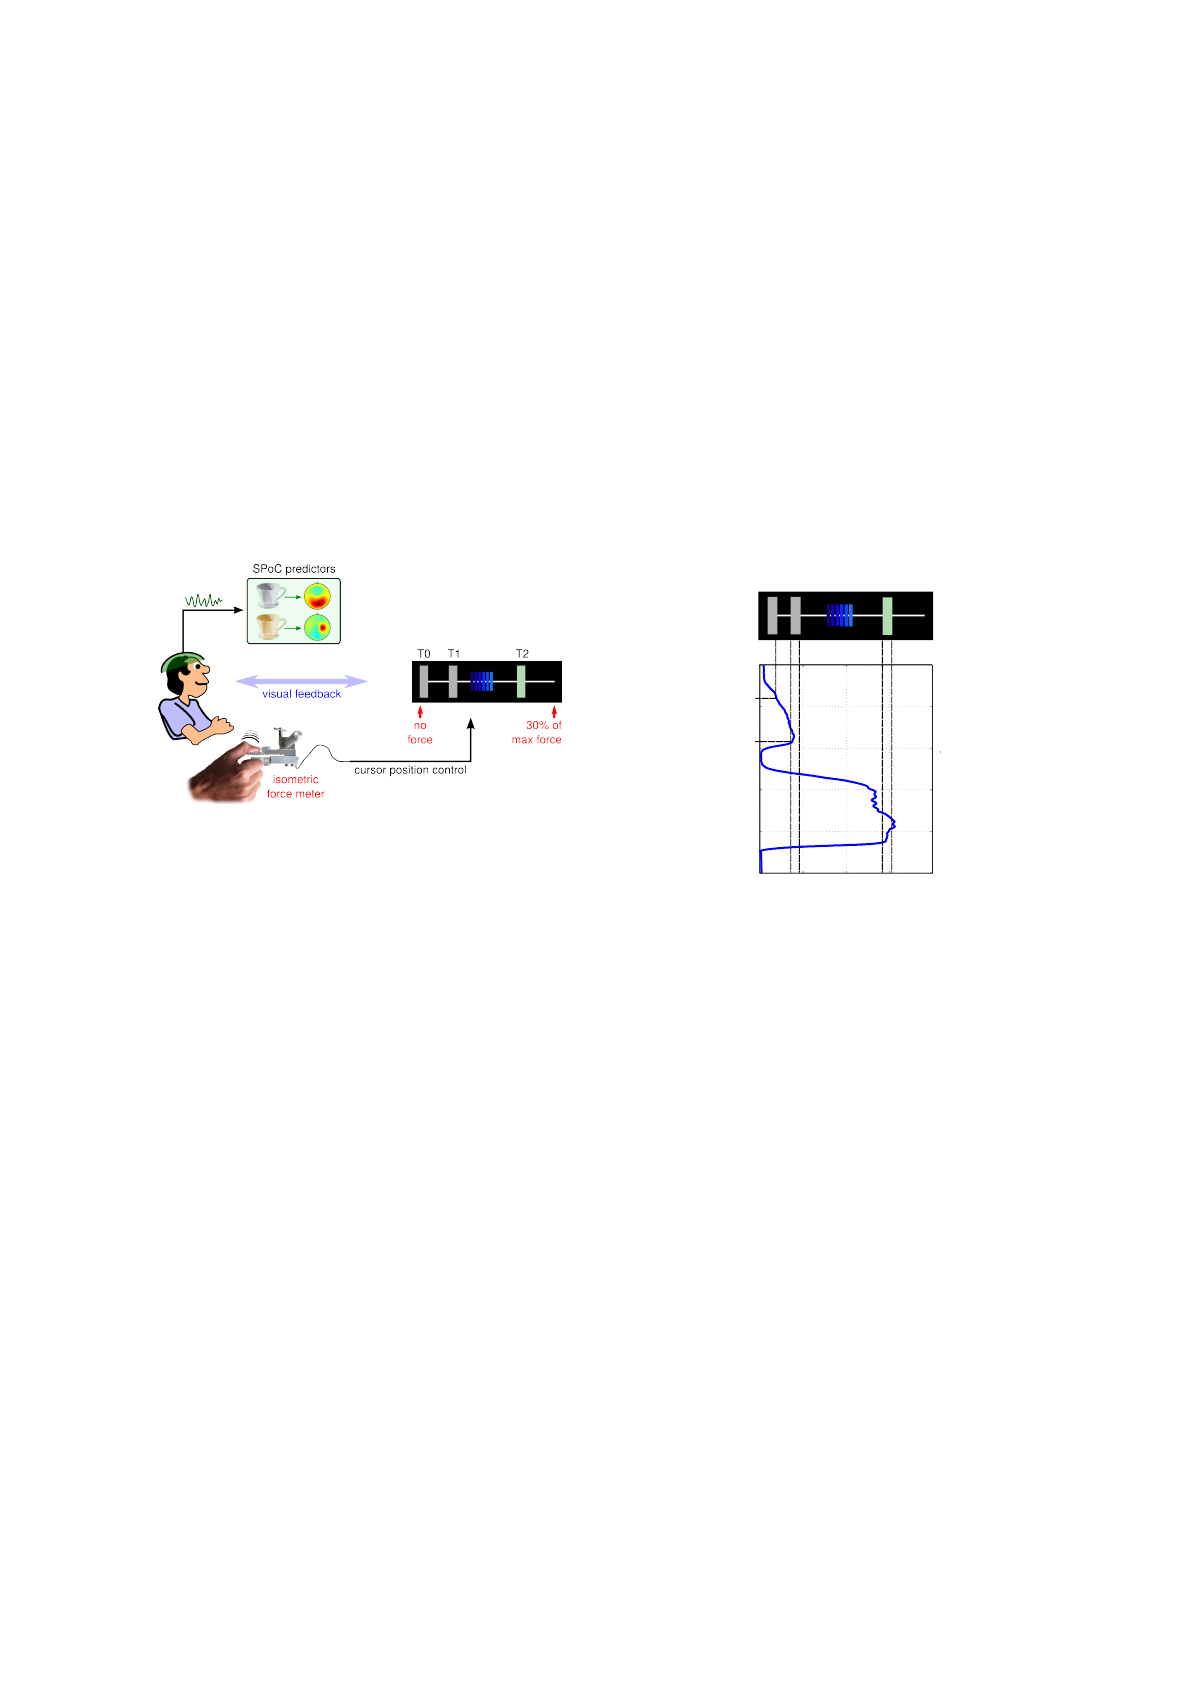
Figure 1: EEG-tracked SVIPT scheme. By force modula-
tion, the horizontal cursor position can be controlled.
The sequential visual isometric pinch task
(SVIPT) (Reis et al., 2009) requires isometric
force control of the thumb and the index finger. Since
SVIPT training improves motor performance upon a
range of hand-motor tasks, the paradigm is applied
in motor rehabilitation after stroke. During a single
trial, the subject is required to control a horizontally
moving cursor by generating an isometric force
between thumb and index finger. All fields (T0, T1,
and T3) are visible during the full duration of a trial.
Field T0 corresponds to zero force and is used as the
starting point of the cursor. Reaching the field T2
requires the highest force application (see Fig. 2).
Each trial comprised the following stages: the vi-
sual presentation of a light blue (still inactive) cursor
indicated the get-ready phase. This interval randomly
varied between 2 s and 3 s of duration and was termi-
nated by the go-cue. At this time point, the cursor
turned dark blue and its horizontal position could be
controlled by the subject. During this running stage
of the trial, the subject was asked to manoeuvre the
cursor through a sequence of the three narrow tar-
get fields as quickly and as accurately as possible.
The two sequence types requested to produce were
either T0-T1-T0-T2-T0 (see the example force pro-
file in Fig. 2) or T0-T2-T0-T1-T0. During a sequence,
the next target field to be hit was visually highlighted
in slight green color. In order to hit a target field, a
dwell time of 200 ms had to be fulfilled. Skipping a
target field and moving on the the next element of the
sequence was not accepted.
Trials with high level of motor control are charac-
terized by a rapid initial force ramp-up and the avoid-
ance of overshoots beyond target fields. As intro-
duced in (Meinel et al., 2015), we modified the orig-
inal SVIPT setup by the additional recording of EEG
activity throughout all stages of the experiment. To
design improved rehabilitation training scenarios, it
would be of interest to identify EEG correlates within
an interval prior to the go-cue, which are predictive
wrt. the trial-wise performance metric.
t
go
Force profile F(t)
t
hit
t
T0,exit
time t
T0 T1 T2
Figure 2: Force profile F(t) for single SVIPT trial. The trial
start at time point t
go
is followed by leaving the target field
T0 with the blue cursor at time point t
TO,exit
. The successful
hit of the first target field is marked at time point t
hit
.
2.2 Subjects, Data Acquisition and
Preprocessing
In total, 20 single sessions from the same number of
right-handed subjects with an average age of 53 years
(std: 6 years) were recorded. Each subject controlled
the cursor with the left hand during 400 trials. Dur-
ing the SVIPT task, EEG signals from 64 passive
Ag/AgCl EasyCap electrodes placed according to the
extended 10–20 system and referenced against the
nose were registered by BrainAmp DC amplifiers.
The data was sampled at 1 kHz. During offline pre-
processing, signals were band-filtered between 0.7 Hz
and 25 Hz and subsampled to 500 Hz. An amplitude
and variance rejection criterion was applied per epoch
and per channel in order to diminish the impact of
noise, eye movements or muscular artifacts. Rejected
epochs were not compensated for, and rejected chan-
nels were not replaced.
Commonalities of Motor Performance Metrics are Revealed by Predictive Oscillatory EEG Components
33

2.3 SVIPT Performance Metrics
Since there is no unique measure to validate the qual-
ity of a single repetition of the SVIPT task, we define
a subset of performance metrics and contrast them
among each other. In the following, five trial-wise
performance scores
1
are motivated. Each of them
is derived from the force profile F
(
t) as described in
Fig. 2:
• Reaction Time / RT: A quick reaction upon the
go-cue is the basis for a successful trial. Reaction
time is defined as the interval between the go-cue
at time t
go
and the time point t
T 0,exit
which indi-
cates the cursor leaving the starting field T0.
• Duration / DUR: In a similar manner as RT, the
duration from the go-cue at time t
go
until the hit
of the first target field at time point t
hit
needs to be
short for a successful trial:
DUR ≡ t
hit
−t
go
(1)
• Cursor Path Length / CPL: The total path length
the cursor is moved from the go-cue to the hit of
the first target field can be described by:
CPL ≡
Z
t
hit
t
go
|
˙
F(t)|dt
0
(2)
• Integrated Squared Jerk / ISJ: Changes in
smoothness of the force profile characterize the
level of fine-granular motor control. Therefore,
the jerk - defined as the third derivative of the
force profile - is contained in the ISJ, which is de-
fined as:
ISJ ≡
Z
t
hit
t
go
|
d
3
F(t)
dt
3
|
2
dt
0
(3)
• Normalized Jerk / NJ: Related to ISJ, the NJ is
a unit-free and proportional measure of the jerk:
NJ ≡
r
ISJ · DUR
5
2 ·CPL
2
(4)
However, the introduced scores CPL, DUR, ISJ and
NJ strongly depend on the selection of an upper time
limit. A good choice of this parameter requires a
trade-off between staying close to the go-cue and the
analysis window (which ends just before the go-cue)
on the one hand, and processing the richer informa-
tion of a full target sequence on the other hand. As a
compromise between both requirements, we decided
to extract these four metrics up to the hit of the first
target field.
1
Except for metric RT, a standardization of the distribu-
tion of performance scores had to be performed before the
measurements of the two sequence types (either T0-T1-. . .
or T0-T2-. . . ) could be joined.
2.4 Source Power Comodulation
The trial-wise SVIPT performance metric can be used
as label information to guide a data-driven machine
learning approach to determine EEG subspaces which
comodulate in band power with a given continuous
performance metric. Source power comodulation
(SPoC) (D
¨
ahne et al., 2014) is a linear spatial filter-
ing method, which maximizes the correlation of an
epoch-wise defined bandpower Φ
x
(e) = Var[ ˆs](e) of
the subspace signal ˆs = w
>
x(t) with a given epoch-
wise metric z(e). The spatial filter w is calculated
by solving argmax
w
{corr[Φ
x
,z]
2
}. The multivariate
variable x(t) ∈ R
N
c
describes the EEG signal with N
c
sensors.
As the alpha band activity of the EEG has been
correlated with visual attention processes (Thut et al.,
2006; Romei et al., 2008) as well as with the
state of the motor system (Pfurtscheller et al., 1996;
Pfurtscheller and Da Silva, 1999), we chose to focus
the analysis to the frequency band of 8 Hz to 13 Hz.
Extracting EEG from a prediction window located
within the get-ready phase and prior to the go-cue
and utilizing performance metrics as described in 2.3,
one can use the resulting spatial filters as predictors
for estimating the motor performance of the upcom-
ing trial. As the EEG signals need to be band-filtered
before entering the approach, the frequency band of
interest and the exact time interval of the prediction
window are hyperparameters which influence the re-
sulting SPoC performance. To optimize these, we
performed a grid search upon different SPoC parame-
ter configurations. The frequency bands [ f
0
, f
0
+ ∆ f ]
were linearly increased within the alpha band range
from f
0
= 8 − 13 Hz with a step size of 0.5 Hz. The
band width was kept fixed at ∆ f = 1Hz. Three differ-
ent time intervals [−∆t,−50ms] relative to the go-cue
with ∆t = {600, 800,1000}ms were investigated for
the prediction window.
The parameter sweep was calculated for each of
the subjects and for all five performance metrics.
For further analysis, the best configuration per sub-
ject and performance metric was chosen according
to their correlation values and pattern similarities.
A detailed methodology to extract informative com-
ponents can be found in (Casta
˜
no-Candamil et al.,
2015b), and (Haufe et al., 2014) motivates the in-
terpretation of subspace components via the resulting
patterns.
NEUROTECHNIX 2015 - International Congress on Neurotechnology, Electronics and Informatics
34
2.5 SPoC Component Transfer Across
Performance Metrics
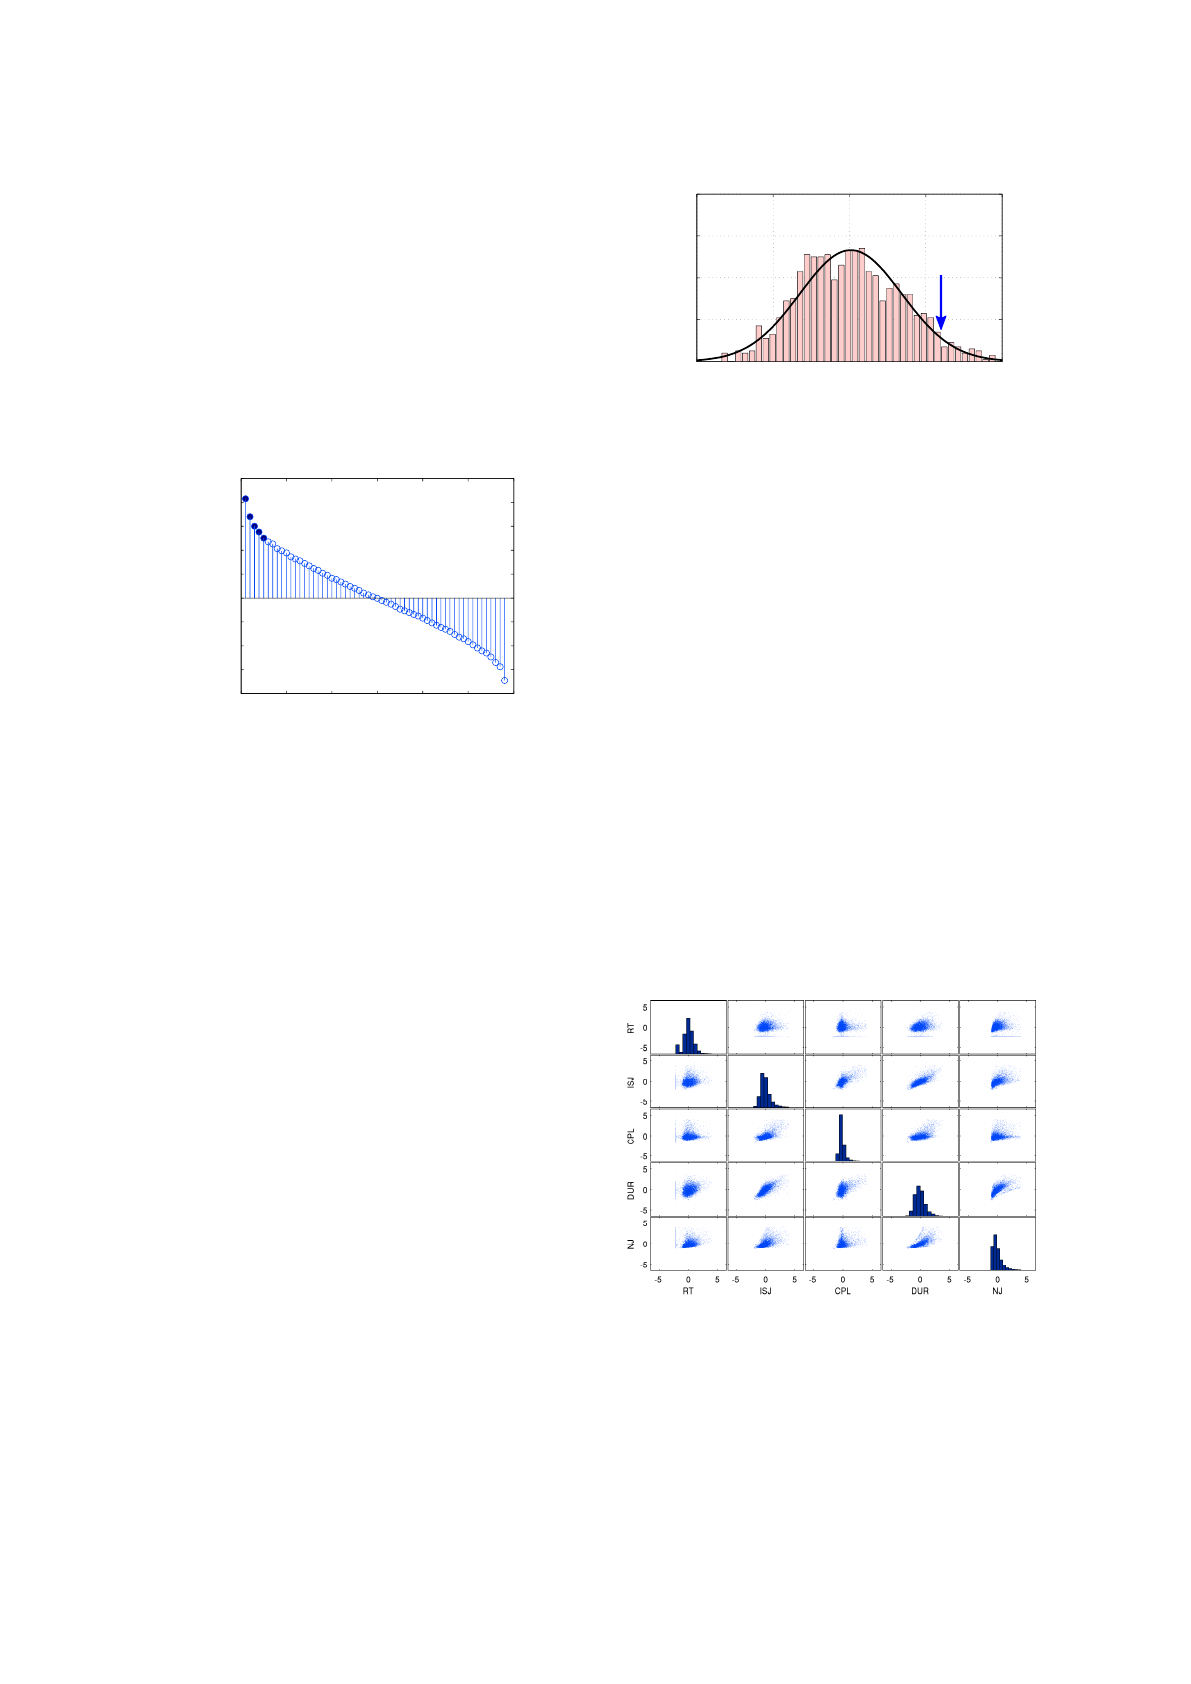
The eigenvalues of SPoC filters correspond to corre-
lations of these components with the underlying per-
formance metric. In Fig. 3 the averaged spectrum
across all 20 subjects and all five performance metrics
is shown. As the correlation values drop rapidly from
component to component, the first e.g. five SPoC
components typically are sufficient to provide an in-
formative subspace.
0 10 20 30 40 50 60
−0.4
−0.3
−0.2
−0.1
0
0.1
0.2
0.3
0.4
0.5
component no.
eigenvalue
Figure 3: Eigenvalue spectrum of SPoC components aver-
aged over 20 subjects and five performance metrics.
In order to investigate common characteristics of
motor performance metrics within subjects, we now
transfer SPoC filters and calculate their correlation
with another performance metric, which had not been
utilized for calculating the spatial filter. For a given
metric i, the epoch-wise band power feature Φ
x,i
us-
ing only the first component is extracted. In a second
step, we report on the correlations of this feature with
all other performance metrics j in a transfer matrix
T
k
(i, j) = corr[Φ
x,i
z
j
] for each subject k. Since the
EEG preprocessing delivers different numbers of re-
maining trials across subjects, we randomly select a
subset of 200 epochs, which ensures the comparabil-
ity of correlation values across subjects. As each ma-
trix T
k
is computed on the basis of a single subject, the
grand-average transfer matrix T
ga
= 1/N
s
∑
T
k
(i, j)
across N
s
= 20 subjects must be derived by averag-
ing. To evaluate the significance level of correlation
values, we computed SPoC repeatedly based on 1000
randomly shuffled label values. As reported in Fig. 4,
the exemplary shuffling of the ISJ labels evokes the
95 % threshold at a correlation value of 0.22. Thus,
the entries of the transfer matrix T (i, j) need to exceed
this threshold in order to report a successful compo-
nent transfer.
−0.4 −0.2 0 0.2 0.4
0
0.02
0.04
0.06
0.08
correlation value
probability distribution (a.u.)
Figure 4: Bootstrapping result for metric ISJ. The 95%
threshold at a correlation value of 0.22 is indicated by a
blue arrow.
3 RESULTS
3.1 Correlations Across Performance
Metrics
The performance metrics described in Sec. 2.3 were
computed across all 20 subjects on each of the 400
trials. Their scatter plots in Fig. 5 depict the grand
average correlations between five motor performance
metrics. For visualization purposes, all values were z-
scored, and values exceeding four standard deviations
were omitted from the scatter plots. The strongest
correlation is obtained between the metrics ISJ and
DUR, non-linear interactions are observed between
DUR and NJ. Metric RT is rather uncorrelated to
the four other metrics, which is (to a lesser extend)
also observed for the metric CPL. The histograms of
the individual metrics reveal that there are symmetric
distributions contained (DUR) as well as asymmetric
ones (NJ, CPL).
Figure 5: Scatter plots visualize the grand average corre-
lations between five motor performance metrics for 8000
SVIPT trials, derived from 20 subjects and 400 trials per
subject.
Commonalities of Motor Performance Metrics are Revealed by Predictive Oscillatory EEG Components
35
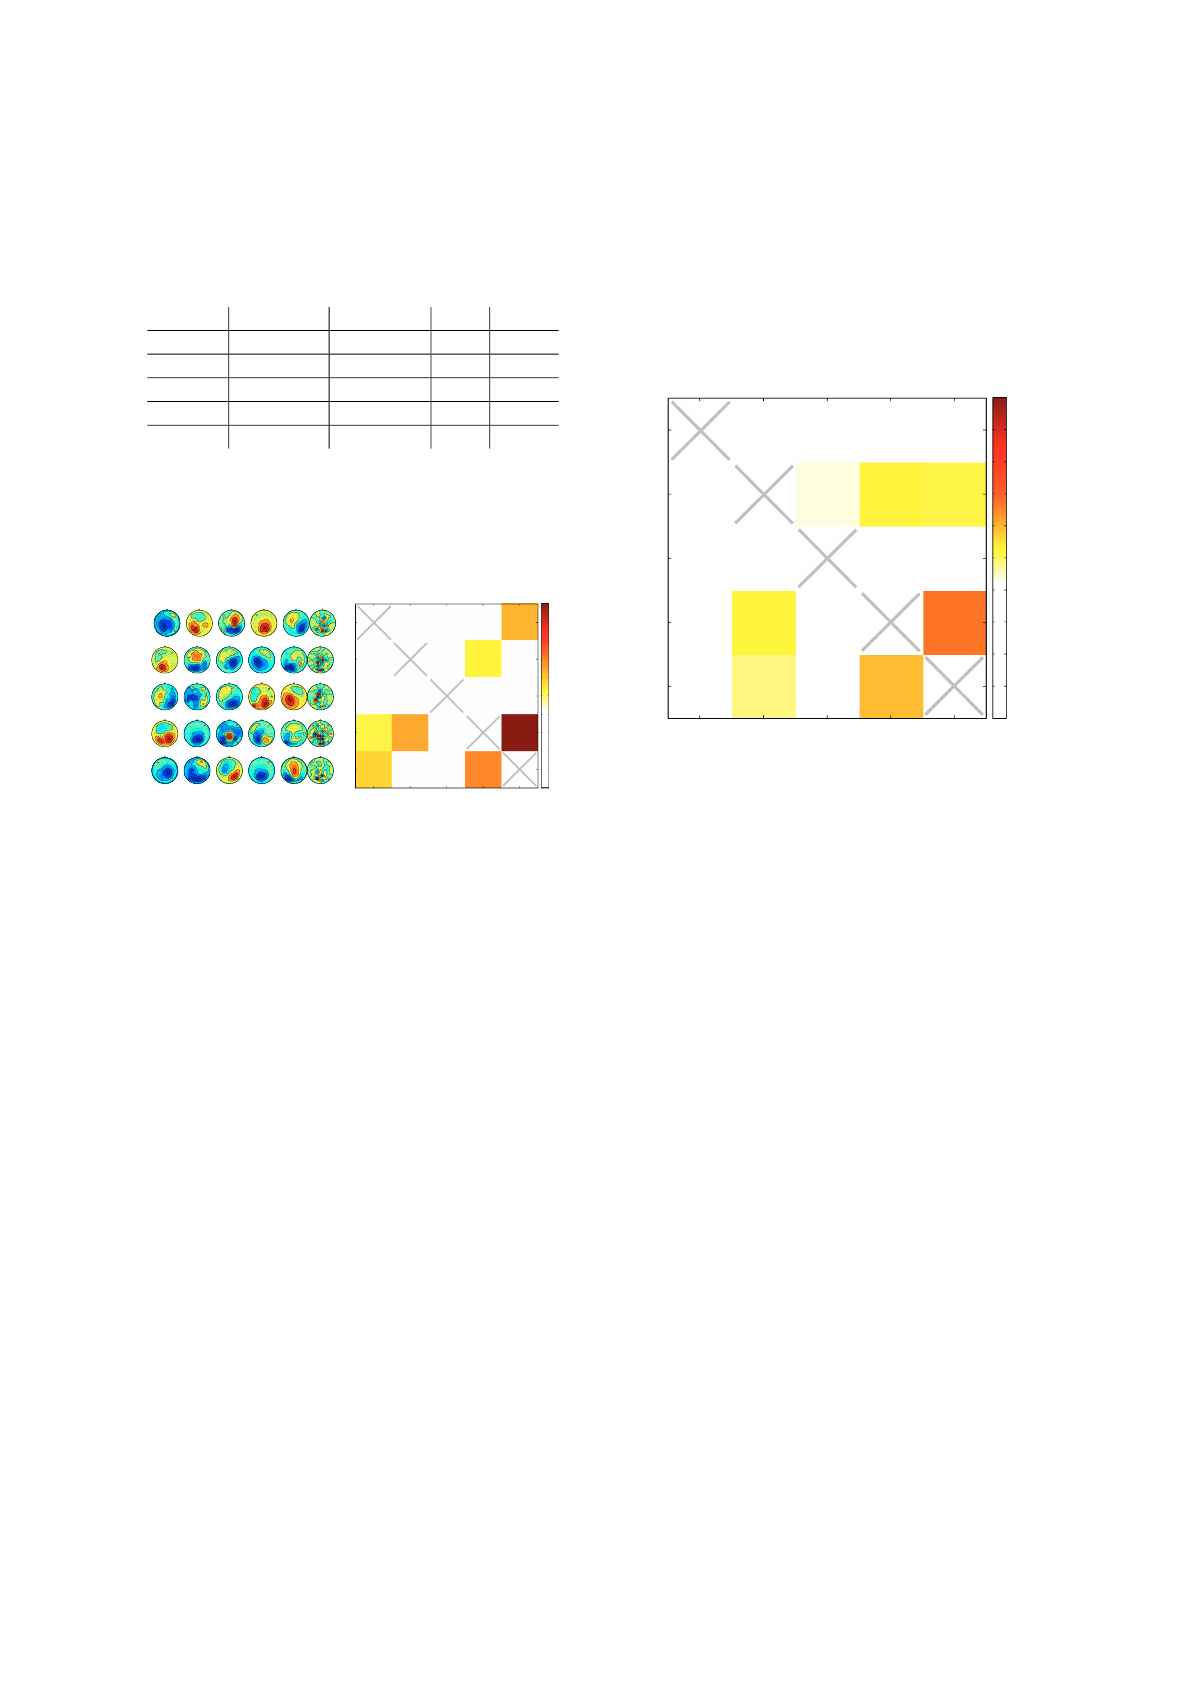
Table 1: For each performance metric, the table lists the op-
timal SPoC parameters derived: the frequency band speci-
fied in Hz, the time interval relative to the go-cue, the num-
ber of first-ranked components contributing to a maximal
correlation value and the correlation value itself.
Metric FQ band Ival [ms] # cp corr
RT 9.0-10.0 -1000,-50 2 0.508
ISJ 11.5-12.5 -1000,-50 1 0.242
CPL 11.5-12.5 -1000,-50 1 0.344
DUR 9.5-10.5 -800,-50 1 0.178
NJ 8.0-9.0 -1000,-50 1 0.214
3.2 SPoC Component Transfer Across
Performance Metrics
RT ISJ CPL DUR NJ
RT
ISJ
CPL
DUR
NJ
0
0.1
0.2
0.3
0.4
0.5
Pattern
#5
Pattern
#4
Pattern
#3
Pattern
#2
Pattern
#1
Filter
#1
Correlation
Figure 6: (Best single subject) Left: First five SPoC activity
patterns for each performance metric according to the best
parameter set are plotted. The corresponding first SPoC
filter is shown in addition. Right: Transfer matrix T (i, j).
(Please see Sec. 3.2 for details).
The SPoC parameters (frequency band and inter-
val interval) have been optimized separately for each
metric, and Table 1 shows the values for the exam-
ple of the best single subject. Please observe, that the
derived best frequency bands vary between the perfor-
mance metrics even within data of this single subject.
The transfer approach is illustrated on data of the
same subject in Fig. 6. The 25 scalp maps on the
left depict the patterns of the first five SPoC compo-
nents of this subject (organized in columns), as de-
rived for the five performance metrics (rows). For the
first-ranked component, the corresponding spatial fil-
ter weights are depicted in an additional scalp map.
Please remind, that only the first-ranked component
has been used to evaluate the correlation for the com-
ponent transfer across metrics. However, as the com-
ponents of the ”receiving” metric may show similar
patterns even in lower ranks, the full five first-ranked
scalp patterns are provided.
The matrix on the right half of Fig. 6 visualizes the
transfer matrix T (i, j) as described in Section 2.5. It
was derived for the same subject. Entry T (i, j) color-
codes the correlation gained by transferring the first-
ranked component of the metric in row i to the met-
ric of column j. Correlation values, which have not
passed the bootstrapping test, have been marked by
white entries. The entries T (4,5) and T (5,4) show
the highest correlation values. It can be observed, that
the involved metrics DUR and NJ share very similar
patterns among their first-ranked components.
RT ISJ CPL DUR NJ
RT
ISJ
CPL
DUR
NJ
0
0.1
0.2
0.3
0.4
0.5
Correlation
Transfer from:
Transfer to:
Figure 7: Grand average transfer matrix T
ga
across all 20
subjects. Each entry (i,j) color-codes the correlation gained
by applying the filter of the first ranked SPoC component
of the metric in row i to the EEG data and correlating the
power of the resulting oscillatory signal to the metric of col-
umn j.
The corresponding grand average results over all
20 subjects are depicted in Fig. 7. The matrix is close
to symmetric, and the transfer of first-ranked compo-
nents seems to work reasonably well within a set of
three metrics (ISJ, DUR and NJ), while the metrics
RT and CPL produce subspace components, which
are not sufficiently informative for other metrics.
4 DISCUSSION AND
CONCLUSIONS
Comparable to experiments close to the visual per-
ception threshold (Schubert et al., 2009; van Dijk
et al., 2008), where characteristics of occipital alpha
oscillations of the EEG have been found informative
about the probability to perceive a stimulus, oscilla-
tory components can also contain information about
the performance quality of a motor task, and influenc-
ing relevant oscillatory activity by user training can
improve reaction time (Boulay et al., 2011). Spatial
filtering with SPoC offers one possibility to access
such components of the EEG.
In the scatter plots of five motor performance met-
rics, it was observed that the metric ISJ is correlated
NEUROTECHNIX 2015 - International Congress on Neurotechnology, Electronics and Informatics
36
with the metric DUR, and DUR with NJ, while the
metric RT is rather uncorrelated to the other metrics.
At first glance, this is surprising, as for example the
metrics RT and DUR both are temporal metrics and
nevertheless are only weakly correlated. A possible
explanation is that RT reflects a very early phase of
the trial, while DUR includes information also from a
slightly later trial stage.
Analyses based on SPoC showed, that the over-
all structure of those cross-correlations between the
five metrics can be reproduced well by an transfer ap-
proach: first, the best oscillatory EEG component on
one metric was estimated, and subsequently its infor-
mative content (in terms of power comodulation) was
tested against other metrics. The metric RT, for ex-
ample, does not show high correlations with the four
other metrics — correspondingly, the power of the
SPoC component derived by RT also does not cor-
relate well with the four other metrics. The opposite
can be observed for the metrics ISJ, DUR and NJ.
These results are astonishing, as the subspace
transfer approach bears a number of potential pitfalls
— the optimal frequency parameters vary between
the five metrics, and the eigenvalue ranking of SPoC
components reveals permutations already due to small
changes of the data set, e.g. caused by label noise
or overly small training data sets (Casta
˜
no-Candamil
et al., 2015a). Nevertheless on the grand average, the
transfer results reproduce the cross-correlation struc-
ture of the metrics.
The transfer results may have practical implica-
tions for the prediction of trial outcomes in a rehabil-
itation training: in cases, where no informative sub-
space can be derived for one metric, a transfer of a
subspace derived from another metric may contain in-
formation if cross-applied. In case of patients, where
lower SNR and a small number of available cali-
bration trials are common problems, the transfer ap-
proach may be key to success. But even under higher
SNR conditions, the trial outcome may be predicted
with an increased reliability, if informative subspaces
can be combined, which have been derived from dif-
ferent metrics.
ACKNOWLEDGEMENTS
The authors appreciate support by the German Re-
search Foundation (DFG, grant EXC1086) for the
cluster of excellence BrainLinks-BrainTools. Part of
this work was performed on the computational re-
source bwUniCluster funded by the Ministry of Sci-
ence, Research and the Arts Baden-W
¨
urttemberg and
the Universities of the State of Baden-W
¨
urttemberg,
Germany, within the framework program bwHPC.
REFERENCES
Boulay, C., Sarnacki, W., Wolpaw, J., and McFarland, D.
(2011). Trained modulation of sensorimotor rhythms
can affect reaction time. Clinical Neurophysiology,
122(9):1820 – 1826.
Casta
˜
no-Candamil, J. S., Meinel, A., D
¨
ahne, S., and Tanger-
mann, M. (2015a). Probing meaningfulness of os-
cillatory EEG components with bootstrapping, label
noise and reduced training sets. In Proceedings of the
Annual International IEEE EMBC Conference 2015,
page (in press), Milano. IEEE.
Casta
˜
no-Candamil, S., Meinel, A., Reis, J., and Tanger-
mann, M. (2015b). P186. correlates to influence user
performance in a hand motor rehabilitation task. Clin-
ical Neurophysiology, 126(8):e166 – e167.
D
¨
ahne, S., Meinecke, F. C., Haufe, S., H
¨
ohne, J., Tanger-
mann, M., M
¨
uller, K.-R., and Nikulin, V. V. (2014).
SPoC: a novel framework for relating the amplitude of
neuronal oscillations to behaviorally relevant parame-
ters. Neuroimage, 86(0):111–122.
Delorme, A., Mullen, T., Kothe, C., Acar, Z. A., Bigdely-
Shamlo, N., Vankov, A., and Makeig, S. (2011).
EEGLAB, SIFT, NFT, BCILAB, and ERICA: new
tools for advanced eeg processing. Computational in-
telligence and neuroscience, 2011:10.
Haufe, S., Meinecke, F., G
¨
orgen, K., D
¨
ahne, S., Haynes,
J.-D., Blankertz, B., and Bießmann, F. (2014). On
the interpretation of weight vectors of linear models in
multivariate neuroimaging. NeuroImage, 87:96–110.
Meinel, A., Casta
˜
no-Candamil, J. S., D
¨
ahne, S., Reis, J.,
and Tangermann, M. (2015). EEG band power pre-
dicts single-trial reaction time in a hand motor task.
In Proc. Int. IEEE Conf. on Neural Eng. (NER), pages
182–185, Montpellier, France. IEEE.
M
¨
uller, K.-R., Tangermann, M., Dornhege, G., Krauledat,
M., Curio, G., and Blankertz, B. (2008). Machine
learning for real-time single-trial EEG-analysis: from
brain–computer interfacing to mental state monitor-
ing. Journal of Neuroscience Methods, 167(1):82–90.
Parra, L. C., Spence, C. D., Gerson, A. D., and Sajda, P.
(2005). Recipes for the linear analysis of EEG. Neu-
roImage, 28(2):326–341.
Pfurtscheller, G. and Da Silva, F. L. (1999). Event-
related EEG/MEG synchronization and desynchro-
nization: basic principles. Clinical neurophysiology,
110(11):1842–1857.
Pfurtscheller, G., Stanc
´
ak, A., and Neuper, C. (1996).
Event-related synchronization (ERS) in the alpha
band — an electrophysiological correlate of cortical
idling: a review. International journal of psychophys-
iology, 24(1):39–46.
Reis, J., Schambra, H. M., Cohen, L. G., Buch, E. R.,
Fritsch, B., Zarahn, E., Celnik, P. A., and Krakauer,
J. W. (2009). Noninvasive cortical stimulation en-
hances motor skill acquisition over multiple days
Commonalities of Motor Performance Metrics are Revealed by Predictive Oscillatory EEG Components
37
through an effect on consolidation. Proceedings of
the National Academy of Sciences.
Romei, V., Brodbeck, V., Michel, C., Amedi, A., Pascual-
Leone, A., and Thut, G. (2008). Spontaneous fluctu-
ations in posterior α-band EEG activity reflect vari-
ability in excitability of human visual areas. Cerebral
cortex, 18(9):2010–2018.
Schubert, R., Haufe, S., Blankenburg, F., Villringer, A.,
and Curio, G. (2009). Now you’ll feel it, now you
won’t: EEG rhythms predict the effectiveness of per-
ceptual masking. Journal of Cognitive Neuroscience,
21(12):2407–2419.
Thut, G., Nietzel, A., Brandt, S. A., and Pascual-Leone, A.
(2006). α-band electroencephalographic activity over
occipital cortex indexes visuospatial attention bias and
predicts visual target detection. The Journal of Neu-
roscience, 26(37):9494–9502.
van Dijk, H., Schoffelen, J.-M., Oostenveld, R., and Jensen,
O. (2008). Prestimulus oscillatory activity in the al-
pha band predicts visual discrimination ability. The
Journal of Neuroscience, 28(8):1816–1823.
NEUROTECHNIX 2015 - International Congress on Neurotechnology, Electronics and Informatics
38
