
Action Sequence Matching of Team Managers
Olaf Flak
1
, Cong Yang
2
and Marcin Grzegorzek
3
1
Faculty of Radio and Television, University of Silesia in Katowice, Katowice, Poland
2
Pattern Recognition Group, University of Siegen, Siegen, Germany
3
Faculty of Informatics and Communication, University of Economics in Katowice, Katowice, Poland
cong.yang@uni-siegen.de
Keywords:
Team Managers, Partial Matching, Action Matching.
Abstract:
Traditionally, team managers are analysed and compared based on human perception with data collected from
surveys and questionnaires. These methods normally have low efficiency especially in dynamic and complex
environments. In order to improve the accuracy and stability of manager analysis in management science,
in this paper, we propose a novel manager representation method which is general and flexible enough to
cover most types of managers. For manager analysis, we introduce the first manager matching algorithm that
calculates the global similarity between managers. The proposed matching algorithm not only returns robust
and stable manager similarities, but also details the matched parts among managerial action sequences. With
this, the proposed methods provide more research possibilities in management science.
1 INTRODUCTION
A team is defined as a social system of two or more
units that are embedded in an organisation (Hoegl and
Parboteeah, 2007). In a team, team members per-
ceive themselves and each other as collaborating on
a common task. For the purpose of improving the
team work ability on more dynamic and complex en-
vironments (Mathieu et al., 2008) today, research on
team work becomes more and more relevant (Shak-
shuki et al., 2003) and has attracted a lot of attention
in the past decades (Mathieu et al., 2008). One com-
mon perception of those researches is that team man-
agers are the spirit of team works (Sohmen, 2013).
A team manager can be defined as a team member
(1) who comprises influencing actions affecting the
other team members and (2) who chooses objectives
for the team, organizes activities to accomplish the
objectives and (3) who motivates team members to
achieve the objectives and maintains cooperative re-
lationships and teamwork to optimise collective time
of work (Perlow, 2014).
A team and a team manager are the warp and
woof of the dynamic fabric of organisations. They
cannot exist without each other activated by manage-
rial actions as a constellation of specific objectives,
resources and processes (Sohmen, 2013). Moreover,
in order to ensure a team can achieve the established
goals with clear assumptions, it is crucial to clarify
managerial actions that govern team actions (Sinar
and Paese, 2016). Consequently, it leads to a strong
need for research on managerial action analysis (Hal-
liday and Stacey, 2009). In general, there are two re-
search challenges related to managerial action anal-
ysis. The first challenge is how to model the man-
agerial actions in order to fully represent the charac-
teristics of a team manager. The second challenge is
what kind of methods could be employed to distin-
guish team managers and, additionally, to label their
styles of leadership. Traditionally, the first challenge
is addressed by the action sequence analysis which
used to track the order of actions over time (Abbott,
1990). Those actions are usually declared by man-
agers and then collected by questionnaires (Barnes,
1980). Based on that, a team manager can be repre-
sented by a data map describing the action features
of, e.g. “what”, “when” and “how” (Beshears and
Gino, 2015). However, this method is not robust be-
cause some managerial actions could be ignored due
to the poor memory and impression of team man-
agers (Flak and Pyszka, 2013). Moreover, this repre-
sentation method is not general and has low flexibility
since different managers may take different types of
managerial actions (Beshears and Gino, 2015).
In order to solve these problems, in this paper,
we propose a general model to represent a manager
by managerial actions and their features. Specifi-
cally, a manager is first represented by an action se-
386
Flak, O., Yang, C. and Grzegorzek, M.
Action Sequence Matching of Team Managers.
DOI: 10.5220/0006189203860393
In Proceedings of the 6th International Conference on Pattern Recognition Applications and Methods (ICPRAM 2017), pages 386-393
ISBN: 978-989-758-222-6
Copyright
c
2017 by SCITEPRESS – Science and Technology Publications, Lda. All rights reserved

quence. After that, each action is modelled by ac-
tion features within different feature groups. Theoret-
ically, the proposed method can preserve both fine-
and coarse-grained information of a manager. The
main reason is that we describe each managerial ac-
tion by several different action features. Moreover,
the proposed method is general enough to cover most
types of managers since the each managerial action
is represented by flexible feature groups. Lastly, the
proposed model can be easily adapted to different on-
line/off-line managerial tools.
For the second challenge, the team managers
are normally distinguished and labelled by human
perception (Whetten and Cameron, 2016) of, e.g.
managerial actions, attitudes and values. However,
there are four main disadvantages of such a method:
Firstly, it cannot accurately measure the similar-
ity/dissimilarity between managers since human per-
ception is highly abstract. Secondly, this method is
not robust due to the instability of human percep-
tion (Yang et al., 2016). Thirdly, this method has
low efficiency since the distinguishing and labelling
processes are both applied manually. Lastly, even
if two managers are similar to each other by hu-
man perception, it is hard to point the detailed sim-
ilar/dissimilar parts among their managerial action
sequences. Therefore, we propose a method that
can overcome these disadvantages. Particularly, by
the action matching between managers, the proposed
method not only returns the similar parts among ac-
tion sequences, but also calculates the global sim-
ilarities. In order to do so, the proposed match-
ing method integrates both local and global match-
ing strategies. The local matching strategy allows
an accurate measuring of local similarity between ac-
tion blocks within action sequences while the global
matching strategy calculates the overall similarity be-
tween managers based on the local similarities. In
such a case, the proposed method can automatically
and accurately distinguish team managers. In addi-
tion, this method provides more research possibilities
in management science (Siedlok and Hibbert, 2014).
The main scientific contributions of this article in-
clude: (1) We apply an interdisciplinary research be-
tween management science and pattern recognition to
deal with the team manager representation and match-
ing. (2) We introduce an effective and general team
manager representation method. (3) We propose the
first algorithm that can accurately measure the simi-
larity between team managers.
2 RELATED WORK
The view of a manager has changed many times over
the last hundred years. At the beginning of the sci-
entific management age, a manager in an organisa-
tion was represented by his/her functions, such as a
reflective planner, an organiser, a leader or a con-
troller (Brodie, 2007). However, these approaches
do not have the information of real managerial ac-
tions. Besides many other later approaches, it took 50
years to experience a significant change in the view of
manager natures. Particularly, the most dominating
approaches consist of two main concepts: (1) man-
agerial roles that a manager should play (Mintzberg,
1973), and (2) managerial skills that a manager
should have (Beaudry and Francois, 2010). Koontz
and O’Donneil launched a discussion on the meaning
of managerial skills in 1964 (Koontz and O’Donneil,
1964). In 1974 Katz proposed an approach in which
a manager is represented by managerial skills. He
claimed that successful managers are indeed eclectic
and they must possess and be skilled in technical, hu-
man and conceptual areas of organisational life (Katz,
1974). In 1973 Mintzberg concluded that a manager
can be described in terms of 10 roles (Mintzberg,
1973). Due to the deep influence of these concepts
among scientists and practitioners, in most publica-
tions a manager is represented by managerial skills
and managerial roles (Sinar and Paese, 2016).
Based on the survey and analysis of the published
methods, we draw a conclusion that managerial skills
and managerial roles as traditional theoretical con-
cepts are sufficient to represent a team manager. But
they are still not general and robust enough to describe
most types of managers. The main reason is that the
concepts of managerial skills and managerial roles
only illustrate what competences a manager should
have and should do, respectively. They do not show
what a manager really does. Built on this observation,
in Section 3, we represent a manager by managerial
actions which are the missing point in relations be-
tween managerial skills and managerial roles. With
this, the proposed representation method integrates
managerial skills and managerial roles and turns them
into managerial actions. Therefore, comparing to the
traditional manager representation method, the pro-
posed approach has high distinguish powering and
stability. In addition, this representation method is
suitable for action sequence matching in Section 4.
Moreover, we also observe that most research
projects were conducted by the survey method with
questionnaires as a research tool (Sinar and Paese,
2016). With this method, it is hard to quantitatively
compare the difference between managers. In order
to distinguish different types of managers, the tradi-
tional perception-based methods are not robust since
human perception could be influenced by many fac-
Action Sequence Matching of Team Managers
387
Thing 1.1
Thing 3.1
Thing 1.2
Event 2.1
Action 1
Action 2
Action 3
Action 4
Event 1.1
Thing 2.1
Event 3.1
Event 1.2
Figure 1: Fundamental structure of actions.
tors such as memory, emotions, etc. These methods
are time-consuming because they are normally carried
out manually (Alexandru and Diana, 2015) or semi-
automatically (Sinar and Paese, 2016). To solve these
problems, we propose an automatic method that can
calculate the similarity between managers based on
their action sequences. In addition, the partial simi-
lar/dissimilar action blocks within sequences can also
be returned. With the proposed method, researchers
can apply a deeper and more accurate analysis of
managers and their actions. In such a case, the pro-
posed method gives more potential research possibili-
ties in management science. Moreover, since the pro-
posed manager representation and matching are fully
automatic methods, they can be adopted to some man-
agement applications (Mithas et al., 2005). For in-
stance, a manager can be guided by action sequence
matching with the knowledge action sequences from
other managers.
3 MANAGER REPRESENTATION
In this section we first introduce the relationship be-
tween managers and their actions. After that, we theo-
retically describe the feasibility of manager represen-
tation using actions and their features. Built on this,
a mathematical model for manager representation is
proposed.
3.1 Managers and Actions
In this article, a team manager is denoted as Ω. As
discussed in Section 1 and 2, compared to the tra-
ditional approaches that represent Ω by managerial
roles and managerial skills, we propose to represent
Ω by managerial actions. The rationale behind this
is that a managerial action can be defined as a real
activity which a manager does in order to play a man-
agerial role and have a certain managerial skill (Pavett
and Lau, 1982). In such a case, a managerial action is
the connection between a managerial role and a man-
agerial skill. Consequently, the proposed representa-
tion method has higher description power.
To represent each managerial action, it is impor-
tant to discuss and analyse its ontological concept:
The system of organisational terms (SOT). SOT is
an original theoretical construct in which the organ-
isation performance is tracked and recorded. In or-
der to do so, observation techniques are used along
with the on-line management tools (Flak, 2015). The
philosophical foundation of SOT is based on Wittgen-
stein’s philosophy: Facts (the only beings in the
world) and their “states of facts” (Brink and Rewitzky,
2002). We extend this concept and propose that man-
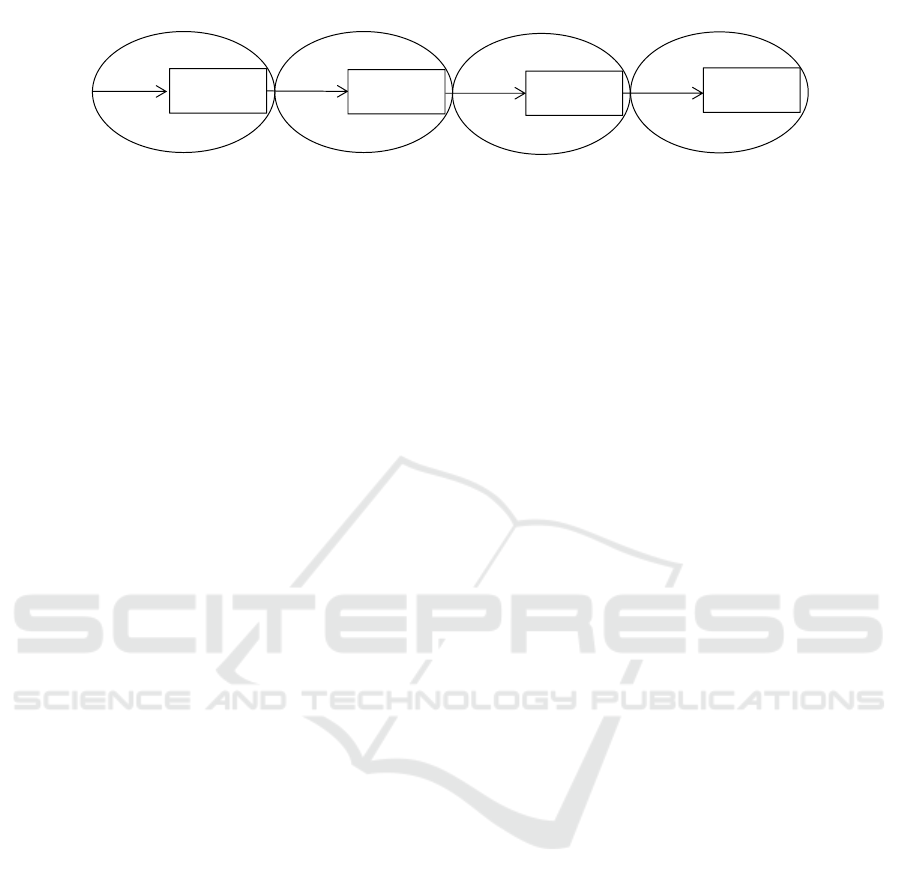
agerial actions can be organised by events and things.
Specifically, as shown in Figure 1, each event and
thing have the label I.J, in which I and J represent
a number and a version of a thing, respectively. Event
1.1 causes thing 1.1, which in turn releases event 2.1
that creates thing 2.1. Thing 2.1 starts event 3.1 which
creates thing 3.1. Then, thing 3.1 generates a new ver-
sion of the first event, i.e. event 1.2. In such a way,
a new version of the first thing is created, which is
called thing 1.2.
According to events and things, a managerial ac-
tion can be represented by time domain features and
content domain features, respectively (Brinkerhoff,
1985). In this article, we employ the time domain fea-
tures since such features can be easily captured and
quantised. In contrast, the content domain features
involve words, sentences, expressions, characters and
figures, etc. which are hard to be quantised by exist-
ing models (Alnajjar and Flak, 2016).
3.2 Representation Model
As a manager is organised by several actions, we rep-
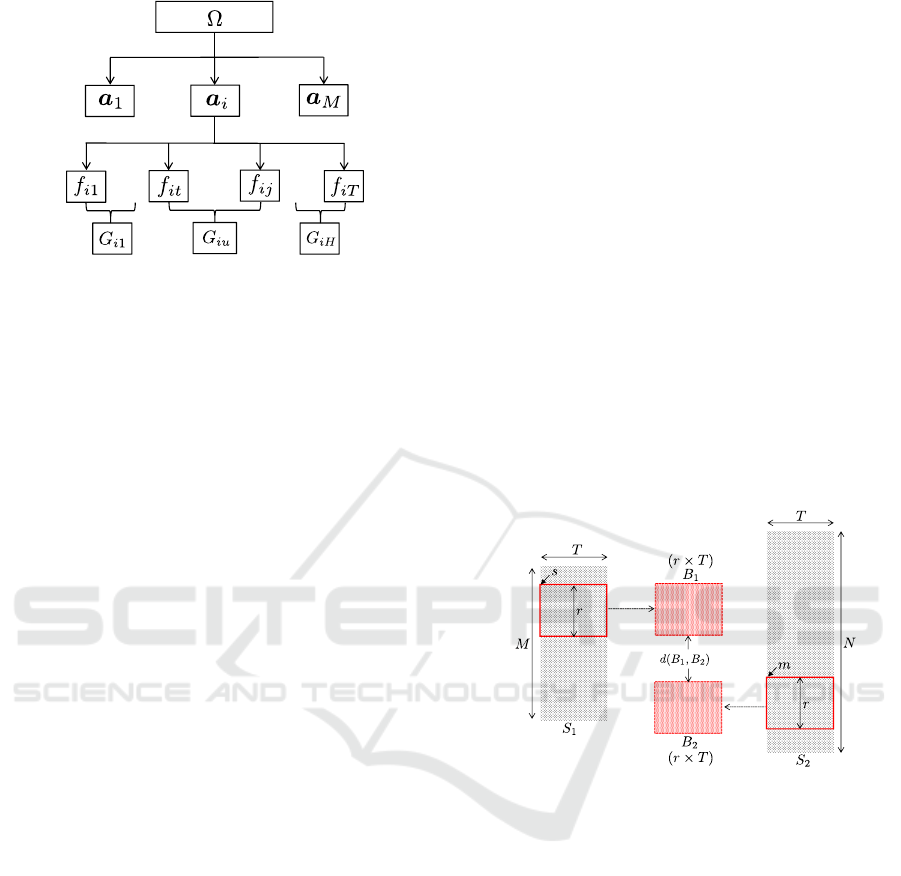
resent it by features of each action. Specifically, as
shown in Figure 2, a manager Ω is composed by M
actions:
Ω = {a
a
a
1
,··· ,a
a
a
M
} . (1)
For a single action a
a
a
i
, it can be represented by a
T -dimensional feature vector:
a
a
a
i
= [ f
i1
,··· , f
iT
]
T
. (2)
where f denotes a single feature value, i =
1,2,··· ,M. As discussed in Section 3.1, those fea-
tures can also be classified into H groups based on
their characteristics, H 6 T . Moreover, the feature
ICPRAM 2017 - 6th International Conference on Pattern Recognition Applications and Methods
388
...
...
...
...
...
...
...
Figure 2: The proposed model to represent a manager Ω.
number in a group G
iu
may be different from others,
u = 1, · · · , H. For example, in Figure 2, G
i1
and G
iH
could have different feature numbers. For notational
simplicity we assume that the features of a
a
a
i
are or-
dered according to the order of their groups. In such
a case, G
im
= [ f
it
,·· · , f
i j
], 1 6 t 6 j and t 6 j 6 T .
Consequently, an action a
a
a
i
can also be represented by
feature groups:
a
a
a
i
= {G
i1
,·· · ,G
iH
} . (3)
Considering all M actions of a manager Ω, it can
be represented by all action features within H feature
groups:
Ω = {G
G
G
1
,·· · ,G
G
G
u
,·· · ,G
G
G
H
} . (4)
where G
G
G
u
is a M × ( j − t + 1) matrix in which all M
action features within a feature group [ f
t
, f
j
] are pre-
served. The proposed representation method in Eq. 4
will be used for action sequence matching in Sec-
tion 4.
It should be noted that the idea of representing
a manager by feature vectors is not new. Such an
idea is also similar to one of the first research by
F. and L. Gilbreth in the field of scientific man-
agement at the beginning of 20th century (Karsten,
1996). They investigated human motions at work,
which was the beginning of workforce automation in
industries (Spriegel et al., 1953). Moreover, in lit-
erature we can find other representation approaches
used in production (Al-Saleh, 2011), healthcare ser-
vices (Lopetegui et al., 2014), process of physical
workers (Magu et al., 2015), and to some extent, in
managerial work (Tengblad, 2002). However, differ-
ent from these approaches, our method is more flex-
ible to be adapted in different scenarios. In addition,
the proposed representation model in Figure 2 is suit-
able to use in action sequence matching in Section 4.
4 MANAGER MATCHING
In this section, we propose an efficient matching al-
gorithm to find partially similar parts among action
sequences from different team managers. Moreover,
it is important to provide a reasonable similarity mea-
sure for tasks such as manager comparison and re-
trieval, etc. Therefore, a manager similarity method
is introduced in the second part of this section.
4.1 Partial Matching
In order to find a partial match between two given
managers Ω
1
and Ω
2
, their corresponding action se-
quences S
1
and S
2
are compared. As introduced
in Section 3.2, each action a
a
a is described by a T -
dimensional feature vector. Therefore, the action se-
quences S
1
and S
2
can be represented by feature ma-
trices with size M × T and N ×T , respectively. M and
N are the number of actions. For notational simplicity
we assume that M 6 N.
Figure 3: An illustration of the general idea of partial
matching. B
1
and B
2
are two r × T sized action blocks se-
lected from the action sequences S
1
and S
2
, respectively.
D(s,m, r) denotes the dissimilarity between B
1
and B
2
.
The aim of manager matching is to identify parts
of the two action sequences that are similar to each
other. In terms of comparing the two descriptor ma-
trices, as shown in Figure 3, it equals to find r × T
sized feature blocks B
1
and B
2
, starting at the action
a
a
a
1s
in S
1
and a
a
a
2m
in S
2
which yield a small dissimi-
larity value d(B
1
,B
2
). r is the number of actions in
the matching blocks B
1
and B
2
. s and m denote the
index of start actions in S
1
and S
2
, respectively. As il-
lustrated in Eq. 4, each manager Ω can be represented
by H feature groups. Since B
1
and B
2
have the same
dimensional features and feature groups as Ω, they
can also be represented by:
B
1
= {G
G
G
0
11
,·· · ,G
G
G
0
1u
,·· · ,G
G
G
0
1H
}
B
2
= {G
G
G
0
21
,·· · ,G
G
G
0
2u
,·· · ,G
G
G
0
2H
}
(5)
Action Sequence Matching of Team Managers
389

where G
G
G
0
1u
and G
G
G
0
2u
are the r × ( j − t + 1) feature
group matrices, u = 1, · · · , H. This is because a fea-
ture group G
G
G
0
contains r number of actions. More-
over, as shown in Eq. 4 and Figure 2, the feature num-
ber in a feature group is indicated by ( j − t + 1).
Based on Eq. 5, in this article, d(B
1
,B
2
)
is calculated by the integrated Bhattacharyya dis-
tance (Dubuisson, 2010) from H feature groups:
d(B
1
,B
2
) =
1
H
H
∑
u=1
τ
u
D
B
(G
G
G
0
1u
,G
G
G
0
2u
) (6)
where τ is the weight for fusing H feature groups
and D
B
(G
G
G
0
1u
,G
G
G
0
2u
) denotes the Bhattacharyya distance
between two feature groups. In practice, τ can be
searched using the heuristic method of Gradient Hill
Climbing integrated with Simulated Annealing (Yang
et al., 2015). Otherwise, it can be set to one for all
feature groups. Specifically, the Gradient Hill Climb-
ing (Russell and Norvig, 2009) method starts with
randomly selected parameters. Then it changes sin-
gle parameters iteratively to find a better set of pa-
rameters. A fitness function then evaluates whether
the new set of parameters performs better or worse.
The Simulated Annealing strategy (Kirkpatrick et al.,
1983) impacts the degree of the changes. In later it-
erations, the changes to the parameters are becoming
smaller. Consequently, with a small part of testing
data in the preliminary experiments, τ
1
,·· · ,τ
H
can be
properly assigned.
Furthermore, the Bhattacharyya distance
D
B
(G
G
G
0
1u
,G
G
G
0
2u
) is calculated by:
D
B
(G
G
G
0
1u
,G
G
G
0
2u
) =
1
4
ln(
1
4
(
σ
2
1u
σ
2
2u
+
σ
2
2u
σ
2
1u
+ 2)) +
1
4
(
(µ
1u
− µ
2u
)
2
σ
2
1u
+ σ
2
2u
) (7)
where σ and µ are the variance and mean of a features
within a group G
G
G
0
, respectively. With Eq. 7, the Bhat-
tacharyya distance among all feature groups can be
calculated and then the global dissimilarity d(B
1
,B
2
)
between two feature blocks B
1
and B
2
is generated
using Eq. 6.
As introduced above, d(B
1
,B
2
) is built on the
combination {s, m, r}: Start action in S
1
(that is s),
start action in S
2
(that is m) and action number in a
matching block B (that is r). Therefore, to find similar
blocks among S
1
and S
2
all different matching pos-
sibilities and chain lengths r have to be considered
and the brute-force method (Bellman, 1954) becomes
inefficient for larger number of actions. Therefore,
different authors as e.g. (Osada et al., 2002) proposed
approximations where for example only every n-th ac-
tion is considered as the starting action.
Inspired by (Donoser et al., 2009), we propose an
algorithmic optimisation to overcome the limitations
of the brute-force approach (Osada et al., 2002). The
proposed method is based on a modified Summed-
Area-Table (SAT) approach (Hensley et al., 2005) to
calculate all the dissimilarity values d(B
1
,B
2
) among
different combinations of {s, m, r}. The SAT concept
was originally proposed for texture mapping (Crow,
1984) and then brought back to the community of
computer vision by Viola et al. (Viola and Jones,
2001) as integral image. The integral image concept
allows to calculate rectangle image features like the
sum of all pixel values for any scale and any loca-
tion in constant time (Donoser et al., 2009). How-
ever, different from the method (Donoser et al., 2009)
in which N integral images are generated for triples
{s,m,r} searching, the proposed method only uses M
integral images to speed up the matching process.
Particularly, in order to calculate the dissimilarity
value d(B
1
,B
2
) for all possible configuration triplets
{s,m,r} in the most efficient way, M integral images
Int
1
,·· · ,Int
r
,·· · ,Int
M
are built based on Eq. 6 for the
block length r from 1 to M. In such a case, each inte-
gral image Int
r
is the (M − r) × (N − r) matrix. The
main reason is that we need to consider all possible
matches from action blocks in S
1
and action blocks in
S
2
. Based on these M integral images the dissimilar-
ity values d(B
1
,B
2
) can be calculated for every block
of any length starting at any action in constant time.
Finally, all matching triples {s, m, r} which pro-
vide a dissimilarity value d(B
1
,B
2
) below a fixed
threshold are returned as the final matched parts
among two action sequences S
1
and S
2
. As discussed
in (Donoser et al., 2009), the detected matches may
overlap. Therefore, the final result is obtained by
merging the different returned matches.
4.2 Manager Similarity
To calculate the global similarity between two man-
agers Ω
1
and Ω
2
, a combination of descriptor differ-
ence (Yang et al., 2014) and the bending energy of
an estimated transformation (Torsello and Hancock,
2004) is commonly used. However, these methods
normally only focus on the coarse-grained differences
among action sequences S
1
and S
2
and the property of
fine-grained similar and dissimilar blocks are not fully
used. Moreover, in Section 4.1 we already collect the
partial dissimilarities with all possible block lengths.
With this in mind, we adapt a measure described by
Bronstein et al. (Bronstein et al., 2009) and Donoser
et al. (Donoser et al., 2009) to calculate the global
similarity between managers.
Specifically, we use a Pareto-framework for quan-
titative interpretation of partial similarity. In or-
der to do so, two quantities are defined: partial-
ity λ(B
1
,B
2
), which describes the block lengths (the
ICPRAM 2017 - 6th International Conference on Pattern Recognition Applications and Methods
390
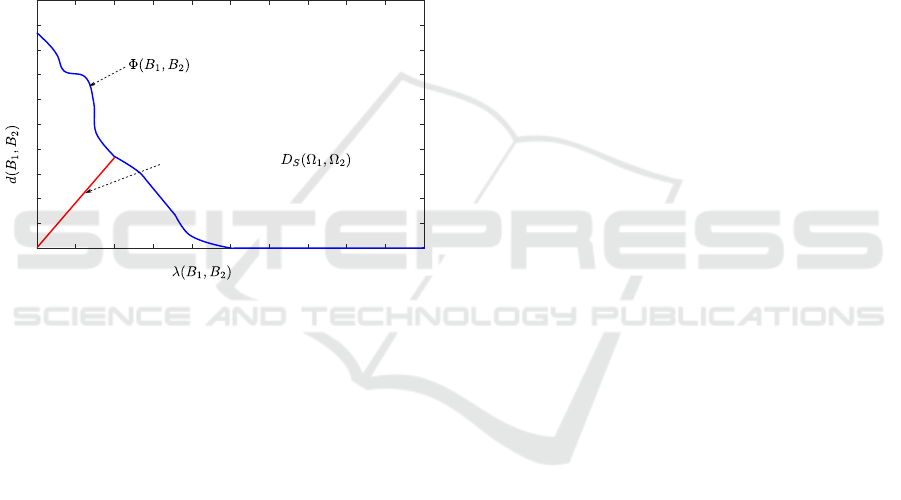
higher the value, the smaller the part) and dissimi-
larity d(B
1
,B
2
), which measures the dissimilarity be-
tween the blocks, where B
1
and B
2
are two action se-
quence blocks. In this paper, partiality λ(B
1
,B
2
) is
calculated by 1/r, where r is the block length ( Sec-
tion 4.1). Here we describe a pair of partiality and
dissimilarity values (λ(B
1
,B
2
),d(B
1
,B
2
)) as Pareto
optimum Φ(B
1
,B
2
) (Donoser et al., 2009), that is
Φ(B
1
,B
2
) = (λ(B
1
,B
2
),d(B
1
,B
2
)). With Φ(B
1
,B
2
),
it is possible for us to observe the lowest dissimi-
larity for the given partiality. As described in Sec-
tion 4.1, the proposed partial matching algorithm au-
tomatically evaluates all possible matches for all pos-
sible block lengths, we can easily collect all Pareto
optimums Φ(B
1
,B
2
) by focusing on the minimum
dissimilarity values in M integral images.
0 0.1 0.2 0.3 0.4 0.5 0.6 0.7 0.8 0.9 1
0
0.1
0.2
0.3
0.4
0.5
0.6
0.7
0.8
0.9
1
(Partiality)
(Dissimilarity)
Salukwadze Distance
Figure 4: The proposed approach for calculating similarity
between managers using the Salukwadze distance.
Finally, to get the global similarity D
S
(Ω
1
,Ω
2
) be-
tween mangers Ω
1
and Ω
2
, as shown in Figure 4, all
Pareto optimums are visualised as a curve, referred
to as the set-valued Pareto frontier and the so-called
Salukwadze distance (Bronstein et al., 2009) is em-
ployed based on the collected Pareto frontier by
D
S
(Ω
1
,Ω
2
) = inf
B
1
,B
2
|Φ(B
1
,B
2
)|
1
(8)
where | · · · |
1
is the L1-norm of the vector which con-
tains all pairs of partiality and dissimilarity. Conse-
quently, D
S
(Ω
1
,Ω
2
) measures the minimum distance
from the origin (0,0) to the point on the Pareto op-
timum. The Salukwadze distance is then returned as
the similarity value of managers Ω
1
and Ω
2
.
5 EXPERIMENT
In this section, we evaluate the performance of the
proposed manager matching method in an applica-
tion. In order to do so, we designed an on-line ex-
perimental tool, transistorshead.com, to collect man-
agerial actions from different managers. Then, based
on the proposed manager representation model in
Section 3.2, this platform represents each manage-
rial action by different action features within differ-
ent groups. Built on the represented manager, we ap-
ply the manager matching experiment and compare
the matching results to the ground truths. Finally,
the computational complexity of the proposed man-
ager representation and matching methods are anal-
ysed and discussed.
5.1 Experimental Environment
In this paper, we developed a special tool: transis-
torshead.com, to record and represent managerial ac-
tions. This tool was designed based on the main idea
in Section 3.1 and the following principles: (1) Ev-
ery on-line management tool tracks and records man-
agerial actions according to the idea of Unit of Be-
haviours (Curtis et al., 1992). (2) Using a manage-
ment tool by a team manager is equal to an event
occurring in an organisational environment which re-
sults in a thing (Flak, 2013). (3) Every on-line man-
agement tool is useful for describing managerial ac-
tions. With this tool, we record each managerial ac-
tion and describe it with a 24-dimensional feature vec-
tor. Those features are grouped into 7 feature groups.
It is interesting to point out that this tool can also be
extended to represent managerial actions by content
domain features. The detailed information is intro-
duced in (Alnajjar and Flak, 2016).
With this tool, we have collected and built our
dataset: PG-Manager. Specifically, in order to collect
the managerial actions, 150 volunteers had been in-
volved in our experiment over 15 months. The partic-
ipants worked in small groups from different regions.
Each group consists of a team manager and multi-
ple members. Consequently, PG-Manager contains
56 managers and each manager contains 200 to 400
managerial actions. As introduced above, each ac-
tion is represented by a 24-dimensional feature vector.
This dataset is used to evaluate the proposed manager
representation and matching methods in Section 5.2.
5.2 Manager Matching
In order to evaluate the proposed manager match-
ing algorithm, we perform the managerial action se-
quence matching experiments on the PG-Manager
dataset. Specifically, our evaluation is built on a re-
trieval framework where managers in the dataset are
ranked based on their similarity to a query. Based on
the ranked results and similarity values, we can dis-
tinguish different managers and also group them into
Action Sequence Matching of Team Managers
391
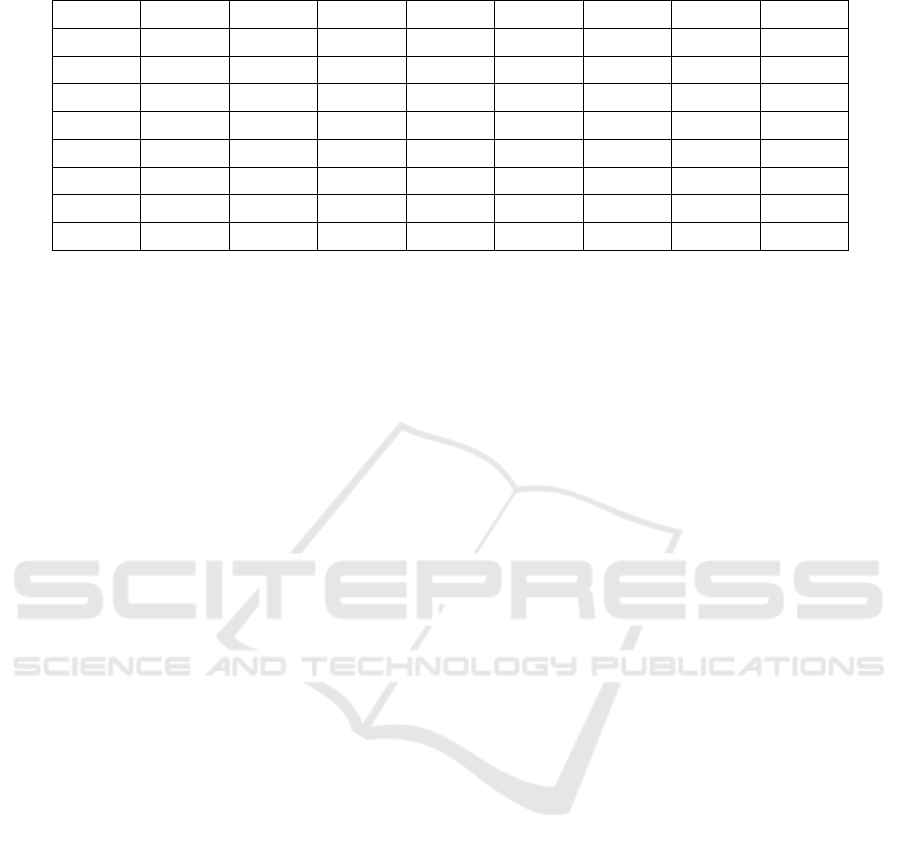
Table 1: Similarities between similar managers.
Manager1 Manager2 Manager3 Manager4 Manager5 Manager6 Manager7 Manager8
Manager1 1 0.9919 0.9932 0.9797 0.9878 0.9702 0.9925 0.9706
Manager2 0.9919 1 0.9869 0.9868 0.9946 0.9769 0.9940 0.9704
Manager3 0.9932 0.9869 1 0.9702 0.9871 0.9708 0.9866 0.9766
Manager4 0.9797 0.9868 0.9702 1 0.9821 0.9749 0.9896 0.9705
Manager5 0.9878 0.9946 0.9871 0.9821 1 0.9702 0.9906 0.9721
Manager6 0.9702 0.9769 0.9708 0.9749 0.9702 1 0.9701 0.9724
Manager7 0.9925 0.9940 0.9866 0.9896 0.9906 0.9701 1 0.9703
Manager8 0.9706 0.9704 0.9766 0.9705 0.9721 0.9724 0.9703 1
different classes.
Table 1 illustrates the similarities between 8 man-
agers. Those similarities are selected since they are
above the threshold σ = 0.97. Considering the ground
truth, these managers are similar to each other and
belong to the same group. Therefore, the proposed
method can correctly distinguish different managers.
Moreover, compared to the ground truth in which only
similar or dissimilar information is available, the pro-
posed method not only provides such information, but
also gives more accurate similarity scores. In such a
case, scientists and practitioners can apply a deeper
exploration in management science.
5.3 Computational Complexity
(1) For manager representation, the proposed method
in Section 3.2 generally includes two parts: manage-
rial actions and action features. For managerial ac-
tions, the time complexity is O(M) since a manager
Ω is composed by M actions. For a single action a
a
a,
since it can be represented by a T -dimensional fea-
ture vector, the time complexity is O(T ). Therefore,
the total complexity is O(MT ). Recalling that in prac-
tice there are many more managerial actions than the
number features (M >> T ), the total complexity for
manager representation is bounded by O(M). (2) For
manager matching, an exhaustive search over all pos-
sible matches for all possible block sizes has a com-
plexity of O(2
N
1
+N
2
), where N
1
and N
2
are the num-
ber of actions within the two input managers. Our
proposed approach based on integral image analysis
enables matching in O(N
1
N
2
) time. We implemented
our method in Matlab, which enables manager match-
ing on a Laptop within seconds.
6 CONCLUSION
In this paper, we propose a novel manager representa-
tion and matching algorithm based on managerial ac-
tions and their features. For manager representation,
we firstly represent a manager by a action sequences
collected by existing or the proposed tools. After that,
each action is described by multiple time domain fea-
tures within flexible feature groups. In such a case,
the proposed representation method is flexible and
general enough to cover most types of managers. For
manager matching, based on the action sequences of
managers, we first apply a partial matching method to
search the matched blocks within action sequences.
Then, the global similarities between managers are
calculated built on their matched sequence blocks. In
the future, we will extend our manager representation
method by adding more types of managerial action
and action features. In addition, we will try to imple-
ment the proposed algorithms for manager labelling
based on the deep learning approaches.
ACKNOWLEDGEMENTS
Research activities leading to this work have been
supported by the Chinese Scholarship Council (CSC)
and the German Research Foundation (DFG) within
the Research Training Group 1564 (GRK 1564). We
greatly thank Frederic Li from University of Siegen
for his significant help in our experiments.
REFERENCES
Abbott, A. (1990). A primer on sequence methods. Orga-
nization science, 1(4):375–392.
Al-Saleh, K. S. (2011). Productivity improvement of a mo-
tor vehicle inspection station using motion and time
study techniques. Journal of King Saud University-
Engineering Sciences, 23(1):33–41.
Alexandru, M. and Diana, M. (2015). Management skills
assessment using 360 feedback-msf 360. Procedia-
Social and Behavioral Sciences, 187:318–323.
Alnajjar, J. and Flak, O. (2016). Linguistic analysis of man-
ICPRAM 2017 - 6th International Conference on Pattern Recognition Applications and Methods
392

ager behaviour aimed at replacing human managers
with robots. In ECRMBMS, pages 1–8.
Barnes, R. (1980). Motion and Time Study; Design and
Measurement of Work. John Wiley, New York, USA,
8th edition.
Beaudry, P. and Francois, P. (2010). Managerial skills ac-
quisition and the theory of economic development.
The Review of Economic Studies, 77(1):90–126.
Bellman, R. (1954). The theory of dynamic program-
ming. Bulletin of the American Mathematical Society,
60(6):503–516.
Beshears, J. and Gino, F. (2015). Leaders as decision archi-
tects. Harvard Business Review, 93(5):52–62.
Brink, C. and Rewitzky, I. (2002). Three dual ontologies.
Journal of Philosophical Logic, 31(6):543–568.
Brinkerhoff, D. W. (1985). Managerial roles for social de-
velopment management. Public administration and
development, 5(2):145–156.
Brodie, M. B. (2007). Henri fayol: Administration indus-
trielle et generate - a re-interpretation. Public Admin-
istration, 40(3):311–317.
Bronstein, M., Bronstein, M., Bruckstein, M., and Kimmel,
R. (2009). Partial similarity of objects, or how to com-
pare a centaur to a horse. IJCV, 84:163–183.
Crow, F. C. (1984). Summed-area tables for texture map-
ping. ACM SIGGRAPH, 18(3):207–212.
Curtis, B., Kellner, M. I., and Over, J. (1992). Process mod-
eling. Communications of the ACM, 35(9):75–90.
Donoser, M., Riemenschneider, H., and Bischof, H. (2009).
Efficient partial shape matching of outer contours. In
ACCV, pages 281–292.
Dubuisson, S. (2010). The computation of the bhat-
tacharyya distance between histograms without his-
tograms. In ICIPTTA, pages 373–378.
Flak, O. (2013). Concept of managerial tools based on the
system of organizational terms. In IMPE, pages 187–
197.
Flak, O. (2015). Theoretical foundation for managers
behavior analysis by graph-based pattern matching.
IJCM, 12(4):110–123.
Flak, O. and Pyszka, A. (2013). Differences in perception
of the participants in the management process and its
real trajectory. JEMI, (4):35–72.
Halliday, R. M. and Stacey, M. J. (2009). Observation: The
lost and found managerial skill. In Northeast Decision
Sciences Institute Proceedings, pages 380–385.
Hensley, J., Scheuermann, T., Coombe, G., Singh, M., and
Lastra, A. (2005). Fast summed-area table generation
and its applications. In Computer Graphics Forum,
volume 24, pages 547–555.
Hoegl, M. and Parboteeah, K. P. (2007). Creativity in
innovative projects: How teamwork matters. Jour-
nal of Engineering and Technology Management,
24(1):148–166.
Karsten, L. (1996). Writing and the advent of scientific
management: the case of time and motion studies.
Scandinavian Journal of Management, 12(1):41–55.
Katz, R. L. (1974). Skills of an effective administrator. Har-
vard Business Review, 52(5):90–102.
Kirkpatrick, S., Gelatt, C. D., and Vecchi, M. P. (1983).
Optimization by simulated annealing. Science, pages
671–680.
Koontz, H. and O’Donneil, C. (1964). Principles of Man-
agement, page 45. McGraw-Hill., New York.
Lopetegui, M., Yen, P.-Y., Lai, A., Jeffries, J., Embi, P., and
Payne, P. (2014). Time motion studies in healthcare:
What are we talking about? JBI, 49:292–299.
Magu, P., Khanna, K., and Seetharaman, P. (2015). Path
process chart-a technique for conducting time and mo-
tion study. Procedia Manufacturing, 3:6475–6482.
Mathieu, J., Maynard, M. T., Rapp, T., and Gilson, L.
(2008). Team effectiveness 1997-2007: A review of
recent advancements and a glimpse into the future.
Journal of management, 34(3):410–476.
Mintzberg, H. (1973). The nature of managerial work.
Harpercollins College Div, New York: Harper & Row.
Mithas, S., Krishnan, M. S., and Fornell, C. (2005). Why do
customer relationship management applications affect
customer satisfaction? JK, 69(4):201–209.
Osada, R., Funkhouser, T., Chazelle, B., and Dobkin, D.
(2002). Shape distributions. ACM Transactions on
Graphics, 21(4):807–832.
Pavett, C. M. and Lau, A. W. (1982). Management roles,
skills, and effective performance. In Academy of Man-
agement Proceedings, pages 95–99.
Perlow, L. (2014). Manage your team’s collective time.
Harvard business review, 92(6):23–25.
Russell, S. and Norvig, P. (2009). Artificial Intelligence: A
Modern Approach. Prentice Hall Press, 3rd edition.
Shakshuki, E., Ghenniwa, H., and Kamel, M. (2003).
An architecture for cooperative information systems.
Knowledge-Based Systems, 16(1):17–27.
Siedlok, F. and Hibbert, P. (2014). The organization of in-
terdisciplinary research: Modes, drivers and barriers.
IJMR, 16:194210.
Sinar, E. and Paese, M. (2016). The new leader profile.
Training Magazine, (46):46–50.
Sohmen, V. S. (2013). Leadership and teamwork: Two sides
of the same coin. Journal of Information Technology
and Economic Development, 4(2):1.
Spriegel, W. R., Myers, C. E., Gilbreth, F. B., and Gilbreth,
L. M. (1953). The writings of the Gilbreths. RD Irwin.
Tengblad, S. (2002). Time and space in managerial work.
SJM, 18(4):543–565.
Torsello, A. and Hancock, E. R. (2004). A skeletal measure
of 2d shape similarity. CVIU, 95(1):1–29.
Viola, P. and Jones, M. (2001). Rapid object detection using
a boosted cascade of simple features. In CVPR, pages
511–518.
Whetten, D. and Cameron, K. (2016). Developing manage-
ment skills. Prentice-Hall Project.
Yang, C., Tiebe, O., Grzegorzek, M., and Indurkhya, B.
(2016). Investigations on skeleton completeness for
skeleton-based shape matching. In SPA 2016. IEEE
Signal Processing Society.
Yang, C., Tiebe, O., Pietsch, P., Feinen, C., Kelter, U., and
Grzegorzek, M. (2014). Shape-based object retrieval
by contour segment matching. In ICIP, pages 2202–
2206.
Yang, C., Tiebe, O., Pietsch, P., Feinen, C., Kelter, U., and
Grzegorzek, M. (2015). Shape-based object retrieval
and classification with supervised optimisation. In
ICPRAM, pages 204–211.
Action Sequence Matching of Team Managers
393
