
A Statistical Approach to Resolve Conflicting Requirements in
Pervasive Computing Systems
Osama M. Khaled, Hoda M. Hosny and Mohamed Shalan
Computer Science and Engineering Department, The American University in Cairo, Egypt
Keywords: Pervasive Computing, Ubiquitous Computing, Requirements Engineering, Software Engineering,
Requirements Conflict Resolution.
Abstract: Pervasive computing systems are complex and challenging. In this research, our aim is to build a robust
reference architecture for pervasive computing derived from real business needs and based on process re-
engineering practices. We derived requirements from different sources grouped by selected quality features
and worked on refining them by identifying the conflicts among these requirements, and by introducing
solutions for them. We checked the consistency of these solutions across all the requirements. We built a
mathematical model that describes the degrees of consistency with the requirements model and showed that
they are normally distributed within that scope.
1 INTRODUCTION
Requirements Engineering (RE) is the first step in
the Software Development Life Cycle (SDLC). It is
a corner stone for the success of any project, as IBM
says (Chakraborty, 2012). It is not a documentation
phase for gathered requirements. It is the art of
eliciting, analysing, communicating and validating
requirements for changes to business processes,
policies and information systems (Computing and
Information Sciences, 2012).
After gathering the requirements, it becomes
critical to analyse and validate them. One of the
analysis approaches is to find relationships among
these requirements. The general purpose is to
realize if they all seek the same goal or not. It is
possible to discover conflicts among requirements
that may spoil the main goal of the system.
In this research work, our aim is to develop both
the business and technical reference architectures
that pave the road for concrete architectures for
pervasive systems. Hence, we elicited requirements
from different literature sources and domain experts,
and then analysed them to discover all possible
relationships among the individual requirements
(
Khaled, O. M., et al, 2016). The point that we address
in this research may best be stated in the form of a
question: “Is it statistically possible to evaluate
solutions for conflicting requirements that would
satisfy all the stakeholder needs?” Our ultimate goal
is to have a comprehensive requirements model for
pervasive systems with minimal conflicting
requirements.
The paper presents our research study as follows:
Section 2 presents the related work, Section 3
describes our methodology and approach, Section 4
gives a high level briefing about the gathered
requirements, Section 5 presents the captured
conflicts, Section 6 depicts our solution for all the
stated problems, Section 7 presents out statistical
evaluation of the solutions, section 8 gives a
discussion about the applicability of the research
outcomes, and we finally conclude the paper in
section 9.
2 RELATED WORK
Requirements engineering in pervasive computing
was studied intensively by many researchers.
Different techniques for eliciting requirements have
been introduced by a number of researchers.
Research efforts by (Kolos-Mazuryk, L., et al.,
2005) (Afridi, A. H. and Gul, S., 2008) (Muñoz, J.,
Pelechano, V., 2006) (Pérez, F. and Valderas, P.,
2009) are examples of such approaches.
Salado and Nilchiani (Salado, A. and Nilchiani,
R., 2014) focus their research work on conflict
Khaled, O., Hosny, H. and Shalan, M.
A Statistical Approach to Resolve Conflicting Requirements in Pervasive Computing Systems.
DOI: 10.5220/0006217600150026
In Proceedings of the 12th International Conference on Evaluation of Novel Approaches to Software Engineering (ENASE 2017), pages 15-26
ISBN: 978-989-758-250-9
Copyright © 2017 by SCITEPRESS – Science and Technology Publications, Lda. All rights reserved
15

identification among the requirements. They present
a “tension matrix” mechanism to organize a set of
heuristics that they proposed in order to identify
conflicts. Their approach to resolve a conflict is
simply done by removing the conflicting
requirement based on specific criteria.
Sadana and Liu (Sadana, V. and Liu, X. F.,
2007) have a similar approach that shows a
hierarchy of conflicts among requirements and plots
potential conflicts among quality attributes. They
augment functional and quality requirements to
identify conflicts.
Oster et al. (Oster, Z. J. et al., 2015) introduce an
analysis model to identify and resolve conflicts
using a conditional importance network (CI-Nets).
Stakeholder requirements are organized as
preferences that are valid if certain conditions are
satisfied. Preferences are checked for consistency
with no conflicts. If conflicts are detected, then the
least preferred item that causes conflict is removed
from the entire set of stakeholder preferences.
All the surveyed research efforts assert the need
for extensive research to properly elicit the
requirements and identify conflicts. However, they
suggest simple approaches to resolve conflicts
without going deeper to propose solutions that can
achieve an acceptable balance among conflicting
requirements. Researchers in (Sadana, V. and Liu,
X. F., 2007) trace back the conflicts to quality
attributes which is similar to what we do as will be
explained below.
There are numerous research efforts in
requirements engineering. However, there are
limited research studies that address conflict
identification and analysis. Few of these research
studies provide a framework for resolving
requirements conflicts. And to our best knowledge,
the resolution of conflicts in pervasive computing
using statistical analysis has not been attempted yet.
This will be very useful during the architecture
phase as some architecture decisions will be defined
more accurately for system optimization during
runtime. Hence, we offer a practical guidance to
the architects who work in the pervasive computing
domain.
3 METHODOLOGY
Pervasive computing is characterized as a paradigm
for context-aware and adaptable systems. It is a
distributed system that is highly interacting with the
surrounding environment (Coulouris , G., et al.,
2012). The users of the system could be in
continuous movement and hence they interact with
the system and the system reacts to their actions. In
other words, the system becomes part of the people’s
normal daily processes.
From this perspective, we decided to build the
reference architecture as if we want to re-engineer a
set of processes. In normal practices, people tend to
perform the process as designed, whether this
process describes industrial or business activities.
At some point in time, people may decide that the
process is no longer efficient and that it needs to be
revisited. So, they initiate a reengineering project
that aims to study the process and recommend
solutions.
In process re-engineering, there are 3 major
objectives that the engineer must achieve (Liu, J. et
al., 2014):
a) Maximize the value added tasks that the
customer is willing to pay for.
b) Minimize the non-value added tasks which are
essential for the process but the customer is
unwilling to pay for.
c) Eliminate tasks that are considered a clear
waste.
Similarly, we defined three relationships that
could link two pieces of requirements based on their
valued outcomes:
a) Minimize: is a relationship that shows that one
requirement works on minimizing a non-
desired value from another piece of
requirement.
b) Maximize: is a relationship that shows that one
requirement works on maximizing a desired
value from another piece of requirement.
c) Conflict: is the resulting relationship when
two requirements have conflicting values. One
of them must supersede the other in order to
resolve this conflict.
Our approach is quite similar to what we found
in the literature where one requirement could have
“positive correlation”, “negative correlation”, or
conflict with another requirement (Salado, A. and
Nilchiani, R., 2016). However, the use of a different
set of terms simplifies our analysis.
We worked on refining the requirements model
through a workshop with experts from the software
industry with whom we discussed these
requirements. We then started to study the trade-off
between the quality features and we generated a
weight for every quality feature. After that we
invited some other experts, 17 experts, to assess the
importance of the requirements in order to generate
weights for the quality features and compare them to
our mathematically calculated weights.
We identified conflicts, which we defined as
problems and resolved them either by introducing
new functional or architectural requirements, that we
ENASE 2017 - 12th International Conference on Evaluation of Novel Approaches to Software Engineering
16

called solutions, or by accepting to resolve for one
of the conflicting requirements (Table 5). We
evaluated solutions statistically against all the
requirements to identify minimize, maximize, and
conflict relationships. After that we gave a score for
every solution using a scoring equation. Finally, we
evaluated the results statistically to ensure their
applicability.
4 BUSINESS REQUIREMENTS
There are specific quality features that were
observed as the most prevalent in pervasive systems
(Spinola, R., and Travassos, G., 2012) (Yang, H. and
Helal, A., 2008) as will be explained below. We
researched these quality features, which counted 11,
to understand the core requirements that enable
them. We then refined these requirements with
international technical experts (
Khaled, O. M., et al,
2016
). The following is a high level summary of
these requirements:
a) Adaptable Behaviour (AB): It characterizes the
system that responds dynamically to changes
in the environment (Dobson, S., et al., 2010).
In order to fulfil this feature, the system is
required to 1) evaluate/improve adaptive
actions (actions taken in response for the
context change), 2) have smart decision
rules, 3) notify users with changes, and 4)
possess actuation capabilities.
b) Context Sensitivity (CS): it is the ability of the
system to sense the surrounding environment
and retrieve data from it (Coulouris , G., et al.,
2012). In order to fulfil this feature, the
system is required to 5) have sensors, 6) locate
interacting objects, 7) provide analytical
capability, 8) provide interpretation rules, and
9) record the object’s lifetime.
c) Experience Capture (EC): it is the ability of
the system to register experience for future use
(Spinola, R., and Travassos, G., 2012)
(Internet, 2011) (
Viana, et al., 2014). In order to
fulfil this feature, the system is required to 10)
capture Knowledge about users, 11) correlate
information and knowledge, and 12)
capture/change behavioural patterns.
d) Fault Tolerance (FT): it is the ability of the
system to detect errors and recover from them
(
Khaled, et al., 2015) (Sommerville, I, 2011). In
order to fulfil this feature, the system is
required to 13) detect faults quickly, 14)
minimize faults, 15) minimize the probability
of a device going offline, 16) reduce error
consequences, 17) display a proper error
message, and 18) take the proper corrective
action.
e) Heterogeneity of Devices (HD): it is the ability
of the system to incorporate different device
technologies seamlessly (Purao, S. et al., 2007)
(Nosrati, M. et al., 2012). In order to fulfil this
feature, the system is required to 18) maximize
the number of device technologies, 19) provide
a unique identifier for every object, and 20)
render content on a maximum number of
devices.
f) Invisibility (IN): it is the ability of the system
to integrate computers with minimum
awareness of them (
Viana, et al., 2014). In order
to fulfil this feature, the system is required to
21) minimize unneeded interactions, 22)
remove unnecessary motions, 23) conceal the
system devices and 24) minimize the use of
explicit input.
g) Privacy and Trust (PT): it is the characteristic
that the system is able to protect confidential
information (Joinson, Adam N. et al., 2010)
(Kostakos, V., et al., 2006). In order to fulfil
this feature, the system is required to 25)
certify trusted entities, 26) classify
Information, 27) reveal Information
controllably, and 28) track Information.
h) Quality of Service (QoS): it is the ability of the
system to set expectations for its services by
adding constraining boundaries on its services
(Coulouris , G., et al., 2012) (Wang, X. et al.,
2015). In order to fulfil this feature, the
system is required to 29) declare
service/quality feature boundaries, 30)
minimize average processing time, 31) monitor
and improve QoS boundaries, and 32) specify
hard/soft deadlines.
i) Safety (SY): it is the ability of the system to
protect its hardware from damage and provide
safety procedures for its interacting users
(Yang, H. and Helal, A., 2008) (Khaled, et al.,
2015). In order to fulfil this feature, the
system is required to 33) alert the user if safety
is about to be/or is compromised, 34) allow the
user to override/cancel system decisions, 35)
avoid conflicting side effects (e.g.
contradicting actions), 36) avoid invalid
operational directives (e.g. wrong directives set
by the users that may cause safety hazards to
people and devices), 37) ensure that generated
rules do not conflict with the system’s policy,
38) minimize conflicting usage of shared
resources, 39) override system rules by the
regulator (an authorized entity to set/change
the rules of the system), 40) provide maximum
protection (protect the interacting users and
devices from injury and damage) for the
A Statistical Approach to Resolve Conflicting Requirements in Pervasive Computing Systems
17

environment, 41) resolve conflicts among
objects by an administrator, and 42) respect
societal ethics.
j) Security (ST): it is the ability of the system to
secure its data and components from threats
(Coulouris , G., et al., 2012) (Ray, A. and
Cleaveland, R., 2014) (Internet, 2011) (Addo,
Ivor D., et al., 2014). In order to fulfil this
feature, the system is required to 43) disallow
anonymous usage of system, 44) enforce
Security rules on all objects, 45) ensure secure
data transmission, 46) maintain data integrity,
47) prevent data leakage, 48) provide data
access rules, 49) take counter-measures to
mitigate security threats, and 50) announce
malfunctioning smart objects.
k) Service Omnipresence (SO): is the ability of
the system to give the perception for the users
that they carry out computing services
whenever they move (Addo, Ivor D., et al.,
2014). In order to fulfil this feature, the
system is required to 51) distribute computing
power, 52) enrich the experience of the highly
used scenarios, 53) provide Informative
messages, 54) use a unique user identifier and
55) utilize the user’s cell phone.
5 REQUIREMENTS CONFLICT
IDENTIFICATION
We analyzed the aforementioned requirements and
identified all possible conflicts among the
requirements. We gave an ID for the conflict
between every pair of conflicting requirements as
shown in Table 1 where Req A and Req B columns
contain the IDs of the conflicting requirements.
Table 1: Conflicting Requirements.
Conf ID Req A Req B Conf ID Req A Req B
1 54 19 7 18 44
2 10 27 8 45 30
3 53 27 9 5 27
4 18 38 10 44 30
5 18 35 11 49 30
6 18 14 12 21 3
The process that we adopted to identify the
conflicts is:
1. Go over every requirement and check if its
value, which is identified as a quality feature,
conflicts with another requirement value.
2. If so, then mark both requirements as
conflicting.
3. Describe the type of conflict in details.
4. Study both of them critically to decide on
which one should supersede.
5. Give rationale for the decision.
We reviewed them critically and provided a
rationale for each decision conflict as follows:
a) Conflict #1: a user may have more than one
device joining the system, which may confuse
the system and lead it to make multiple
identifications for the same user.
b) Conflict #2: the system must not capture
personal knowledge if the user is not willing to
share it in order to have better control on
private information.
c) Conflict #3: informative messages may cause
leakage of private and confidential information
which is not filtered properly in all messages.
d) Conflict #4: the probability of generating
conflicts around shared resources may increase
due to expected incompatibility among
manufacturers.
e) Conflict #5: by introducing more device
technologies, the probability of generating
more side effects due to incompatibility among
manufacturers increases.
f) Conflict #6: The number of faults is expected
to increase by default whenever a new device
joins a pervasive system. The probability of
faults increases if the device technology is new
or has not been tested before.
g) Conflict #7: by introducing different types of
device technologies, the probability of
introducing security threats increases. For
example, a device may have an operating
system which is vulnerable to virus attacks.
h) Conflict #8: It is required to provide data
protection during transmission which increases
the processing overhead. The extra load can
slow down performance and may impact the
system’s overall availability.
i) Conflict #9: As a precaution, the system must
not collect unnecessary data through its
sensors, and also as a security rule, in order to
minimize the risk of revealing information to
unauthorized entities.
j) Conflict #10: security rules may add an
additional burden on the processing power of
the smart objects which may increase the
average processing time in general.
k) Conflict #11: counter-measures are very
expensive operations; they consume more
processing power which would not serve the
purpose of the system in the first degree. If the
system applied them, then the average
processing time for any service will be
decreased.
ENASE 2017 - 12th International Conference on Evaluation of Novel Approaches to Software Engineering
18
l) Conflict #12: notifying users with system
changes may lead to unnecessary interactions
with the system.
The above analysis shows that there are 16
requirements that have possible conflicts which
represent around 30% of the discovered
requirements. They are scattered across all the
quality features as shown in Table 2.
Table 2: Quality Features Conflicts.
Destination
Source
AB FT HD PT QoS SY ST Total
CS 1 1
EC 1 1
HD 1 2 1 4
IN 1 1
ST 3 3
SO 1 1 2
Grand Total 1 1 1 3 3 2 1 12
The 12 conflicts are shown among the quality
features according to the ownership of the
requirements. For example, the security feature
conflicts with quality of service 3 times. There are 3
requirements that belong to the security feature and
may reduce the quality of service’s average
processing capability. We also notice that Context
Sensitivity does not conflict with Adaptable
Behaviour nor Fault Tolerance. Another fact that we
can detect from this table is that the Device
Heterogeneity and Security features have the highest
percentage of conflict relationships.
6 CONFLICT RESOLUTION
The analysis of the requirements resulted in 20
maximize and 12 minimize relationships. We traced
them along with the 12 conflicts back to their quality
features in order to set relative weight for every
quality feature. We set a weight for every quality
feature simply by multiplying the number of
requirements (size), the covered quality features
(coupling), and relations of the requirements with
other requirements (coupling density) to get a
complexity score which is then divided by the total
score to get a relative normalized weight as shown in
Table 3. These weights were verified through a
subjective survey with experts who provided a score
for every requirement to determine its importance
(
Khaled, O. M., et al, 2016).
Interestingly, we found that the weights that we
calculated for the quality features lead to the same
conclusion that Spinola and Travassos (Spinola, R.,
and Travassos, G., 2012) arrived at using surveys
and workshops. For example, the Service
Omnipresence quality feature is ranked as one of the
top priority features while the Invisibility quality
feature is ranked as the lowest in priority (Table 3).
Table 3: Quality Features Relative Weight.
Feature weight Feature Weight Feature weight
SY 0.21 PT 0.061 ST 0.21
CS 0.057 SO 0.157 QoS 0.046
FT 0.1 AB 0.04 HD 0.0629
EC 0.04 IN 0.017
In another example, the safety feature has 10
requirements, and these requirements have 11
relations with other requirements that belong to 4
quality features. The score is (10 x 11 x 4) = 440.
We repeated this calculation with all other quality
features and we summed the total weight of the
model, which is 2100. The weight of the safety
feature (0.21) is the result of dividing 440 by 2100.
The calculations of the weights of the quality
features are explained fully in (
Khaled, O. M., et al,
2016).
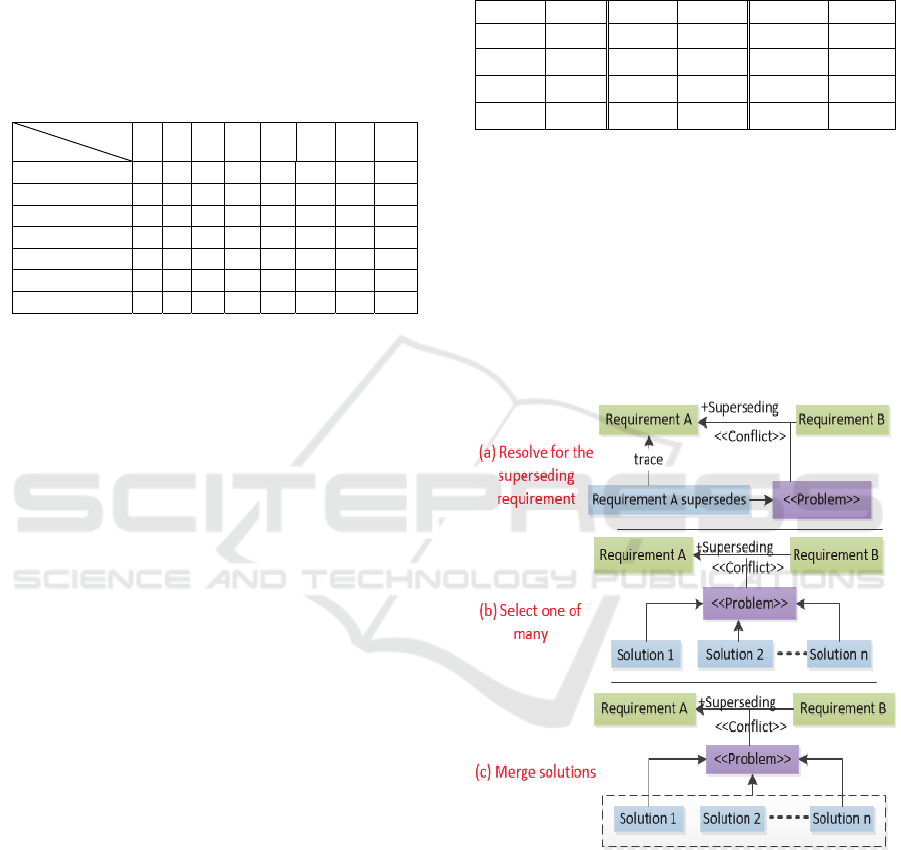
Figure 1: Conflict Resolution.
Conflicts among the requirements represent a
real challenge for architects who need to resolve
them in the best way. It is not sufficient to identify
the conflicting requirements, but we had to resolve
them satisfactorily as well. The ultimate resolution
if conflicts do occur, is to make one requirement
supersede the other within the conflict pair as shown
in Table 4.
A Statistical Approach to Resolve Conflicting Requirements in Pervasive Computing Systems
19
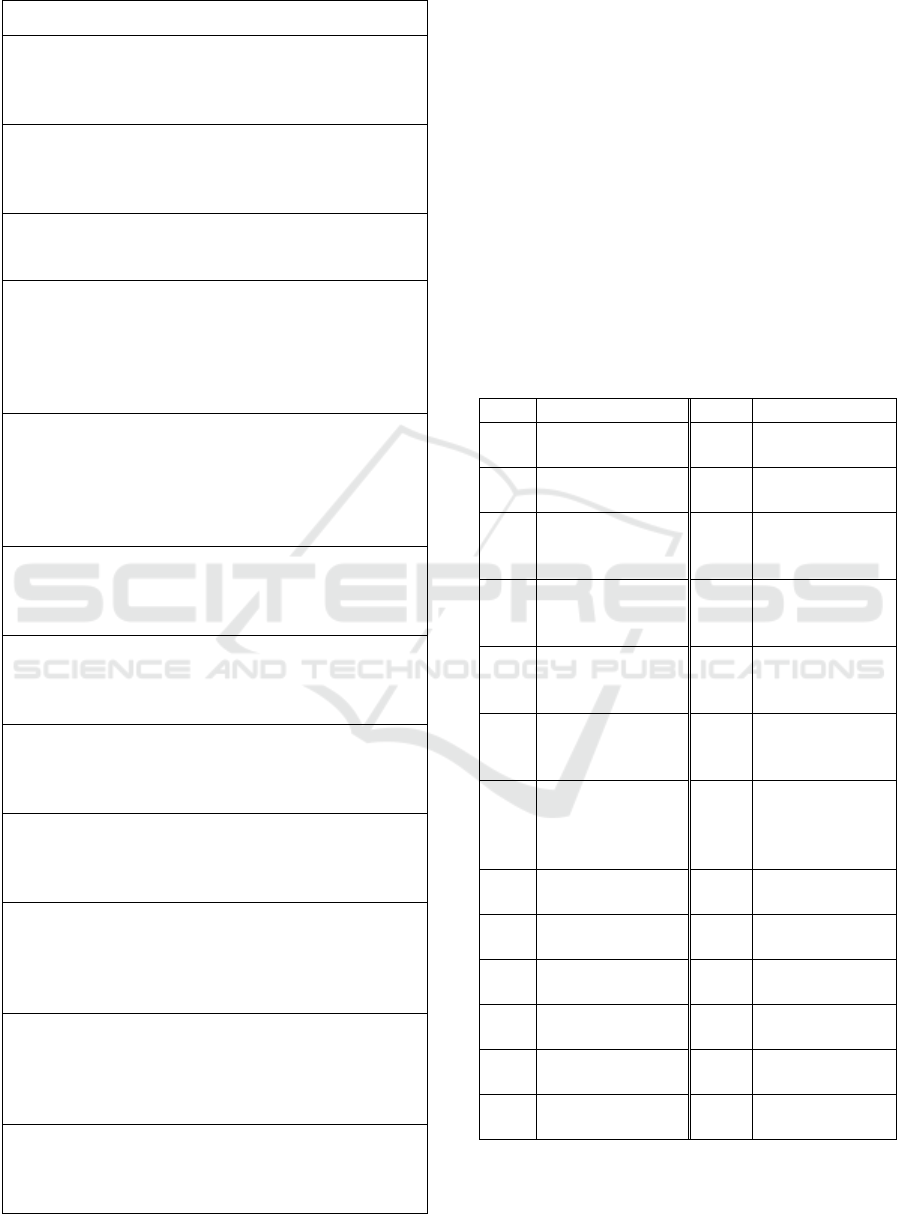
Table 4: Superseding Requirements.
Conflict Superseding Decision and Rationale
Conf #1: Requirement #54 supersedes #19 because having a
unique user identifier will ensure that different rules associated
with it are cascaded properly for devices associated with that
user.
Conf #2: Requirement #27 supersedes #10 because
information security is much more important as any drawback
may lead to information leakage. The risk is very high and it
will shadow the benefit of capturing personal knowledge.
Conf #3: Requirement #27 supersedes #53 because privacy of
the users is much more important than a message full of
information which may hinder their privacy.
Conf #4: Requirement #38 supersedes #18 because shared
resources that are crucial for the safety of the environment
should have the minimum number of conflicts. If there is a
new device technology that is not well known and may cause
troubles with shared resources, then the system should avoid
incorporating it.
Conf #5: Requirement #35 supersedes #18 because side effects
that risk the safety of the environment are very crucial and the
un-studied introduction of a new device technology is not
welcomed in this case. This is because the safety of humans,
living creatures or the environment itself may be
compromised.
Conf #6: Requirement #18 supersedes #14 because the benefit
of increasing device technologies will shadow the faults that
may appear in the environment since the system can handle
them in different ways.
Conf #7: Requirement #44 supersedes #18 because security
rules are more important for the sake of the whole
environment even if the number of device technologies does
not increase.
Conf #8: Requirement #45 supersedes #30 because if the
system accepts non-trusted objects to join in, then it will be
much better to secure transmitted data even if this will
increase the average processing capability.
Conf #9: Requirement #27 supersedes #5 because the risk of
not controlling information may lead to leakage of confidential
data. This risk is very high, which will shadow the benefit of
the sensors.
Conf #10: Requirement #44 supersedes #30 because security
rules are a must for the overall environment protection, The
wise decision in this case is to accept any additional increase
in the average processing time for the sake of the overall
environment’s health.
Conf #11: Requirement #49 supersedes #30 because security
threats may get the whole system down. A wise decision in
this case is to accept any additional increase in the average
processing time for the sake of the overall environment’s
health.
Conf #12: Requirement #3 supersedes #21 because notifying
the users with changes is important even if it will entail more
interactions with the system since awareness of changes is
critical for the overall safety of the environment.
However, eliminating one requirement for the
other does not satisfy the holistic vision of the
reference architecture. Accordingly, we decided to
provide solutions for these conflicts that can resolve
the problem. These solutions could be functional or
architectural and there could be different solutions
for the same problem, which is very healthy for
generating concrete architectures out of the
reference architecture and that will make them more
practical (Glaster, M. et al., 2011).
We reviewed all the conflicts, as explained in
section 3, and proposed alternative solutions that
could be applied. We also proposed to merge some
solutions to achieve a higher balance. In some other
conflicts, we proposed only a single solution or
decided to apply the superseding requirement
(Figure 1).
Table 5: Solutions List.
Sol ID Solution Sol ID Solution
SO-001
Associate device with
user SO-002
Authenticate every
time
SO-003
Delete unnecessary
sensor data SO-004
Disable sensors if
not needed
SO-005
Increase shared
resources SO-006
Mediate access
through a
middleware
SO-007
Authorize access upon
information request SO-008
Classify personal
information as a
setting
SO-009
Define information
access explicitly SO-010
Teach the system
(add to its knowledge
base)
SO-011
Declare security rules
for the devices willing
to join the system SO-012
Scan devices before
joining the system
SO-013
Apply less strict
security rules on the
private smart
environment SO-014
Apply less strict
security rules on
trusted objects
SO-015
Log all changes for
later access SO-016
Notify for important
changes only
SO-017
Transfer non-securely
if possible SO-018
Use a light-weight
encryption algorithm
SO-019
Use compatible
technologies SO-020
A positive merge of
solutions (7, 8, 9)
SO-021
A positive merge of
solutions (10, 19) SO-022
A positive merge of
solutions (11, 12)
SO-023
A positive merge of
solutions (13, 14) SO-024
A positive merge of
solutions (15, 16)
SO-025
A positive merge of
solutions (17, 18)
We also provide a detailed analysis for the
alternative solutions for every conflict. We analyzed
every solution against all other quality feature
ENASE 2017 - 12th International Conference on Evaluation of Novel Approaches to Software Engineering
20

requirements within the scope of the conflict,
maximize, and minimize relationships as discussed
earlier since this could be adopted as a cross-cutting
concern (Glaster, M. et al., 2011). In the merged
solution, the positive relationships (maximize or
minimize) shadow any conflict relationship found in
any other solution. In other words, it is assumed that
the merged solution will eliminate the negative
impact in one solution by using the positive
relationship in other solutions with the same feature,
if found. We then calculate a score for every
solution using the feature weight in Table 3. The
formula estimates the positive impact of the solution
given the negative impact and as expressed in
formula (1).
R
+
is the percentage of the minimize (
) and
maximize (
) relationships from all the
relationships of the solution with the other
requirements. R
-
is the percentage of the conflict
relationships (
) of the solution with the other
requirements. They are calculated using formulas
(2) and (3), respectively.
is the weighted average, an average
multiplied by its probability
(Moore, et al., 2009), of
the minimize and maximize relationships of the
solution with the requirements belonging to a single
feature multiplied by the weight of this feature
(
) in Table 3.
is the weighted
average of the number of conflict relationships of
the solution with the requirements belonging to a
single feature multiplied by the weight of the feature
(
) in Table 3. They are calculated using
formulas (4) and (5)
The rules we followed in order to devise the
formula was that:
1. The score formula must give a single number
derived from the number of positive
relationships as well as the number of negative
relationships with requirements.
2. The positive relationships increase the solution
score, while the negative relationships decrease
the solution score.
3. The score must be normalized in order to
analyze all the solutions for all the conflicts on
the same scale.
4. The weight of the solution should vary
according to the weights of the quality features
,which are normalized already, such that the
solution impacts their requirements.
The solution score tables in the sub-sections
below show only the number of relations for every
feature and then we apply the formula to give a
weighted score. We give a list of the proposed
solutions, shown in Table 5, and the way solutions
will be linked to conflicts is as explained above.
6.1 One Solution
We decided to resolve conflicts 3 and 11 for the
superseding requirement. The justification of our
decision is that the superseding requirements should
not be partially resolved since they may impact the
existence of the whole pervasive system. Conflict 6
is resolved using solution 21. It is clear that a score
in this scope is meaningless. However, it will be
shown that solution 21 is used to resolve other
conflicts in the coming sub-sections.
6.2 Alternative Solutions
Our approach for this analysis is to give a
description for every solution and then list the
number of relationships between every solution and
the requirements that belong to the quality feature as
shown in Table 6.
Table 6: Conflict 1 solutions score.
Solution SO-001 SO-002
Feature mi mx cf Total mi mx cf Total
SY 1 1
ST 1 1 3 3
SO 3 3 1 1
FT 2 2
HD 1 1 1 1
PT 2 2
CS 1 1
Q
oS 1 1 1 1
AB 1 1
EC 2 2
IN 2 2 2 2
Total 3 11 0 14 6 5 11
Score 1.1229 0.4499
∗
∗
(1)
∑
∑
(2)
∑
∑
(3)
∗
(4)
∗
(5)
A Statistical Approach to Resolve Conflicting Requirements in Pervasive Computing Systems
21
We then applied the score equation for every
solution. Conflict-1 solutions are described as
follows:
a) Solution SO-001 (Associate device with
user): The system should ask the user to
register his/her devices and associate them
with his/her unique identifier in the system.
This solution has a positive impact on 9
features and zero negative impact on all the
other features.
b) Solution SO-002 (Authenticate every time):
Authenticate the user every time he/she is
going to use the system. In this case, the
user does not have to bother about
registering his/her devices. The user just
needs to remember his/her credentials. This
solution has a positive impact on 4 features
and a negative impact on 3 other features.
We applied the same approach for conflicts 4
and 9 and that resulted in defining alternative
solutions as shown in Table 7.
Table 7: Alternative Solutions Conflict Matrix.
Conflict ID
Solution
1 4 9
SO-001 ●
SO-002 ●
SO-003 ●
SO-004 ●
SO-005 ●
SO-006 ●
SO-019 ●
6.3 Merged Alternative Solutions
We followed the same approach for defining
alternative solutions for the same conflict as shown
in section 6.2. However, we found that we can
provide a better solution if we merged the
alternatives after eliminating their negative impact.
A negative impact (conflict) is eliminated only if
there is one or more maximize or minimize
relationship provided from one solution that
shadows the conflict relationship from an alternative
solution.
The procedure that we adopted to decide if a
business requirement is satisfied by a merged
solution is as follows:
1. Build a matrix of the solutions as columns and
the requirements as rows.
2. Go over every piece of requirements and if there
are positive and negative relationships, then
ignore the negative relationship and inherit the
positive ones. Hence, the merged solution will
have a single positive relationship with that
requirement.
3. If all the relationships of the alternative
solutions are negative, then the merged solution
will have a single negative relationship with that
requirement.
4. We repeat this activity for all the requirements
that are impacted by the alternative solutions.
5. We ignore the requirements that are not
addressed by the alternative solutions.
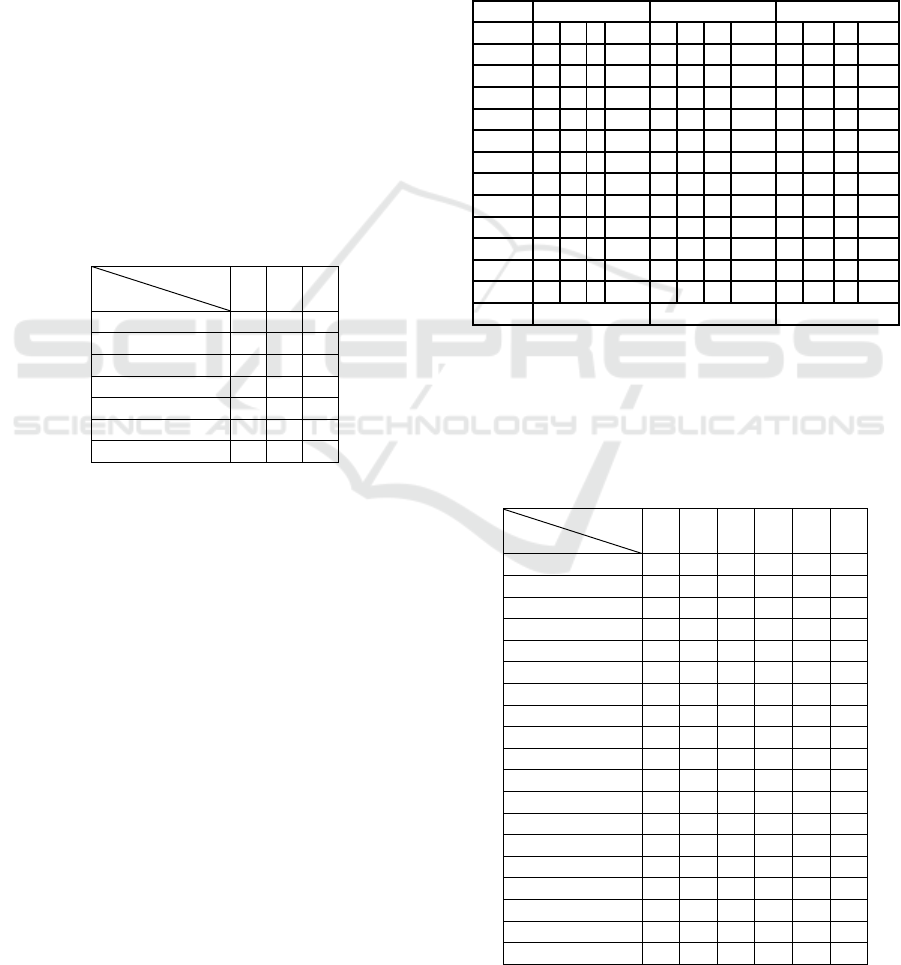
Table 8: Conflict 5 Merged Alternative Solutions.
Solution SO-010 SO-019 SO-021
Feature mi mx cf Total mi mx cf Total mi mx cf Total
SY 2 2 2 2 2 2
ST
SO 1 1 1 1 1 1
FT 2 2 1 1 2 2
HD 1 1 1 1 1 1
PT
CS 1 1 1 1
Q
oS
AB 1 1 1 1
EC
IN
Total 4 4 8 3 1 1 5 4 4 8
Score 0.9362 0.4341 0.9362
For example, solution SO-019 conflicts with one
requirement that belongs to the Service
Omnipresence quality feature, as shown in Table 8,
but it was eliminated in the merged solution SO-021
since solution SO-010 has a maximize relationship
Table 9: Merged Alternative Solutions Score Matrix.
Conflict ID
Solution
2 5 7 8 10 12
SO-007 ●
SO-008 ●
SO-009 ●
SO-010 ●
SO-011 ●
SO-012 ●
SO-013 ●
SO-014 ●
SO-015 ●
SO-016 ●
SO-017 ●
SO-018 ●
SO-019 ●
SO-020 ●
SO-021 ●
SO-022 ●
SO-023 ●
SO-024 ●
SO-025 ●
ENASE 2017 - 12th International Conference on Evaluation of Novel Approaches to Software Engineering
22
with one requirement that belongs to the same
quality feature. This approach is simply an indicator
for the architect to choose between alternatives or
merge these alternatives to produce a better solution.
Table 9 shows all the conflicts and the solutions
that make the required balance.
7 EVALUATION
We presented the alternative solutions in order to
reach a balance between the conflicting
requirements. These solutions are considered the
driver for the basic architecture’s building blocks.
One important point to note is that a solution that
has a lower score is not a bad solution. It means that
the solution, in general, has a lower positive impact
within the scope of the requirements model and the
weights of the quality features. If the weights of the
quality features are changed, the scores of the
solutions may change as well and the solution with
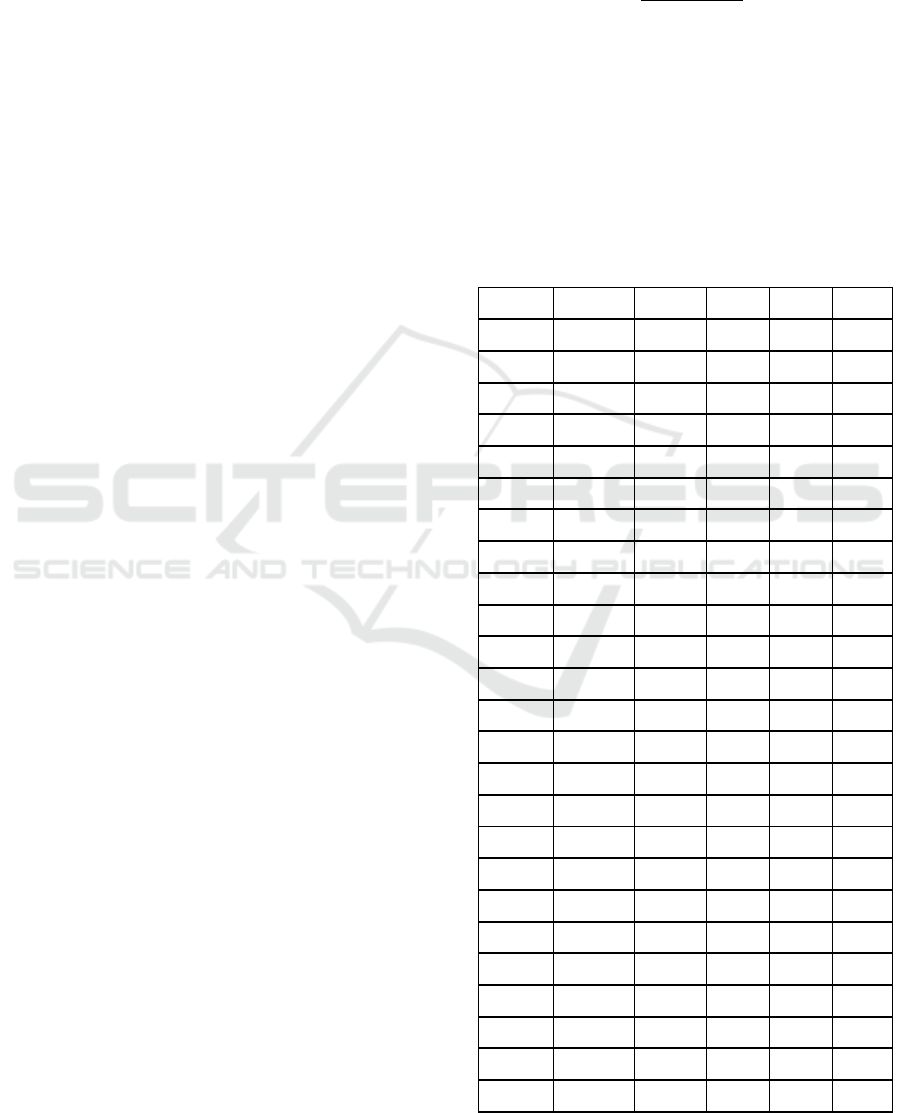
the lower positive impact may score higher. Table
10 shows the calculated scores of the solutions.
By analyzing the scores in Table 10 we find that
the highest score is 1.6550 for solution SO-020
(merged solution) for conflict 2 as shown in table 9
and the lowest score is -0.1218 for solution SO-004
(Disable sensors if not needed) for conflict 9 as
shown in Table 7. The mean of all the scores μ, is
0.6431 and the standard deviation σ, is 0.4805. So,
the solutions that have scores above the mean have a
higher positive impact and those that are below the
mean have a lower positive impact. It is important
to note that all the scores are on the same ratio scale
and we are able to calculate the central tendency of
these solutions as will be explained in the next
paragraph.
We tested the normality of the solution scores
according to (Moore, et al., 2009) and we found it
normal with a P-value of 0.536 and confidence level
95% (Figure 2). In the probability plot, if the P-
Value is greater than 0.5, then it is an indication that
the population is normally distributed. We can
conclude also from the distribution of the scores in
Table 10 that the presented solutions are capable of
resolving the conflicts as the model’s capability
index, (Cpk = 1.17), is greater than 1 (and the upper
bound is 2.23 and the lower bound is -0.8). Being
normally distributed gives an edge for the architects
to:
a) Simplify the decision for alternative solutions
by measuring them using our statistical model
as a reference.
b) Standardize the solution scores as z values and
use the standard z-table (Moore, et al., 2009).
Z values simplify the interpretation of the
scores as the z-value of zero or more has a
higher positive impact than the negative z-
values. Z-values could be obtained by using
equation (6) (Glaster, M. et al., 2011).
z
μ
σ
(6)
c) Allow the solutions to follow the system goal
which could be controlled by the weights of
the quality features.
The positive impact could be maximized if the
solutions with the higher positive scores are
selected. However, the other non-selected
solutions could still be good candidates in different
contexts where the quality features may have
different weights.
Table 10: Scores of the conflict solutions.
Sol
SO-001
1.123 0 1 0 1.123
SO-002
1.058 0.280 0.545 0.455 0.450
SO-003
0.563 0.330 0.636 0.364 0.238
SO-004
0.178 0.347 0.429 0.571 -0.122
SO-005
0.730 0 1 0 0.730
SO-006
0.742 0 1 0 0.742
SO-007
1.415 0.146 0.833 0.167 1.155
SO-008
0.674 0.310 0.818 0.182 0.495
SO-009
0.830 0.034 0.778 0.222 0.638
SO-010
0.936 0 1 0 0.936
SO-011
0.949 0 1 0 0.949
SO-012
1.210 0.046 0.875 0.125 1.054
SO-013
0.355 0.419 0.600 0.400 0.046
SO-014
0.355 0.210 0.750 0.250 0.214
SO-015
0.204 0 1 0 0.204
SO-016
0.118 0.210 0.750 0.250 0.036
SO-017
0.802 0.465 0.700 0.300 0.422
SO-018
0.820 0 1 0 0.820
SO-019
0.582 0.157 0.800 0.200 0.434
SO-020
1.753 0.017 0.944 0.056 1.655
SO-021
0.936 0 1 0 0.936
SO-022
1.577 0.046 0.900 0.100 1.415
SO-023
0.355 0.419 0.600 0.400 0.046
SO-024
0.265 0.210 0.857 0.143 0.197
SO-025
1.267 0 1 0 1.267
A Statistical Approach to Resolve Conflicting Requirements in Pervasive Computing Systems
23

Figure 2: Probability Plot of conflict solutions’ scores.
8 DISCUSSION
The statistical model could be used as an input for
Product Line Architecture tools to produce pervasive
computing architectures. The components could be
added to the architecture based on their weights.
The weights will be changed according to the
weights of the quality features that the architect will
select. If the system has relative weights for the
quality features, then it is expected to perceive the
aforementioned solutions having different weights as
well. Similar approaches are applied successfully in
product-line architectures as stated in (Losavio and
Ordaz, 2015) and (Murwantara, 2012).
Moreover, if we embed these solutions as plug
and play and allow the system to change the weights
of the quality features dynamically at run time to suit
specific contexts, the system may adopt a different
solution. The system may choose to adopt one or
more solutions or even neglect them and adapt itself
to the superseding requirement. Additionally, the
architect should further study the rippled effect of
the solution variations on the different architecture
components (Oliveira and Allian, 2015).
The architect may decide to favour one solution
over another based on evidence about his/her choice.
The heuristic approach that we presented gives a
reasonable decision mechanism especially when it is
not possible to gather all stakeholders or when a fast
decision is required with higher confidence. This
approach can be scaled over any number of
requirements.
On the other hand, a simple binary (Boolean)
approach to rank the solutions against the quality
features based on their positive and negative impact
may be used within a limited scope by the architect
to make a quick evaluation. The problem with that
model is that it is too simple to use with the Product
Line Architecture and the dynamic adaptability of
the system during runtime, as the probability of
errors would be higher. Accordingly, our model is
more accurate because it starts the analysis from the
requirements level which reduces the subjectivity of
the decisions because the selected requirements are
proven to be a representative sample of the
population of the requirements in the selected
quality features.
9 CONCLUSION
In this paper we presented a summary of our
research work on the resolution of conflicts between
requirements when building a business reference
architecture for pervasive computing systems. We
identified the conflicting requirements as pairs,
explained how to resolve a conflict by either making
one requirement supersede the other or by
introducing solutions that can satisfy the needs of
the requirements in a balanced way. We evaluated
the accuracy of the approach using statistical
analysis and proved that the statistical model is
normally distributed within the scope of the
requirements
This work is a practical guide for architects who
are willing to produce systems characterized as
pervasive, ubiquitous, or Internet of Things (IoT).
The approach can be applied in general to solutions
in other domains.
The list of requirements and solutions are not
thorough. They represent the essential capabilities
that enable the selected quality features. This is
what a “reference architecture” entails; it provides
guidance to only start a concrete architecture which
may include other requirements and solutions.
We have a broad vision for pervasive computing
reference architectures where the requirements
model is an integral part of its success. The latter is
the main driver for the technical architecture. It will
be used as well to evaluate the technical model and
ensure that it satisfies all the business requirements.
ACKNOWLEDGMENT
We would like to thank the following experts for
their help and support in this research work: Ahmed
2.52.01. 51. 00.50.0-0.5-1.0
99
95
90
80
70
60
50
40
30
20
10
5
1
Mean 0.6431
StDev 0.4805
N25
AD 0.308
P-Value 0.536
Score
Percent
Normal - 95% CI
Probability Plot of Solutions Scores
ENASE 2017 - 12th International Conference on Evaluation of Novel Approaches to Software Engineering
24

Ibrahim and Hassan Ali (IBM Egypt), Hany Ouda,
(Etisalat Egypt Telecommunications), and Mohamed
Hassan Abdelrahman (Vodafone Egypt
Telecommunications).
REFERENCES
Chakraborty, A. et al, 2012. The Role of Requirement
Engineering in Software Development Life Cycle. In
Journal of Emerging Trends in Computing and
Information Sciences. vol 3. 2012.
Computing and Information Sciences. vol 3. 2012.A Guide
to the Business Analysis Body of Knowledge, Release
1.6. International Institute of Business Analysis
(2006). http://www.theiiba.org
Khaled, O. M., et al, 2016. A Pervasive Computing
Business Reference Architecture: The Basic
Requirements Model, vol. 10, issue 1, pp. 17-46. In
International Journal of Software Engineering (IJSE).
Liu, J. et al., 2014. Research on the reengineering of
warehousing process based on Internet of Things.
Progress in Informatics and Computing (PIC), 2014
International Conference on, Shanghai, 2014, pp. 567-
571.
Salado, A. and Nilchiani, R., 2016. The Concept of Order
of Conflict in Requirements Engineering. in IEEE
Systems Journal, vol. 10, no. 1, pp. 25-35, March
2016.
Kolos-Mazuryk, L., et al., 2005. Requirements
Engineering for Pervasive Services. In Workshop on
Building Software for Pervasive Computing, OOPSLA
2005.
Afridi, A. H. and Gul, S., 2008. Method Assisted
Requirements Elicitation for Context Aware
Computing for the Field Force. Proceedings of the
International MultiConference of Engineers and
Computer Scientists 2008.
Muñoz, J., Pelechano, V., 2006. Building a Software
Factory for Pervasive Systems Development. 8th
International Conference on Enterprise Information
Systems (ICEIS 2006), Paphos (Cyprus) 23 - 27, May
2006. pags: 337.
Pérez, F. and Valderas, P., 2009. Allowing End-Users to
Actively Participate within the Elicitation of Pervasive
System Requirements through Immediate
Visualization. In Proceedings of the 2009 Fourth
International Workshop on Requirements Engineering
Visualization (REV '09). IEEE Computer Society,
Washington, DC, USA, 31-40.
Salado, A. and Nilchiani, R., 2014. The Tension Matrix
and the Concept of Elemental Decomposition:
Improving Identification of Conflicting Requirements.
in IEEE Systems Journal, vol.PP, no.99, pp.1-12
Sadana, V. and Liu, X. F., 2007. Analysis of Conflicts
among Non-Functional Requirements Using
Integrated Analysis of Functional and Non-Functional
Requirements. Computer Software and Applications
Conference, 2007. COMPSAC 2007. 31st Annual
International, Beijing, 2007, pp. 215-218.
Oster, Z. J. et al., 2015. Scalable modeling and analysis of
requirements preferences: A qualitative approach
using CI-Nets. 2015 IEEE 23rd International
Requirements Engineering Conference (RE), Ottawa,
ON, 2015, pp. 214-219.
Spinola, R., and Travassos, G., 2012. Towards a
framework to characterize ubiquitous software
projects. Information and Software Technology, v. 54,
2012, pp. 759-785.
Yang, H. and Helal, A., 2008. Safety Enhancing
Mechanisms for Pervasive Computing Systems in
Intelligent Environments. Sixth Annual IEEE
International Conference on Pervasive Computing and
Communications.
Dobson, S., et al., 2010. Fulfilling the Vision of
Autonomic Computing. In Computer, vol.43, no.1,
pp.35-41, Jan. 2010.
Coulouris, G., et al., 2012. Distributed Systems Concepts
and Design. Fifth Edition. Addison-Wesley Publishing
Company.
Internet of Things Architecture IoT-A Project Deliverable
D6.2 – Updated Requirements. http://www.iot-a.eu.
Date: January 31, 2011.
Viana, J. R. M., et al., 2014. A Systematic Review on
Software Engineering in Pervasive Games
Development. 2014 Brazilian Symposium on
Computer Games and Digital Entertainment, Porto
Alegre, 2014, pp. 51-60.
Khaled, Osama M. et al., 2015. On the Road to a
Reference Architecture for Pervasive Computing. In
the 5th International Joint Conference on Pervasive
and Embedded Computing and Communication
Systems, Feb 11-13, 2015, Angers, France.
Sommerville, I, 2011. Software Engineering. Ninth
Edition. Addison-Wesley Publishing Company.
Purao, S. et al., 2007. Understanding enterprise integration
project risks: A focus group study. Database and
Expert Systems Applications. DEXA ’07. 18th
International Conference on, pages 850–854, 3-7 Sept.
2007.
Nosrati, M. et al., 2012. Mobile Computing: Principles,
Devices and Operating Systems. World Applied
Programming, Vol (2), Issue (7), July 2012. 399-408.
Joinson, Adam N. et al., 2010. Privacy, Trust, and Self-
Disclosure Online. HUMAN–COMPUTER
INTERACTION, Volume 25, pp. 1–2.
Kostakos, V., et al., 2006. Designing Urban Pervasive
Systems. Computer, v.39 n.9, p.52-59, September
2006.
Wang, X. et al., 2015. Dynamic Low-Power
Reconfiguration of Real-Time Systems With Periodic
and Probabilistic Tasks. In IEEE Transactions on
Automation Science and Engineering, vol. 12, no. 1,
pp. 258-271, Jan. 2015.
Ray, A. and Cleaveland, R., 2014. An analysis method for
medical device security. In Proceedings of the 2014
Symposium and Bootcamp on the Science of Security
A Statistical Approach to Resolve Conflicting Requirements in Pervasive Computing Systems
25

(HotSoS '14). ACM, New York, NY, USA, Article 16,
2 pages.
Addo, Ivor D., et al., 2014. A Reference Architecture for
Improving Security and Privacy in Internet of Things
Applications. IEEE International Conference on
Mobile Services (MS), vol., no., pp.108,115, June 27
2014-July 2 2014.
Glaster, M. et al., 2011. Variability in software
architecture: current practice and challenges.
SIGSOFT Softw. Eng. Notes 36, 5 (September 2011),
30-32.
Moore, David S., et al., 2009. Introduction to the Practice
of Statistics. 6th Edition. W. H. Freeman and
Company, New York.
Losavio, F. and Ordaz, O, 2015. Quality-based heuristic
for optimal product derivation in Software Product
Lines. Internet Technologies and Applications (ITA),
Wrexham, 2015, pp. 125-131.
Murwantara, I. M., 2012. Hybrid ANP: Quality attributes
decision modeling of a product line architecture
design. Uncertainty Reasoning and Knowledge
Engineering (URKE), 2nd International Conference
on, Jalarta, 2012, pp. 30-34.
Oliveira, E. and Allian, A. P, 2015. Do reference
architectures can contribute to standardizing
variability management tools? 1st International
Workshop on Exploring Component-based
Techniques for Constructing Reference Architectures
(CobRA), Montreal, QC, 2015, pp. 1-4.
ENASE 2017 - 12th International Conference on Evaluation of Novel Approaches to Software Engineering
26
