
Correlation between Similarity and Variability Metrics in Search-based
Product Line Architecture: Experimental Study and Lessons Learned
Yenisei Delgado Verdecia and Thelma Elita Colanzi
Department of Informatics, State University of Maringa (UEM), Maringa, Parana, Brazil
Keywords:
Product Line Architecture, Correlated Metrics, Search-based Design, Evaluation Model.
Abstract:
The Product Line Architecture (PLA) plays a central role at the products development from a Software Prod-
uct Line (SPL). PLA design is a people-intensive and non-trivial task. So, PLA design can be considered a
hard problem which could be formulated as an optimization problem with many factors to be solved by search
algorithms. In this sense, the approach named MOA4PLA (Multi-Objective Approach for Product-Line Archi-
tecture Design) was proposed to automatically identify the best alternatives for a PLA design. This approach
originally included metrics to evaluate basic design principles, feature modularization, design elegance and
SPL extensibility. However, there are other relevant properties for PLA design. For this reason, the evaluation
model of MOA4PLA was extended with metrics to measure the level of similarity and adaptability of the PLA.
The objective of this work is to investigate the possible correlation between the metrics related to similarity
and variability in order to decrease the number of functions to be optimized. To do this, three experiments were
carried out. Empirical results allow to learn some lessons regarding to these metrics in the referred context.
1 INTRODUCTION
A Software Product Line (SPL) (Linden et al., 2007)
represents a set of systems sharing common features
that satisfy the needs of a particular domain. The
Product Line Architecture (PLA) plays a central role
at the development of products from a SPL because it
is the abstraction of all products that can be generated
encompassing similarities and variabilities of a SPL.
Obtaining a modular, extensible and reusable PLA
is a people-intensive and non-trivial task, related to
different and possible conflicting factors. Thus, PLA
design can be considered a hard problem which could
be formulated as an optimization problem with many
factors (Harman et al., 2014).
In this context, the optimization approach called
Multi-Objective Approach for Product-Line Architec-
ture Design (MOA4PLA) was proposed in (Colanzi
et al., 2014) with the goal of automatically finding
the best alternatives for a PLA design using search
algorithms. To do this, MOA4PLA uses an evalua-
tion model that originally included metrics to evaluate
basic design principles, feature modularization, de-
sign elegance and SPL extensibility. However, there
are other relevant properties for PLA design which
were not included in the original evaluation model
of MOA4PLA. Recently, the evaluation model of
MOA4PLA was extended to include metrics to pro-
vide indicators about the level of similarity and vari-
ability of the PLA in order to include new goals to be
optimized (Delgado et al., 2017). These metrics were
proposed in (Zhang et al., 2008) to assess the quality
of PLAs, but they have not been used in the context
of search-based PLA design yet.
After such an extension, the referred evaluation
model contains 17 objective functions, but this is a
high number of objectives to be simultaneously opti-
mized by search-based algorithms. The SPL architect
should select which objectives he/she wants to prior-
itize during the optimization. Information about the
possible correlation between the objective functions
is important in order to minimize the number of ob-
jectives to be selected to optimization.
Due to this, the objective of this work is inves-
tigate if there is correlation between the metrics re-
lated to similarity and variability (SSV, SVC and AV
- see Section 2.2) recently added to the evaluation
model. Then, to give effect to the objective of the
study, three experiments were conducted, one for each
pair of metrics. Empirical results allowed us to learn
some lessons about the use of these metrics in the
context of PLA design optimization by MOA4PLA.
Other studies about the possible correlation between
metrics related to basic design principles and feature
Verdecia, Y. and Colanzi, T.
Correlation between Similarity and Variability Metrics in Search-based Product Line Architecture: Experimental Study and Lessons Learned.
DOI: 10.5220/0006372605330541
In Proceedings of the 19th International Conference on Enterprise Information Systems (ICEIS 2017) - Volume 2, pages 533-541
ISBN: 978-989-758-248-6
Copyright © 2017 by SCITEPRESS – Science and Technology Publications, Lda. All rights reserved
533

modularization are under development.
This paper is structured in sections. Section 2 ad-
dresses the main concepts involved in this work. Sec-
tion 3 describes the experiments, the obtained results
and discussion. Section 4 presents lessons learned
and Section 5 concludes the paper.
2 BACKGROUND
This section provides background on the multi-
objective optimization of PLA design.
2.1 Genetic Algorithms
Genetic algorithms (GAs) are a part of evolutionary
computing and are inspired by the theory of natural
selection and genetic evolution (Coello et al., 2007).
GAs are efficient search methods based on principles
of natural selection and genetics, such as selection,
crossover and mutation operators to evolve a popu-
lation. GAs are being applied successfully to find
solutions to hard problems of Software Engineering,
such as software testing, refactoring, PLA design, etc.
(Harman et al., 2012; Harman et al., 2014).
Some GAs were adapted to solve multi-objective
problems (Coello et al., 2007), which involve
more than one objective to be simultaneously opti-
mized. Non-dominated Sorting Genetic Algorithm-
II (NSGA-II) (Deb et al., 2002) is a popular
non-domination based genetic algorithm for multi-
objective optimization. It was used in the experiments
carried out in this work.
As mentioned before, PLA design can be modeled
as a multi-objective optimization problem because it
is influenced by different factors. Those factors could
be optimized during the search process, but as they
can be in conflict, several possibilities of modeling a
specific PLA design could be found. In this context,
an approach that uses Multi-Objective Evolutionary
Algorithms (MOEAs) was proposed in (Colanzi et al.,
2014).The next sections present the main activities
and the evaluation model of this approach.
2.2 Search-based PLA Design Approach
MOA4PLA (Colanzi et al., 2014) is an approach to
optimize PLA design by search algorithms. This ap-
proach produces a set of potential solutions with the
best trade-off between the objectives selected by the
architect to be optimized. Examples of objectives can
be feature modularization, PLA extensibility or basic
design principles like coupling and cohesion.
MOA4PLA uses a metamodel to represent the
PLA design and it has search operators specific to
optimize PLA design. Each solution generated after
the application of the search operators is evaluated ac-
cording to the objective functions defined in the eval-
uation model. MOA4PLA encompasses four main ac-
tivities presented below:
Construction of the PLA Representation: the
input for this activity is the PLA design modeled in
a UML class diagram containing the SPL variabili-
ties. The output is the PLA representation accord-
ing to the metamodel defined in MOA4PLA. A PLA
contains architectural elements such as components,
interfaces, operations and their relationships. Each
element is associated with feature(s) by using UML
stereotypes and can be either common to all SPL
products or variable being present only in some prod-
uct(s). Variable elements are associated with variabil-
ities that have variation points and their variants.
Definition of the Evaluation Model: According
to the SPL needs, the architect must define what met-
rics should be included in the evaluation model, which
is used in the optimization process to evaluate each
obtained solution (potential PLA design). Some met-
rics can be in conflict, so, the use of different metrics
supports the architect in the analysis of trade-off be-
tween different quality attributes. Details about the
evaluation model are presented in the Section 2.3.
Multi-Objective Optimization: The PLA repre-
sentation obtained in the first activity is optimized
considering the constraints provided by the architect.
Each obtained potential PLA design is evaluated fol-
lowing the evaluation model defined in the previ-
ous activity. A set of PLA representations is gen-
erated as output. Different MOEAs can be used in
this activity. Algorithms based on GA optimize a
problem by three types of search operators: selec-
tion, crossover and mutation (Coello et al., 2007).
MOA4PLA includes the following mutation opera-
tors: MoveMethod, MoveAttribute, AddClass, Move-
Operation and AddComponent (Colanzi et al., 2014).
It also encompasses mutation and crossover operators
to improve feature modularization: Feature-Driven
Mutation (Colanzi et al., 2014) and Feature-Driven
Crossover (Colanzi and Vergilio, 2016).
Transformation and Selection: The set of so-
lutions obtained in the third activity is converted in
a legible view to the architect: a class diagram con-
taining the PLA design. So, the architect must select
one alternative that prioritizes some objective(s) to be
adopted as the PLA according to the SPL priorities.
OPLA-Tool (F
´
ederle et al., 2015) is a tool that au-
tomates all activities of MOA4PLA. It was used in
the experimental study conducted in the present work.
ICEIS 2017 - 19th International Conference on Enterprise Information Systems
534
Both input and output of MOA4PLA are XMI files
containing the PLA design in order to ease the inter-
changeable use of the approach artifacts.
2.3 Evaluation Model for PLA Design
The evaluation model of MOA4PLA includes met-
rics to provide indicators about different architectural
properties: feature modularization, PLA extensibility,
variability, similarity, design elegance and basic de-
sign principles, such as coupling, cohesion and size.
From the metrics suite, it is possible to construct ob-
jective functions to evaluate the quality of the solu-
tions obtained during the search process. Each objec-
tive function are briefly described in Table 2.
The metrics used by the objective functions SD,
SV and TV were recently added to the evaluation
model to provide indicators about level of similarity
and adaptability of the PLA. It is necessary to inves-
tigate the possible correlation between them. Before
presenting the experimental study, Table 1 show the
objective functions involved in the study as well as
their respective metrics, which are defined below.
Table 1: Objective Function Definition.
Objective Function Metric
SV (pla) = SVC SVC =
|Cv|
|Cc|+|Cv|
SD(pla) =
1
SSC
SSC =
|Cc|
|Cc|+|Cv|
TV (pla) = AV AV = |Cv| +
∑
i
AV (Ci)
SSC (Zhang et al., 2008) measures similarity of
PLA. SVC (Zhang et al., 2008) measures the struc-
ture variability of PLA. SSC and SVC are defined in
equations presented in Table 1. In both equations, Cc
and Cv are the numbers of common and variable com-
ponents on the PLA, respectively.
AV (Zhang et al., 2008) counts the total variabil-
ity of PLA as defined in Table 1, where: Cv is the
number of variable components in PLA and AV (Ci)
is variability of interior component Ci. If Ci is com-
pound component, then AV(Ci) can be calculated as
the equation presented in Table 1. If Ci is basic com-
ponent and has interior variability, AV(Ci)=1, else
AV(Ci)=0 (Zhang et al., 2008).
Values of SSC close to 1 represent high number
of common components within the PLA, whereas a
SVC value close to 1 demonstrates the presence of
high number of variable components in the PLAs. In
this sense, we can infer that SVC and SSC are conflict-
ing metrics justifying our study. It is also interesting
to investigate the possible correlation between those
metrics and AV.
As the objective of this study is to investigate cor-
relations between the metrics SSV, SVC, and AV , and
each objective function used in the present work is
composed of only one metric, from this moment we
will make reference to the metrics, but always bear-
ing in mind that for the realization of each experiment
the objective function associated with the metric was
selected in OPLA-Tool to be measured. The next sec-
tion describes the definition of the experiments car-
ried out in the present work.
3 EXPERIMENTAL RESEARCH
This section describes the performed experiments.
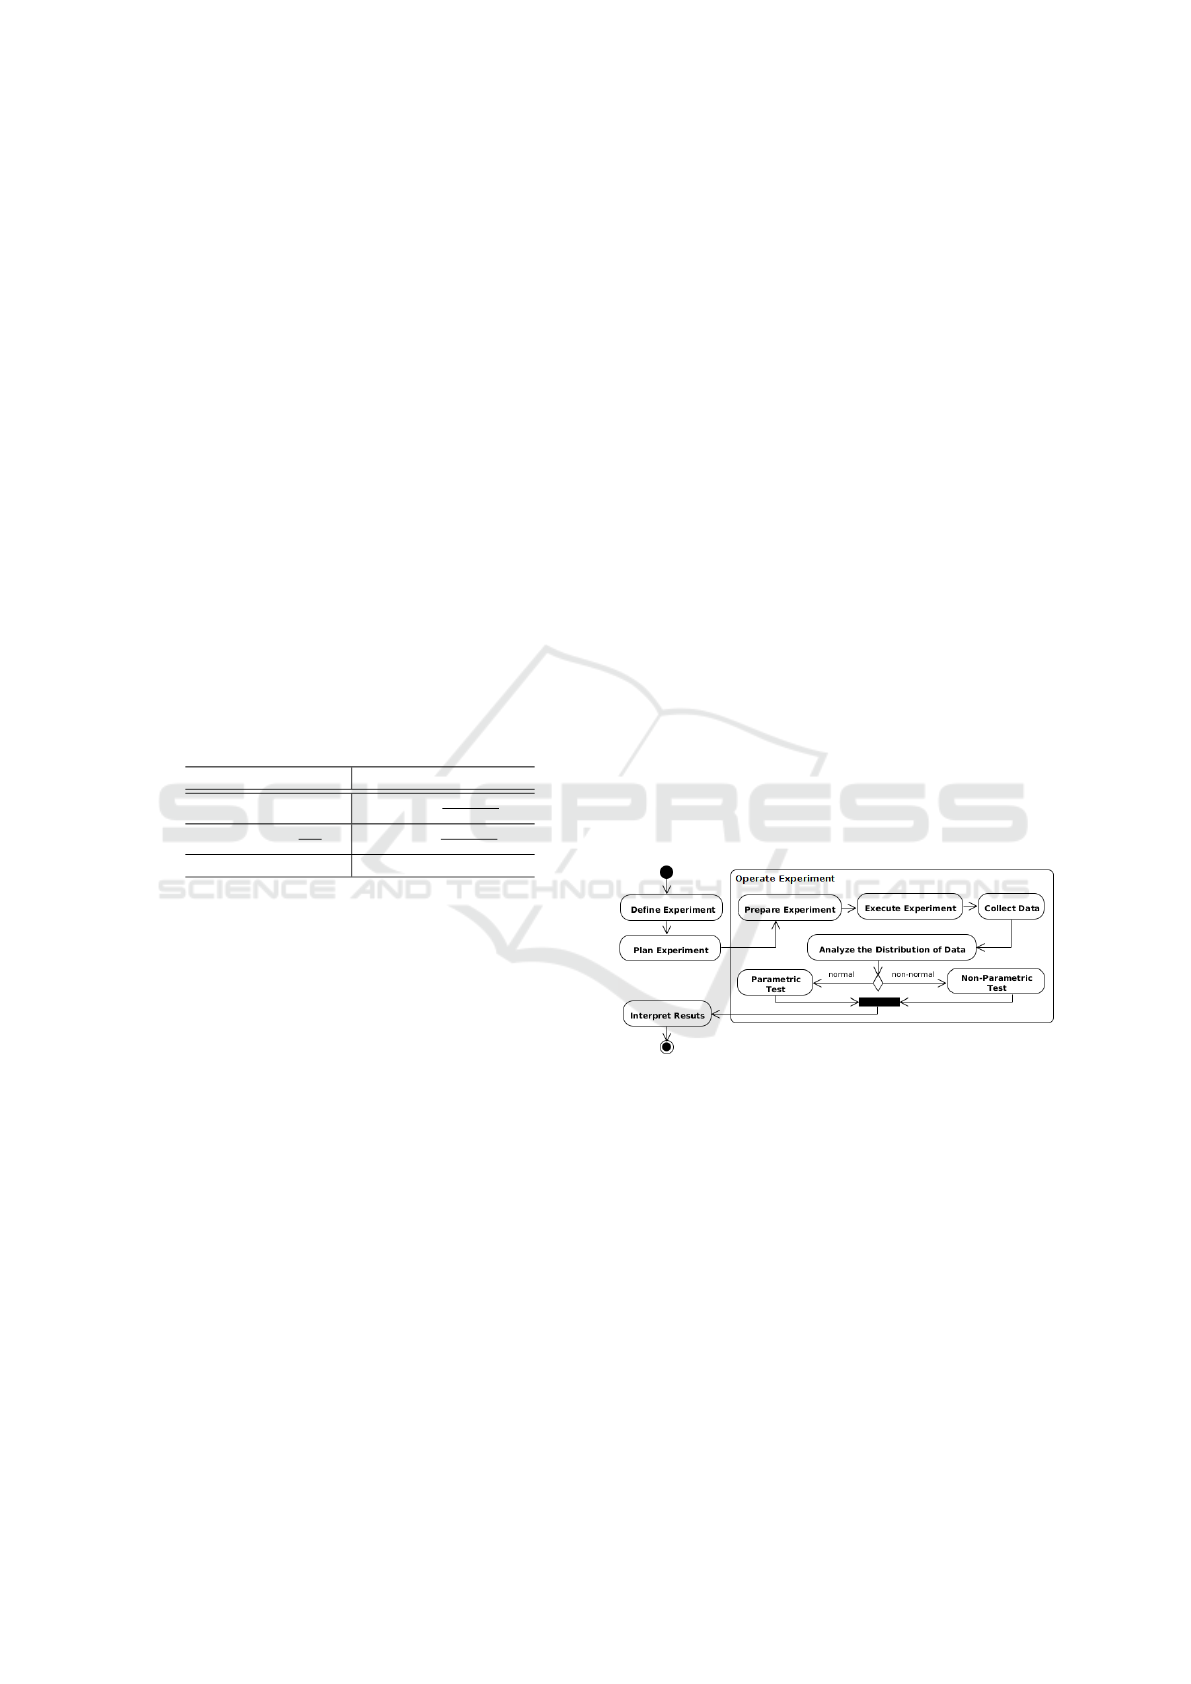
Figure 1 shows the sequence of activities taking into
account the phases of the experimentation process de-
fined in (Basili et al., 1986) which are: (i) definition,
(ii) planning, (iii) operation, and (iv) interpretation.
The first activity represent the experiment defini-
tion that contain the motivation, object, purpose and
perspective of the experimental study. The second
activity is the experiment planning where the exper-
iment is designed. The operation of the experiment
is the third activity. It consists in prepare and execute
the experiment, as well as collect data and analyze the
distribution of data. Different correlation tests are ap-
plied according to the type of distribution. In the last
activity the results are analyzed and discussed. The
following subsections describe each activity.
Figure 1: Activities of the Experimentation Process.
3.1 Experiments Definition
Taking into account the first phase of the experimenta-
tion process defined in (Basili et al., 1986), our study
definition is presented as follows: With a motiva-
tion to investigate correlation metrics, is conducted
a study whose propose is characterize the possible
existent correlation between each pairs of metrics re-
cently added to the evaluation model from the per-
spective of the researcher.
The correlation test was done through combina-
tions of pair of metrics. So, the study is divided
into three distinctive experiments. Each experiment is
called as follows: Experiment I that involves SVC and
Correlation between Similarity and Variability Metrics in Search-based Product Line Architecture: Experimental Study and Lessons Learned
535
Table 2: Objective Function Definition.
Objective Function Definition
FM(pla) It evaluates the feature modularization by aggregating several feature-driven metrics to measure
feature-based cohesion, feature diffusion and feature interaction over architectural elements.
CM(pla) It provides indicators on basic design principles including cohesion, coupling and size metrics.
Ext(pla) It indicates the degree of the SPL extensibility, where the extensibility is measured by means of
PLA abstraction.
Eleg(pla) It provides indicators about the elegance of a object-oriented software design.
ACOMP(pla) It measures the PLA components coupling by means of the sum of input and output dependencies
of each PLA design component.
ACLASS(pla) It consists of the sum of the number of architectural elements numbers that depends of each class
of the design to the sum of the number of elements whose each class of the design depends.
TAM(pla) It measures the mean of the operations number by interface of the PLA design.
COE(pla) It evaluates the cohesion of the PLA design by summing the number of internal relationships
of the classes of the PLA design.
DC(pla) It measures the feature diffusion by the summing the numbers of components, interfaces and
operations of the design that contributes to the realization of the SPL features.
EC(pla) It measures the feature interaction by summing the numbers of features with which the assessed
feature share at least an architectural element, such as component, interface and operation.
LCC(pla) It measures the lack of feature-based cohesion by summing the number of features assessed by
each component of the PLA.
CS(pla) It evaluates the component size in terms of its operations (methods) that are required by
components of a PLA.
SD(pla) It measures the similarity of a PLA (Table 1) taking into account the metric SSC.
CV(pla) It measures strong coupling of variability considering the dependencies between variability points
of the PLA.
RCC(pla) It counts the coupling of components by summing the number of relationships between interfaces
of the PLA.
SV(pla) It measures the structure variability of PLA in terms of the metric SVC (Table 1).
TV(pla) It counts the total variability of a PLA design by using the metric AV (Table 1).
SSC metrics, Experiment II involves SVC and AV met-
rics and Experiment III involves SSC and AV metrics.
The experiments were executed using OPLA-Tool.
3.2 Experiments Planning
The experiments was carried out in an academic envi-
ronment. For each experiment the PLA design is the
independent variable. The dependent variables vary
according to the experiment: (i) for Experiment I are
the values of the metrics SVC and SSC, (ii) for Experi-
ment II are the values of the metrics SVC and AV, and
(iii) for Experiment III are the values of the metrics
SSC and AV , as presented in Table 3. The correlation
is measured using the fitness of the solutions obtained
by the optimization process. The fitness of a solution
is the value of each metric for that PLA design, for in-
stance, considering a solution obtained in Experiment
I, its fitness is a pair of values for (SVC, SSC).
Table 3: Experiment Planning.
Exp. Independent Var. Dependent Var.
01 PLA of AGM, MM, Bank, BET SVC and SSC
02 PLA of AGM, MM, Bank, BET SVC and AV
03 PLA of AGM, MM, Bank, BET SSC and AV
How this study involved three experiments, for
each experiment two hypotheses were defined, being
(i) the null hypothesis is H
0
and represent that there
is no significant correlation between the metrics in-
volved in the experiment, and (ii) the alternative hy-
pothesis H
1
, that represent an existence of significant
correlation between the metrics involved in the exper-
iment. Hypotheses specific for each experiment are
defined below.
3.3 Experiments Operation
3.3.1 Preparation
The experiments involve the use of 4 (four) PLA de-
signs: (i) Arcade Game Maker (AGM) (SEI, 2016)
is an academic SPL that encompasses three arcade
games: Brickles, Bowling, and Pong, (ii) Mobile
Media (MM) (Contieri Jr et al., 2011) is a SPL com-
posed of features that handle music, videos, and photo
for portable devices. It provides support for man-
aging different types of media, (iii) System Bank-
ing (Bank) (Gomaa, 2011) supports the managing
of banking systems, and (iv) BET (Donegan and
Masiero, 2007) is a real SPL that supports the bus city
transport management. It offers features such as the
use of an electronic card for transport payment; au-
tomatic toll gate opening; and unified traveling pay-
ment. Table 4 presents the numbers of components,
interfaces, classes, features and variabilities of the
PLA designs.
ICEIS 2017 - 19th International Conference on Enterprise Information Systems
536
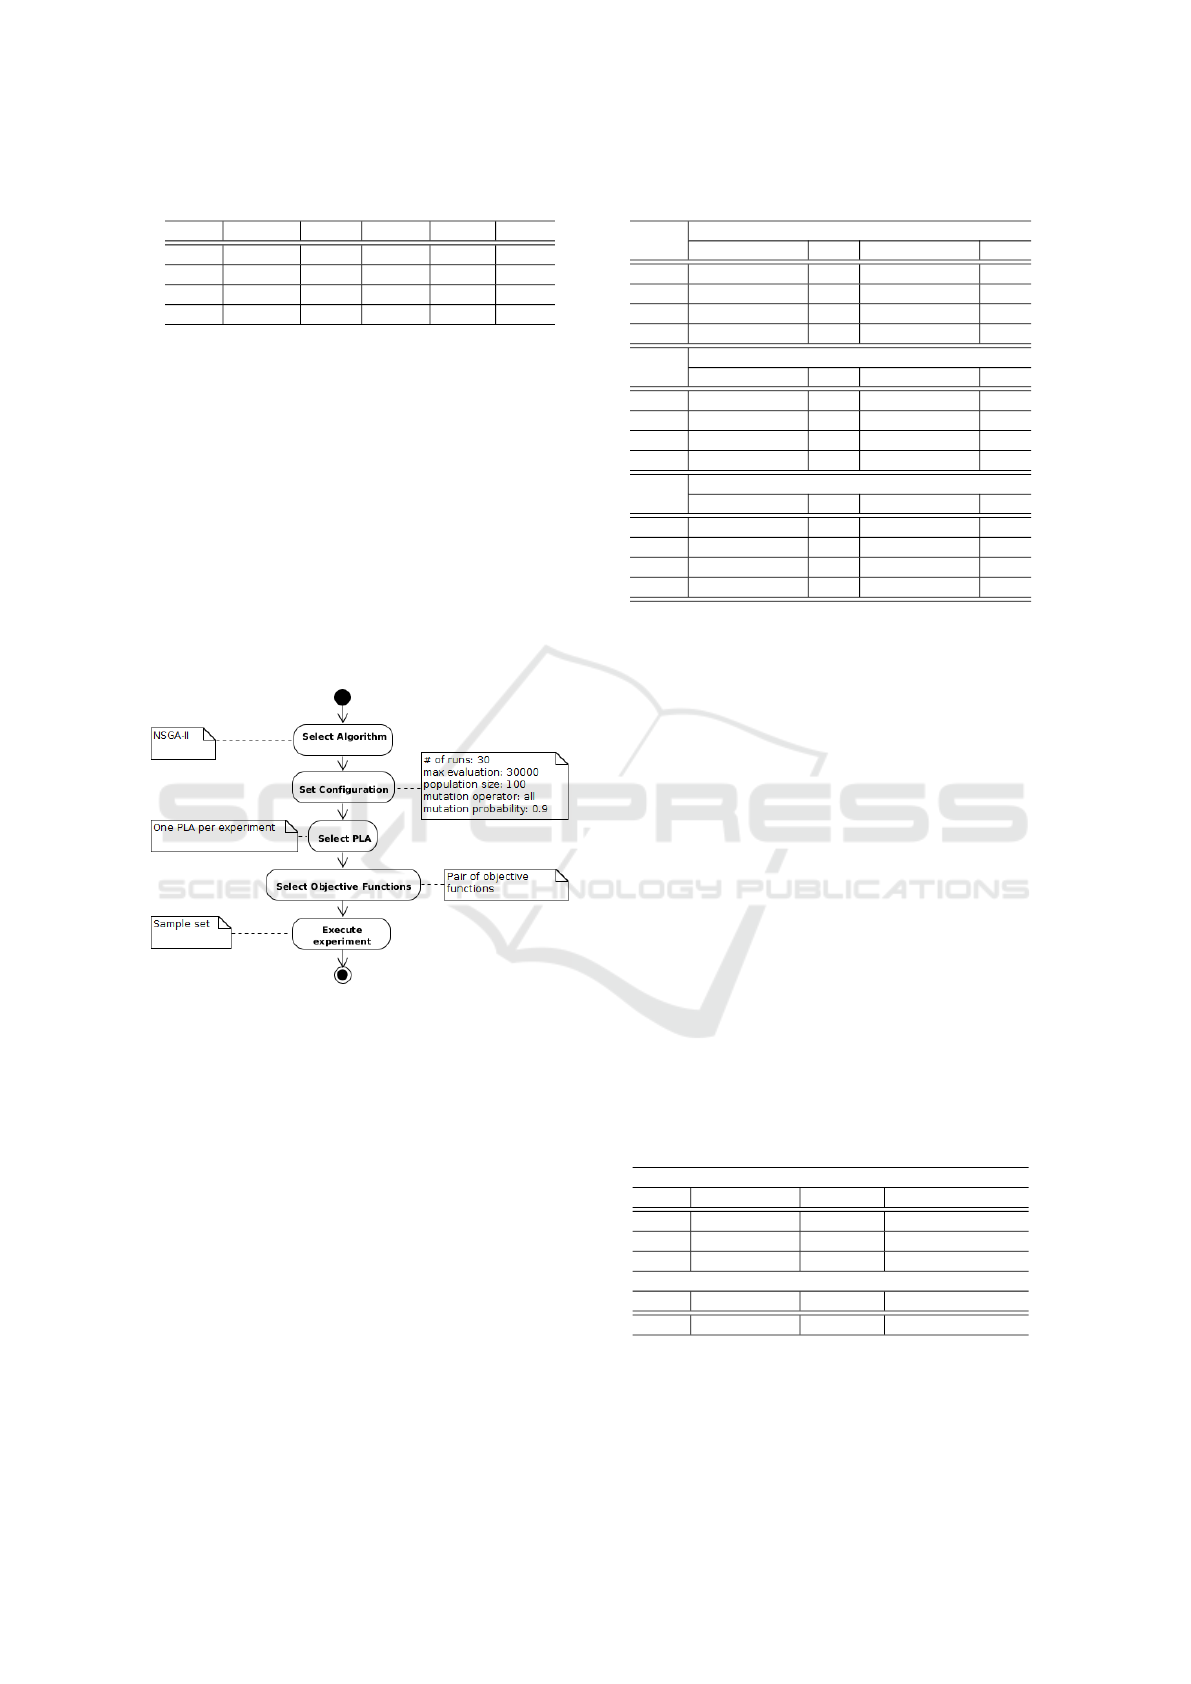
Table 4: Characteristics of the PLAs.
PLA # Comp. # Intf. # Class # Feat. # Var.
AGM 9 14 30 11 5
MM 8 15 14 14 7
Bank 4 5 25 16 3
BET 56 30 115 18 8
3.3.2 Execution
OPLA-Tool was used to execute the experiments.
Figure 2 shows the sequence of activities carried out
for each experiment. Every experiment was executed
with NSGA-II and the algorithm parameters were ad-
justed according to previous works (Colanzi et al.,
2014; Guizzo et al., 2014; F
´
ederle et al., 2015) where
the population size was equal to 100 individuals, the
number of fitness evaluations was 30000, all mutation
operators of MOA4PLA were applied with a mutation
probability equals to 0.9. Each experiment was exe-
cuted 30 runs. The number of fitness evaluations was
used as stop criterion for NSGA-II.
Figure 2: Configuration of an experiment.
3.3.3 Collected Data
At the end of each run of each experiment the results
of the metrics were collected for subsequent analysis.
3.3.4 Analysis
An assessment of the normality of data is a prerequi-
site for many statistical tests because normal data is
an underlying assumption in parametric testing.
Shapiro-Wilk test was applied to verify the nor-
mality of data with 95% of confidence. Table 5
present the results for each experiment, where N and
NN represent normal and non-normal distribution, re-
spectively.
Results presented in Table 5 show that data ob-
tained for AGM and BET in Experiment I are non-
normal distributed and that results obtained for the
Table 5: Results the Normality Test.
PLA
Experiment I
SVC p-value Dist. SSC p-value Dist.
AGM 0.02831 NN 0.02693 NN
MM 0.7392 N 0.7398 N
Bank Identical values - Identical values -
BET 2.2e-16 NN 2.2e-16 NN
PLA
Experiment II
SVC p-value Dist. AV p-value Dist.
AGM 0.7727 N Identical values -
MM 0.297 N Identical values -
Bank Identical values - Identical values -
BET 6.14 e-09 NN 1.77 e-08 NN
PLA
Experiment III
SSC p-value Dist. AV p-value Dist.
AGM 0.07186 N Identical values -
MM 0.2304 N Identical values -
Bank Identical values - Identical values -
BET Identical values - Identical values -
PLA MM pointed normal distribution of data (p-value
> 0.05).
Results obtained for the PLA Bank were the same
for all metrics in all experiments. This means that the
solution found in the optimization process has always
the same fitness. Similar situation happens for the val-
ues of the metric AV in Experiments II and III. Thus,
it was not possible to apply normality and correlation
tests for these cases due to lack of data diversity.
Considering AGM and MM, values of SVC ob-
tained in Experiment II and values of SSC obtained
in Experiment III have normal distribution. Results
obtained for BET in Experiment II have non-normal
distribution as attested by Shapiro-Wilk test (Table 5).
The non-parametric test of Spearman’s Correla-
tion was applied to verify the correlation between the
metrics whose data present non-normal distribution.
On the other hand, the parametric test of Pearson cor-
relation was applied for data with normal distribu-
tion. The results obtained from the correlation tests
are shown in Table 6.
Table 6: Correlation Test.
Experiment I
PLA Applied Test p-value Correlation Level
AGM Spearman’s < 2.2e-16 1
MM Pearson’s < 2.2e-16 0.9999
BET Spearman’s < 2.2e-16 -1
Experiment II
PLA Applied Test p-value Correlation Level
BET Spearman’s < 2.2e-16 -0.960358
The analysis correlation coefficient for both tests
considered values from -1 to +1. A value of +1 show
that the variables are perfectly linear related by an in-
creasing relationship, a value of -1 show that the vari-
Correlation between Similarity and Variability Metrics in Search-based Product Line Architecture: Experimental Study and Lessons Learned
537
ables are perfectly linear related by a decreasing re-
lationship, and a value of 0 show that the variables
are not linear related by each other. There is consid-
ered a strong correlation if the correlation coefficient
is greater than 0.8 and a weak correlation if the corre-
lation coefficient is less than 0.5.
3.4 Interpretation
In this section, the obtained results are analyzed and
discussed.
3.4.1 Behavior Data Analysis
According to the results presented in Table 6 in the
Experiment I for the AGM PLA exists perfect positive
correlation (rho = 1) between the metrics SVC and
SSC . For MM also exists strong positive correlation
(cor = 0.99) between the metrics SVC and SSC based
on the correlation scale of the same figure mentioned.
In each run, only one solution was obtained for these
PLAs. This corroborates the results of the correlation
test because, if the metrics were in conflict, several
solutions would be found with the different possible
trade-offs between the metrics.
However, for BET the correlation results were dif-
ferent (rho=-1), therefore there is strong negative cor-
relation between the metrics SVC and SSC. Really,
these were expected results because taking into ac-
count the nature of the metrics SSC (Similarity) and
SVC (Variability), the higher the number of common
components in the PLA, the lower the number of vari-
abilities and vice versa.
With respect to Experiment II, it was possible to
apply correlation test only for BET. The test points out
a strong negative correlation (rho= -0.96). For AGM,
MM and Bank it was not possible to apply correlation
analysis, because the results of AV were the same for
every solution as mentioned before. As the same situ-
ation happened with the results of AV to Experiments
III regarding all PLA designs (Table 5), the correla-
tion test was also not applied.
An analysis of the fitness values together the op-
timized PLA designs results provides some insights
about the results presented here. The next section
contains discussion about this analysis.
3.4.2 Discussion About the Results
In this section we analyze the solution with the best
trade-off between the metrics and compare it with the
original PLA design in order to understand the ob-
tained results per experiment.
Experiment I: To support the analysis, Table 7
shows the value of SSC and SVC before being opti-
mized (columns named Original Fitness) and shows
the value of SSC and SVC after being optimized
(columns named Obtained Fitness).
Table 7: Characteristics of PLAs for Experiment I.
PLAs
Original Fitness Obtained Fitness
SSC SVC SSC SVC
AGM 1.2857 0.2223 1.0328 0.0317
MM 1.1428 0.125 1.0309 0.0231
Bank 1.3333 0.25 1.1111 0.10
BET 1.0566 0.5353 1.0638 0.0588
According to the results it may be noted that:
From the point of view of SSC: the number of
common components increased in AGM, MM and
Bank, therefore the value of SSC decreased greatly
in these PLAs. For BET, the value of S SC increased
after the design optimization probably due to the in-
creasing in the number of variable components.
From the point of view of SVC: the values of
SVC for all PLA designs decreased after the opti-
mization. This is due to the changes in the values
of common components related before. Such a value
influence on the SVC value as shown in Equation 5.
The number of variable components existing in the
PLAs were maintained for AGM and Bank. For BET,
initially there was three variable components (Pas-
sageiroMgr, ViacaoMgr and CartaoMgr). After the
optimization, the PLA variabilities were distributed
in five components (PassageiroMgr, ViacaoMgr, Car-
taoMgr, LinhaMgr and PagamentoCartaoMgr) lead-
ing to an increased number of variable components.
For this experiment, it is clear that the correla-
tion depends on the PLA design provided as input to
the optimization process. For AGM and MM, the re-
sults pointed a positive correlation. For both PLAs,
SPL features are diffused on several components de-
creasing the feature modularization. So, during the
optimization process several components are created
to modularize features leading to the increase in the
number of common components. On the other hand,
in BET the SPL feature are well modularized what
prevent the increasing in the number of common com-
ponents. This may justify the negative correlation at-
tested by the correlation test. In this context, we are
not able to accept one hypothesis posed to the exper-
iment and reject another one. Further studies with
other PLA designs should be performed to improve
the evidence about the correlation between the met-
rics SSC and SVC.
Experiment II: Table 8 shows the original values
of SVC and AV as well as the values of the metrics
after being optimized.
Analyzing the results it may be noted that:
From the point of view of SVC: the values of this
ICEIS 2017 - 19th International Conference on Enterprise Information Systems
538
Table 8: Characteristics of PLAs for Experiment II.
PLAs
Original Fitness Obtained Fitness
SVC AV SVC AV
AGM 0.2223 4 0.0307 4
MM 0.125 2 0.0266 4
Bank 0.25 2 0.1666 2
BET 0.5353 6 0.1333 8
metric decreased after the optimization for all PLA
designs due to the changes in the number of common
components as justified in Experiment I.
From the point of view of AV : the results of AV
in MM and BET PLAs increased due to the increase
in the number of variable components. For MM, in
the original design all variabilities were concentrated
in the variable component named MediaMgr and, af-
ter the optimization, the number of variable com-
ponents increased because the variabilities were dis-
tributed in the components MediaMgr and EntryMgr.
For BET, the original number of variable compo-
nents was three (PassageiroMgr, ViacaoMgr and Car-
taoMgr) whereas the number of variable components
for the optimized PLA is four (NumCartoesMgr, Car-
taoMgr, LimitePassagensMgr and PassageiroMgr).
In this experiment was not possible to reach a con-
clusion about the correlation between SVC and AV ,
because as mentioned before the values of AV are the
same for each obtained solution. A factor that could
influence on the value of AV if the PLA design contain
composite components. The PLA designs used in the
experiments does not contain composite components.
Experiment III: Table 9 shows the results of the
value of SSC and AV before and after being optimized.
Taking into account the results it may be noted that:
Table 9: Characteristics of PLAs for Experiment III.
PLAs
Original Fitness Obtained Fitness
SSC AV SSC AV
AGM 1.2857 4 1.0323 4
MM 1.1428 2 1.0274 4
Bank 1.3333 2 1.1251 2
BET 1.0566 6 1.0975 6
From the point of view of SSC: with respect
to the original values, the values of SSC in the ob-
tained solutions decreased, except for BET the value
increased in spite of the number of variable compo-
nents did not change.
From the point of view of AV : the results of AV
in MM increased due to the increase of variable com-
ponents where the variabilities are distributed in the
components MediaMgr and EntryMgr whereas origi-
nally were concentrated only in MediaMgr.
As well as in Experiment II, we can state that Ex-
periment III is inconclusive and that, considering the
collected data, we are not able to accept one hypothe-
sis posed to the experiments and reject another one.
In general, is too early to consider these results
as definitive. As previously stated, further empirical
validation is needed, including replication of these ex-
periments, and also new experiments must be carried
out. After performing a family of experiments, the
cumulative knowledge allows to extract useful mea-
surement conclusions to be applied. Moreover, is also
needed to select PLAs with compound components,
for gathering real evidence that the AV metric can be
used to measure the total variability of PLA.
In spite of the inconclusive results, the conduction
of the experiments allows us to learn some lessons,
which are posed in the Section 4. Next, the main
threats to validity are presented.
3.5 Threats to Validity
The threats to validity considered in the experimental
studies are discussed in this section. Threats to the
internal and external validity are related to the set of
optimized PLA designs. To mitigate this threat we
used PLAs from different domains and with differ-
ent sizes. Three out of four PLA designs are aca-
demic/exemplary. Therefore, the results provide ev-
idence about the correlation between objective func-
tions evaluated in the studies, taking into considera-
tion the context of the PLAs used.
The main threat to the conclusion validity is the
number of the evaluated PLA designs. PLA design for
the SPLs AGM, Bank, and MM are smaller than the
BET design. We prioritized heterogeneous sample of
PLA designs as a way of reducing the classic homo-
geneous sample threat to validity. A study involving a
greater number of PLA designs is always desired. The
number of existing PLA designs is reduced because,
unfortunately, it is not easy to find PLA designs to
conduct experiments. We agree that we cannot gener-
alize results, as this paper is building an initial body
of knowledge on correlations investigated in the per-
formed experiments. Studies involving several PLA
designs should be performed in the future.
The construct validity is related to the experiments
configuration. Regarding to the used metrics, the
threat is guaranteed by their previous validation and
successful application in (Zhang et al., 2008). The
PLA designs used are non-commercial, but they were
goal of other studies. The adoption of the same popu-
lation size and the same number of generations inde-
pendently of the PLA size are other threats. We are
aware that we should perform more studies with dif-
ferent PLA designs and different parameters tuning.
Correlation between Similarity and Variability Metrics in Search-based Product Line Architecture: Experimental Study and Lessons Learned
539

4 LESSONS LEARNED
This section presents the lessons that we learned dur-
ing this experimental research:
1. PLA designs with diffused features can influ-
ence on the obtained results, what impacts on the cor-
relation of the investigated metrics as happen in the
Experiment I.
2. In spite we cannot attest the type of correlation
between the metrics SSC and SVC is better to opti-
mize one of them at once because similarity and vari-
ability are two naturally opposite concepts.
3. If the architect wants to prioritize the optimiza-
tion of the similarity of a SPL, the metric SSC can be
selected as a objective to the search process.
4. If the architect wants to prioritize the optimiza-
tion of the variability of a SPL and the PLA design
does not contain compound components, does not
make sense to select the metric AV. In this case, it
is better to select the metric SVC as a objective to the
search process.
5. In spite we cannot attest if there is correlation
between the metrics SVC and AV , we observe that,
according to the definition of these two metrics, for
PLA designs without compound components, the in-
crease in the number of variable components leads to
higher values of both SVC and AV. Thus, it seems
sufficient select one of these two metrics as objective
to the search process.
These lessons represent an important contribution
as they help to build an initial body of knowledge on
correlations between the investigated metrics and on
their use in the context of PLA design optimization
using multi-objective algorithms by MOA4PLA. The
lessons also provide insights to plan further experi-
ments related to the similarity and variability metrics.
5 CONCLUDING REMARKS
In this paper, an experimental research was conducted
to investigate the possible correlation between metrics
related to similarity and variability of PLA design.
Three experiments were carried out with the follow-
ing pair of metrics (SSC, SVC ), (SVC, AV ) and (SSC,
AV) involving four PLA designs.
The empirical results are inconclusive. So, it
was not possible to characterize the possible corre-
lation between the metrics. However, we learned
some lessons about the use of these metrics in the
context of PLA design optimization by the approach
MOA4PLA.
Further experiments should be performed with
other PLA designs to: (i) corroborate the behavior
of SSC and SVC about PLAs with diffused features,
(ii) evaluate the impact of AV on PLAs that contain
compound components, and (iii) improve the body of
knowledge on correlations between the metrics SSC,
SVC and AV in the PLA design optimization context.
ACKNOWLEDGEMENTS
The authors thank CNPq for financial support.
REFERENCES
Basili, V. R., Selby, R. W., and Hutchens, D. H. (1986). Ex-
perimentation in software engineering. IEEE Trans.
Softw. Eng., 12(7):733–743.
Coello, C. A. C., Lamont, G., and van Veldhuizen, D.
(2007). Evolutionary Algorithms for Solving Multi-
Objective Problems. Springer, 2nd edition.
Colanzi, T. E. and Vergilio, S. R. (2016). A feature-driven
crossover operator for multi-objective and evolution-
ary optimization of product line architectures. Journal
of Systems and Software, pages 126–143.
Colanzi, T. E., Vergilio, S. R., Gimenes, I. M. S., and
Oizumi, W. N. (2014). A search-based approach for
software product line design. In Proc. of SPLC, vol-
ume 1, pages 237–241.
Contieri Jr, A. C., Correia, G. G., Colanzi, T. E.,
de S. Gimenes, I. M., OliveiraJr, E. A., Ferrari, S.,
Masiero, P. C., and Garcia, A. F. (2011). Extend-
ing UML components to develop software product-
line architectures: Lessons learned. In Proc. of ECSA,
pages 130–138.
Deb, K., Pratap, A., Agarwal, S., and Meyarivan, T. (2002).
A fast and elitist multiobjective genetic algorithm:
NSGA-II. IEEE Transactions on Evolutionary Com-
putation, 6(2):182 –197.
Delgado, Y., Colanzi, T. E., Vergilio, S. R., and San-
tos, M. (2017). An enhanced evaluation model for
search-based product line architecture design. In XX
Ibero-American Conference on Software Engineering
(CIbSE2017). Submitted.
Donegan, P. M. and Masiero, P. C. (2007). Design issues
in a component-based software product line. In Proc.
of Brazilian Symposium on Software Components, Ar-
chitectures and Reuse (SBCARS), pages 3–16.
F
´
ederle, E. L., Ferreira, T., Colanzi, T. E., and Vergilio,
S. R. (2015). OPLA-Tool: A support tool for search-
based product line architecture design. In Proceed-
ings of the 19th International Conference on Software
Product Line, SPLC 15, pages 370–373, USA. ACM.
Gomaa, H. (2011). Software modeling and design: UML,
use cases, patterns, and software architectures. Cam-
bridge University Press.
Guizzo, G., Colanzi, T. E., and Vergilio, S. R. (2014). A
Pattern-Driven Mutation Operator for Search-Based
ICEIS 2017 - 19th International Conference on Enterprise Information Systems
540

Product Line Architecture Design. In Proc. of SSBSE,
pages 77–91, Fortaleza. Springer.
Harman, M., Jia, Y., Krinke, J., Langdon, W. B., Petke, J.,
and Zhang, Y. (2014). Search based software engi-
neering for software product line engineering: A sur-
vey and directions for future work. In Proc. of SPLC
2014, pages 5–18.
Harman, M., Mansouri, S. A., and Zhang, Y. (2012).
Search-based software engineering: Trends, tech-
niques and applications. ACM Computing Surveys,
45(1):11:1–11:61.
Linden, F. J. v. d., Schmid, K., and Rommes, E. (2007).
Software Product Lines in Action: The Best Indus-
trial Practice in Product Line Engineering. Springer-
Verlag New York, Inc., Secaucus, NJ, USA.
SEI (2016). Arcade Game Maker pedagogical product line.
http://www.sei.cmu.edu/productlines/ppl/.
Zhang, T., Deng, L., Wu, J., Zhou, Q., and Ma, C. (2008).
Some metrics for accessing quality of product line ar-
chitecture. In International Conference on Computer
Science and Software Engineering, pages 500–503.
Correlation between Similarity and Variability Metrics in Search-based Product Line Architecture: Experimental Study and Lessons Learned
541
