
Blood Flow and Pressure Change Simulation in the Aorta with the Model
Generated from CT Data
Nobuhiko Mukai, Yuhei Okamoto, Kazuhiro Aoyama and Youngha Chang
Computer Science, Tokyo City University, 1-28-1 Tamazutsumi, Setagaya, Tokyo, Japan
Keywords:
Computer Graphics, Physics based Simulation, Particle Method, Medical Application, Aorta.
Abstract:
We have performed the blood flow and the pressure change simulation in the aorta with the model generated
from CT (Computerized Tomography) data. There have been some previous researches related to the aortic
valve and the blood flow in the aorta. Some works simulated the aortic valve behavior with artificial models,
and others investigated the blood flow in the aorta with models generated from MRI (Magnetic Resonance
Imaging) data. In this paper, we demonstrate the simulation of the blood flow and the pressure change in the
aorta with a model generated from CT data, which model includes not only the aorta but also the left ventricle.
In the simulation, blood flows into the left ventricle through the mitral valve, the pressure increases according
to the blood flow that moves into the left ventricle through the mitral valve, and the aortic valve opens by the
pressure increase in the left ventricle. Finally, we have confirmed that the pressure change in the left ventricle
corresponds to a literature value.
1 INTRODUCTION AND
RELATED WORKS
There is a valve called “aortic valve” between the
aorta and the left ventricle in our hearts, and some
kinds of surgeries are performed if the valve falls into
malfunction. There are mainly two types of surgeries:
AVR (Aortic Valvular Replacement) and AVP (Aortic
ValvuloPasty). AVR replaces the dysfunctional live
valve with a prosthetic one. The surgery is not so dif-
ficult; however, taking warfarin is necessary to pre-
vent blood from coagulating. On the other hand, AVP
retrieves the valvular function by repairing the dys-
functional live valve. Taking wafarin is not necessary;
however, the surgery is very difficult so that the preop-
erative computer simulation is needed. For the simu-
lations, there have been some previous researches re-
lated to the aortic valve and the aorta.
(Hart et al., 2000) presented two-dimensional
fluid-structure interaction model, and (Hart et al.,
2003) expanded the model into three-dimension, and
visualized the maximum principle Cauchy stresses in
the leaflets of the aortic valve. On the other hand,
(Cheng et al., 2004) investigatedthe fluid velocity dis-
tribution and the wall shear stress on a bileaflet me-
chanical heart valve. In the simulation, there are two
types of materials: blood and aorta. Blood is fluid
and the aorta is a solid body so that fluid-solid in-
teraction should be considered. (Loon et al., 2005)
used Navier-Stokes equation for the blood flow and
hyperelastic Neo-Hookean model for the solid defor-
mation. (Carmody et al., 2006) used FEM (Finite El-
ement Method) for the simulation of fluid-structure
interaction. (Mukai et al., 2014) employed a parti-
cle method to simulate the aortic valve behavior by
considering heart’s pulsation. (Hsu et al., 2014) and
(Hsu et al., 2015) used Lagrangian-Eulerian methods
for fluid-structure interaction. They created artificial
models for the simulations, and the models were not
generated from medical data such as CT or MRI.
On the other hand, (Seo et al., 2011) generated a
simulation model from CT images, and simulated the
flow characteristic in the aortic arch. (Wendell et al.,
2013) generated an aorta model from MRI to inves-
tigate the behavior of the aortic valve. (Mukai et al.,
2016) also generated the simulation model from CT
data. These aortic models used for the simulations
were realistic because they were constructed with a
real data; however, they did not have the left ventri-
cle part. Then, (Le and Sotiropoulos, 2013) used a
simulation model including the left ventricle for the
simulation of fluid-structure interaction between the
blood flow and a mechanical heart valve.
In the previous researches, some used artificial
models to simulate the aortic valve behavior and oth-
ers used simulation models generated from real data;
392
Mukai, N., Okamoto, Y., Aoyama, K. and Chang, Y.
Blood Flow and Pressure Change Simulation in the Aorta with the Model Generated from CT Data.
DOI: 10.5220/0006479403920397
In Proceedings of the 7th International Conference on Simulation and Modeling Methodologies, Technologies and Applications (SIMULTECH 2017), pages 392-397
ISBN: 978-989-758-265-3
Copyright © 2017 by SCITEPRESS – Science and Technology Publications, Lda. All rights reserved

however, the target valves for the simulation were
prosthetic. Therefore, in this paper, we demonstrate
the blood flow and the pressure change simulation in
the aorta with a particle simulation model generated
from CT data, and confirm that a live aortic valve
opens by the pressure increase in the left ventricle.
In addition, we investigate if the pressure change in
the left ventricle corresponds to a literature value.
2 MODEL GENERATION
In the simulation, there are two types of materials
to be treated: blood and the aorta. Blood is fluid
and the aorta and the aortic vavle are solid bodies
so that we have to consider the interaction between
them. Especially, the topology of blood changes ac-
cording to the opening and the closing of the aortic
valve. For the topological change, particle methods
are suitable rather than FEM. Then, we employ a par-
ticle method for the simulation, and the simulation
model constructed with particles should be generated
from a medical data. Figure 1 shows the CT images
of a heart used for the generation of the simulation
model. The data is composed of 114 images, and the
images are numbered from the top to the bottom. The
format of the image is “bitmap” and the resolusion is
512×512.
Figure 1: CT image data of a heart.
On the other hand, Figure 2 shows a vertical cross
section image of the heart, which explains the loca-
tions of the aorta, the aortic wall, the aortic valve, the
Valsalva’s sinus, and the left ventricle. Pseudo color
is mapped to each part for easy recognition.
In order to generate the particle model of the
aorta, it is the best way to extract the target region
from the volume data shown in Figure 1; however,
Figure 2: Vertical image of the heart.
the model size would be about 30M voxels because
the image resolution is 512×512 and the number is
114. 30M particles are too much for a normal PC to
handle in the main memory so that the data reduction
is necessary. On the other hand, some breaks or holes
would happen in the aorta model if the image data
is simply reduced. In addition, in particle methods,
extra particles are needed outside of the model since a
high speed particle might jump out of the aortic wall
if the aortic wall is thin. Then, the model generation
algorithm is as follows.
<Particle model generation algorithm>
1. The resolution of the CT image data is reduced to
64×64 from 512×512.
2. Every four image plane is extracted for the model
generation.
3. The reduced image is binarized and the target vox-
els are extracted as a closed region by manual.
4. The closed region is filled with voxels and the two
outer voxels are extracted as the aortic wall ele-
ments.
5. The two extra voxels are added outside of the aor-
tic wall model as dummy voxels for the simula-
tion.
6. The particle model is generated by combining all
voxel data.
The particle model is generated in three dimen-
sion, and Figure 3 shows a cross section of the par-
ticle model generated from the CT data. The right
lower part is the left ventricle and the upper left part
is the aorta. The central part that has a different color
is the aortic valve, and the hole in the left ventricle is
the mitral valve. Figure 4 is another cross section of
the model viewed from a different angle. The lower
part is the left ventricle and the upper part is the aorta.
The right part next to the left ventricle is the mitral
valve. Here, the aortic valve is not so clear on the CT
image so that the aortic valve model is generated by
Blood Flow and Pressure Change Simulation in the Aorta with the Model Generated from CT Data
393
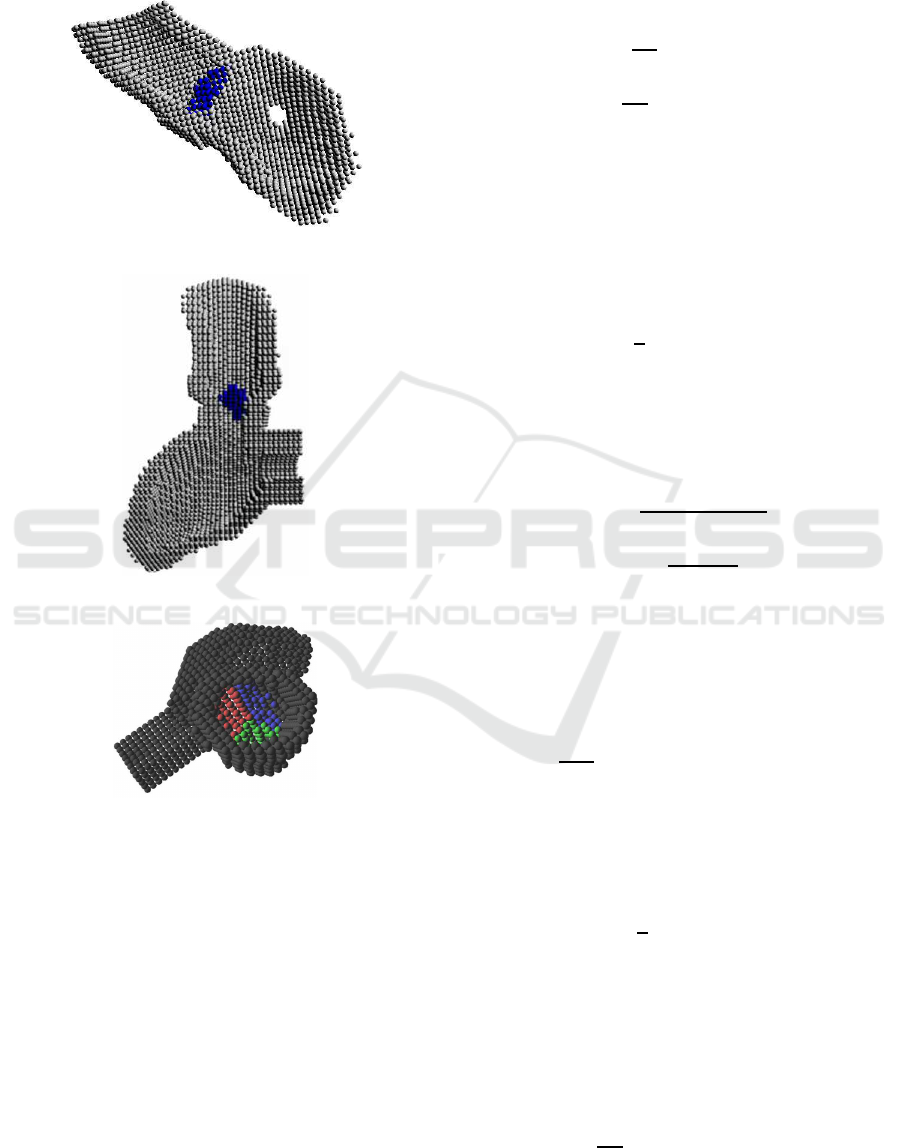
manual from the shape of the valsalva’s sinus. Figure
5 shows the particle model of the aortic valve, which
leaflets are differentiated by different colors.
Figure 3: Particle model of the aorta and the left ventricle.
Figure 4: Particle model viewed from a different angle.
Figure 5: Particle model of the aortic valve.
3 SIMULATION METHOD
In this simulation, a particle method is used be-
cause the topology of blood changes often accord-
ing to the opening and the closing of the aortic valve.
There are mainly two types of particle methods: SPH
(Smoothed Particle Hydrodynamics) and MPS (Mov-
ing Particle Semi-implicit). In general, SPH is used
for compressible fluid, while MPS is used for incom-
pressible fluid. Blood is generally treated as incom-
pressible fluid so that we employ MPS (Koshizuka,
2005) for the simulation.
Two kinds of governing equations are used for the
continuous body simulation: Cauchy’s equation of
motion and equation of continuity, which are written
as the following (Eqs. (1) and (2)).
ρ
Dv
Dt
= ∇· σ+ b (1)
Dρ
Dt
+ ρ∇ · v = 0 (2)
where, ρ is density, v is velocity, t is time, σ is stress
tensor, and b is body force acceleration such as grav-
ity.
In addition, the constitutive equation of elastic
body is described as follows (Eqs. (3) and (4)).
σ
e
= λtr(ε)I+ 2µε (3)
ε =
1
2
n
∇u+ (∇u)
T
o
(4)
where, σ
e
is stress of elastic body, ε is strain tensor,
I is unit tensor, u is displacement, λ and µ are lame
constants, which are expressed as follows (Eqs. (5)
and (6)).
λ =
νE
(1+ ν)(1− 2ν)
(5)
µ =
E
2(1+ ν)
(6)
where, ν is Poisson’s ratio and E is Young’s module.
By substituting Eqs.(3) and (4) for Cauchy’sequa-
tion (Eq.(1)), the next Cauchy-Navier equation (Eq.
(7)) is obtained, which equation is applied to analyze
the behavior of the aortic valve.
ρ
D
2
u
Dt
2
= (λ+ µ)∇(∇ · u)µ∇
2
u+ b (7)
On the other hand, the constitutive equation of fluid is
written as the following (Eqs. (8) and (9)).
σ
f
= −pI+ 2ηD (8)
D =
1
2
n
∇v+ (∇v)
T
o
(9)
where, σ
f
is stress of fluid, p is pressure, I is unit
tensor, η is viscosity, D is tensor of strain velocity,
and v is velocity. By substituting Eqs.(8) and (9) for
Eq.(1), Navier-Stokes equation (Eq. (10)) is obtained
as follows, which is applied to analyze the behavior
of blood.
ρ
Dv
Dt
= −∇p+ η∇
2
v+ b (10)
SIMULTECH 2017 - 7th International Conference on Simulation and Modeling Methodologies, Technologies and Applications
394
4 SIMULATION RESULTS
The simulation was performed with a normal PC (Per-
sonal Computer), which has i7-3770K CPU (Central
Processing Unit) and GeForce GTX570 GPU (Graph-
ics Processing Unit). The simulation time for 1[step]
corresponds to 0.1[ms] in real time, and the particle
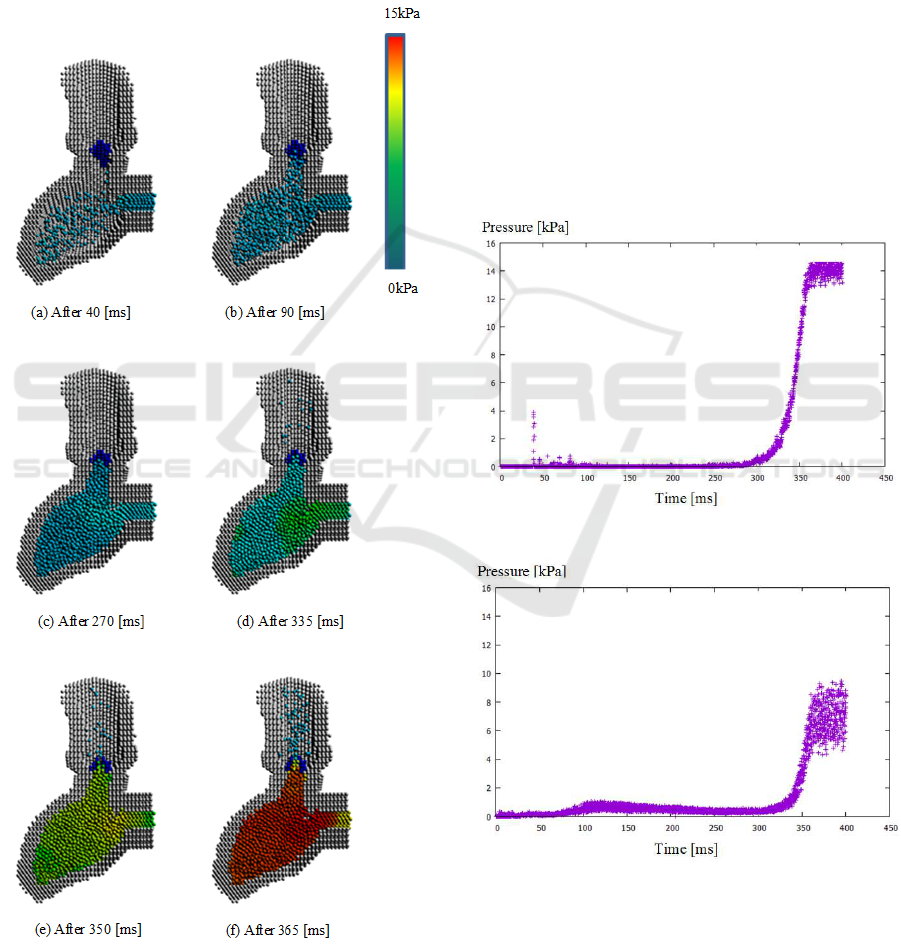
radius was 2 [mm]. Figure 6 shows the visualization
of the pressure inside the left ventricle and the aorta.
Figure 6: Visualization of the pressure in the left ventricle
and the aorta.
At first, particles are flown into the left ventricle
through the mitral valve (See Figure 6 (a)). Then,
the pressure in the left ventricle is gradually increased
(See Figure 6 (b) and (c)). When the pressure differ-
ence between the left ventricle and the aorta is high,
the aortic valve opens and some particles (blood) flow
into the aorta (See Figure 6 (d) and (e))). When the
pressure in the left ventricle becomes high, many par-
ticles flow rapidly into the aorta (See Figure 6 (f)).
On the other hand, Figure 7 and 8 show the pres-
sure change of the left ventricle and the aorta, respec-
tively. As particles flow into the left ventricle through
the mitral valve, the pressure in the left ventricle in-
creases. The pressure in the aorta also increases a lit-
tle bit later after the aortic valve opens by the pressure
in the left ventricle. There are some variances of the
pressure at the maximum level because particles flow
from the left ventricle to the aorta, and the pressure is
unsteady at the time.
Figure 7: Pressure change in the left ventricle.
Figure 8: Pressure change in the aorta.
Here, Figure 9 shows the diagram of the pressure
change of the left ventricle and the aorta in one heart
pulsation (Izawa, 2009; Levick, 2011; Klabunde,
2012; Silbernagl and Despopoulos, 2009). At the
atrial systole stage, the pressure of the aorta is higher
Blood Flow and Pressure Change Simulation in the Aorta with the Model Generated from CT Data
395

than the left ventricle, and the aortic valve closes. At
the isovolumetric contraction stage, blood flows into
the left ventricle and it is filled with blood. In ad-
dition, the left ventricle shrinks isovlumetrically so
that the pressure of the left ventricle rapidly increases
to the same level as the aorta. Actually at the rapid
ejection stage, the pressure of the left ventricle be-
comes slightly higher than the pressure of the aorta.
Therefore, the aortic valve opens. While blood flows
from the left ventricle to the aorta, the pressure of the
left ventricle is almost the same level as the pressure
of the aorta although the pressure of the left ventri-
cle is slightly higher than the pressure of the aorta.
After some blood has flowen from the left ventricle
to the aorta, the pressure of the left ventricle gradu-
ally decreases at the reduced ejection stage. Thus, the
aortic valve closes. After the aortic valve closes, the
left ventricle expands isovolumetrically at the isovol-
umetric relaxation stage, and the pressure of the left
ventricle rapidly decreases. If the aortic valve closes
correctly, no blood flows back from the aorta to the
left ventricle and the pressure difference between the
aorta and the left ventricle increases. At the rapid fill-
ing stage, blood flows into the left ventricle so that it
is filled with blood again at the reduced filling stage.
On the other hand, Figure 10 shows the diagram
that has the simulation results overlaid on Figure 9,
where the pressure value is changed to SI unit. From
the figure, the pressure of the left ventricle corre-
sponds well to the literature value; however, the pres-
sure of the aorta does not correspond to the literature
value. One reason is that particles flown into the aorta
from the left ventricle spread out because the aorta
does not form a closed region. The other is that the
initial pressure of the aorta is zero although the aorta
in the actual heart has some blood from the beginning.
Figure 9: Diagram of the pressure change in one heart pul-
sation.
Figure 10: Pressure comparison between the simulation re-
sults and a literature value.
5 CONCLUSIONS
In this paper, we have demonstrated the blood flow
and the pressure change in the aorta with the particle
model generated from CT data. We employed a parti-
cle method for the simulation because particle meth-
ods are useful for the topology change of the blood by
the opening and the closing of the aortic valve. In or-
der to perform the simulation, we had to generate the
model with particles and a precise model needs too
many memories to handle with a normal PC. Then,
we have constructed the particle model by reducing
the original CT image data and also by attaching ad-
ditional particles outside the model to prevent particle
explosion.
In the simulation, there are two types of ma-
terials to be handled so that two types of equa-
tions, Cauchy-Navier and Navier-Stokes equations,
should be solved. The simulation results were visu-
alized with particles. In the visualization, we have
confirmed that particles flew into the left ventricle
through the mitral value, the aortic valve opened by
the pressure of the left ventricle, and finally particles
flew into the aorta.
In the comparison of the simulation results with a
literature value, the pressure change in the left ven-
tricle corresponded well to the literature value, while
the pressure change in the aorta did not. This is due
to the openness of the aorta and the emptiness of the
blood in the aorta at the beginning.
Then, we haveto try the simulation with the model
having a closed region of the aorta and confirm that
the pressure change in the aorta also corresponds to
the literature value. In addition, we have treated the
aortic valve as an elastic body; however, the aortic
wall was treated as a solid body instead of an elastic
body in this simulation. In the future, we plan to per-
SIMULTECH 2017 - 7th International Conference on Simulation and Modeling Methodologies, Technologies and Applications
396

form the simulation by treating the aortic wall as an
elastic body.
ACKNOWLEDGEMENTS
We greatly appreciate Dr. Shuichiro Takanashi, who
is a chief director of Sakakibara Heart Institute, for
providing us the CT data and some useful advices.
This work has also been supported by JSPS KAK-
ENHI Grant Number 15K00176.
REFERENCES
Carmody, C. J., Burriesci, G., Howard, I. C., and Patterson,
E. A. (2006). An approach to the simulation of fluid-
structure interaction in the aortic valve. Journal of
Biomechanics, 39:158–169.
Cheng, R., Lai, Y. G., and Chandran, K. B. (2004). Three-
dimensional fluid-structure interaction simulation of
bileaflet mechanical heart valve flow dynamics. An-
nals of Biomedical Engineering, 32(11):1471–1483.
Hart, J. D., Peters, G. W. M., Schreurs, P. J. G., and Baai-
jens, F.P. T. (2000). A two-dimensional fluid-structure
interaction model of the aortic value. Journal of
Biomechanics, 33:1079–1088.
Hart, J. D., Peters, G. W. M., Schreurs, P. J. G., and Baai-
jens, F. P. T. (2003). A three-dimensional computa-
tional analysis of fluid-structure interaction in the aor-
tic valve. Journal of Biomechanics, 36:103–112.
Hsu, M.-C., Kamensky, D., Bazilevs, Y., Sackes, M. S., and
Hughes, T. J. R. (2014). Fluid-structure interaction
analysis of bioprosthetic heart valves: significance of
arterial wall deformation. Comput Mech, 54:1055–
1071.
Hsu, M.-C., Kamensky, D., Xu, F., Kiendl, J., Wang, C.,
Wu, M. C., Mineroff, J., Reali, A., Bazilevs, Y., and
Sackes, M. S. (2015). Dynamic and fluid-structure
interaction simulations of bioprosthetic heart valves
using parametric design with t-splines and fung-type
material models. Comput Mech, 55:1211–1225.
Izawa, Y. (2009). Medical Note: Cardiovascular Disease.
Nishimura, Tokyo.
Klabunde, R. E. (2012). Color Atlas of Physiology. Lippin-
cott Williams & Wilkins, Baltimore, 2nd edition.
Koshizuka, S. (2005). Particle Method. Maruzen, Tokyo.
Le, T. B. and Sotiropoulos, F. (2013). Fluid-structure inter-
action of an aortic heart valve prosthesis driven by an
animated anatomic left ventricle. Journal of Compu-
tational Physics, 244:41–62.
Levick, J. R. (2011). An Introduction to Cardiovascular
Physiology. Medical Science International, Tokyo.
Loon, R. V., Anderson, P. D., Baaijens, F. P. T., and
van de Vosse, F. N. (2005). A three-dimensional
fluid-structure interaction method for heart valve mod-
elling. C.R.Mecanique, 333:856–866.
Mukai, N., Abe, Y., Chang, Y., Niki, K., and Takanashi, S.
(2014). Particle based simulation of the aortic valve
by considering heart’s pulsation. In Medicine Meets
Virtual Reality, pages 285–289. IOS Press.
Mukai, N., Takahashi, T., and Chang, Y. (2016). Particle-
based simulation on aortic valve behavior with CG
model generated from CT. In VISIGRAPP 2016,
pages 248–253.
Seo, T., Jeong, S. H., Kim, D. H., and Seo, D. (2011).
The blood flow simulation of human aortic arch model
with major branches. In International Conference on
Biomedical Engineering and Informatics, pages 923–
926.
Silbernagl, S. and Despopoulos, A. (2009). Color Atlas of
Physiology. Georg Thieme Verlag, Stuttgart, 6th edi-
tion.
Wendell, D. C., Samyn, M. M., Cava, J. R., Ellwein, L. M.,
Krolikowski, M. M., Gandy, K. L., Pelech, A. M.,
Shadden, S. C., and LaDisaJr., J. F. (2013). Includ-
ing aortic valve morphology in computational fluid
dynamics simulations: Initial findings and application
to aortic coarctation. Medical Engineering & Physics,
35:723–735.
Blood Flow and Pressure Change Simulation in the Aorta with the Model Generated from CT Data
397
