
Numerical Comparison between a Modern Surfboard and an Alaia
Board using Computational Fluid Dynamics (CFD)
Luca Oggiano
Norwegian University of Science and Technology – SIAT (Senter for Idrettsanlegg og Teknologi),
K. Hejes Vei 2b 7042, Trondheim, Norway
IFE -Institutt for Energiteknikk, Instituttveien 18a, 2007, Kjeller, Norway
Keywords: Hydrodynamics, CFD, Surfboard Design.
Abstract: Surfboard design is traditionally considered more as an art than an engineering process. However, in the
past decade, the use of computers is becoming the standard in the shaping process. In the design part the use
of computer-aid-design (CAD) software, has simplified the design process allowing shapers to save time
and consistently modify or reproduce similar designs. At the same time, the improvement of computer-
numerical-controlled (CNC) machines is slowly replacing the traditional hand shaping techniques with more
controlled and reproducible manufacturing process. Another considerable advantage about having a 3D
CAD model of the surfboard is that the model can be imported in Computational Fluid Dynamics (CFD)
programs and its performances can be studied and evaluated highlighting details that would be otherwise
impossible to identify from a field test. The present paper aims to show the potential of CFD solvers for
surfboard design and its applicability by comparing a modern surfboard with a traditional ancient surfboard
design (alaia). The performances of the modern surfboard are evaluated and compared with the alaia board,
represented by an equivalent flat plate which is also used for validation. The commercial CFD code STAR-
CCM+ is used in the present work. An Unsteady Reynolds Navier Stokes (URANS) approach is used, the
volume of fluid (VOF) method is chosen as free surface discretization method and the turbulence model
chosen to allow the numerical closure of the RANS equations is the k-ɷ-SST proposed by Menter. The
model validation on an alaia board, represented as a flat plate shows good agreement with previous studies
and the comparison between the surfboard and the alaia addresses the superiority of the modern surfboard
design in terms of stability.
1 INTRODUCTION
Surfboards firstly appeared in the 5
th
-6
th
century in
Hawaii and they were used monarchs and villagers
alike. At that time, three types of surfboards were
available: the paipo (used by children) the olo (long,
thick and heavy boards that could weight up to
100kg) and the alaia. Surfing as we know it
(standing up and riding curing waves) was
developed and discovered thanks to the alaia boards.
The alaia boards are middle sized boards, simple in
shape, made in wood and finless, they can be
resembled to flat plates with a rounded nose. The
board paddles well enough to catch unbroken swells
still allows manoeuvres and curves on the waves
face and it is responsive to the surfer commands. For
centuries, surfing and surfboard design was confined
to Hawaii and no evolutions in the shape of the
boards were made since modern times. For the first
time, in 1930’s balsa wood (much lighter than
normal wodd) was introduced, the tail of the boards
were tapered to have a more hydrodynamic design
and increase manoeuvrability and fins were firstly
introduced to increase stability . The main change in
construction and materials didn’t appear since the
late 1940’s, where fiberglass was introduced,
allowing more complex shaping and finally driving
the design to the modern surfboard design
(Warshaw, 2010, Heimann, 2010). During this
period of time, boards became lighter, smaller and
their shape constantly evolved. However, the
surfboard design and shaping is still seen as a form
of art more than an engineering task.
Surfboards can be considered as 3D planing
surfaces similar to planing boats, velles, and surface
effect ship (SES) (Doctors, 2009). The main
Oggiano L.
Numerical Comparison between a Modern Surfboard and an Alaia Board using Computational Fluid Dynamics (CFD).
DOI: 10.5220/0006488400750082
In Proceedings of the 5th International Congress on Sport Sciences Research and Technology Support (icSPORTS 2017), pages 75-82
ISBN: 978-989-758-269-1
Copyright
c
2017 by SCITEPRESS – Science and Technology Publications, Lda. All rights reserved
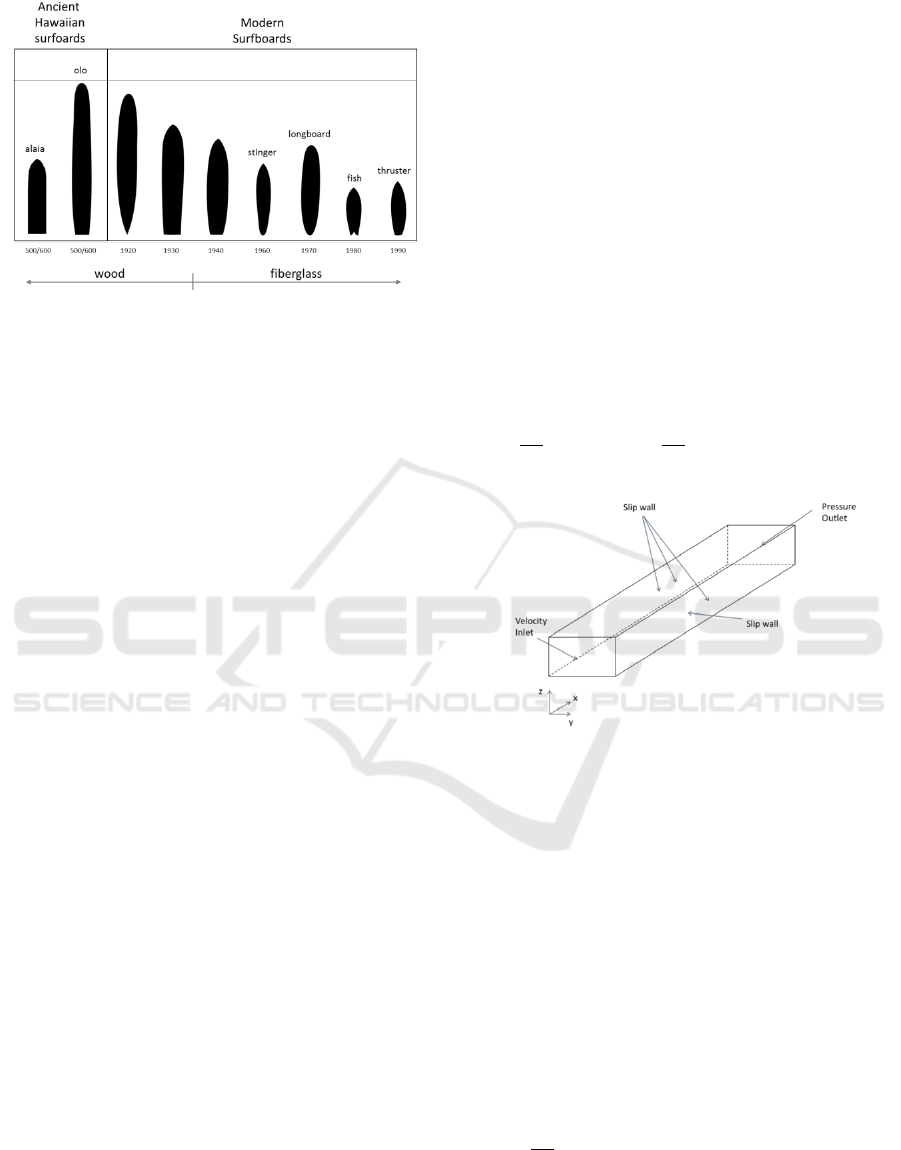
Figure 1: Evolution of surfboard design throughout the
years.
difference between a planing vessel and a traditional
one is that in planing vessels (and also in
surfboards), the hydrodynamic lift is typically used
to support a majority of the vessel displacement,
whereas hydrostatic forces constitute the main
contribution for displacement vessels. In order to
generate the necessary amount of lift, surfboards
need to reach a certain speed, however, in order to
reach the high speed needed, they should first
operate at a lower speed and successively accelerate
in order to be able to support the surfer. The
acceleration is usually obtained in two steps, in the
first step the surfer paddles, accelerating in order to
catch the wave and then uses the wave behaviour by
pitching the board to sharply increase the speed
reaching planing conditions. While the studies on
surfboards are limited, the studies on planing
surfaces are present in the literature and CFD proved
to a useful tool to study the physics of the
phenomenon. In particular Kramer (Kramer et al.,
2013) studied with CFD at 2D flat plate similar in
size of a alaia board.
The present paper aims to compare the planing
characteristics of a modern surfboard with an alaia
board with the same aspect ratio, pointing at
differences and proving the efficiency of CFD as
design tool for surfboards.
2 METHODS
A fully non-linear CFD approach will used
throughout the paper.
2.1 Numerical Setup
The VOF (Volume of Fluid) method originally
proposed by (Hirt and Nichols, 1981) included in
STAR-CCM+ was used in the current simulations.
The interface capturing routine is implemented in
the solver with a high-resolution compressive
differencing scheme described in (Ubbink, 1997,
Ferziger and Peric, 2001).
The k-turbulence model proposed by Menter
(Menter, 1994) was used as closure model to solve a
time dependent version of the Reynolds Averaged
Navier Stokes. The k- Menter SST model was
chosen due to its capabilities to capture the vortex
structures developing in the wake region and its
superior performances in highly separated flows
(Zaïdi et al., 2010, Wilcox, 2006).
The governing equations used in the discretised
model can be generally expressed as:
(1)
(2)
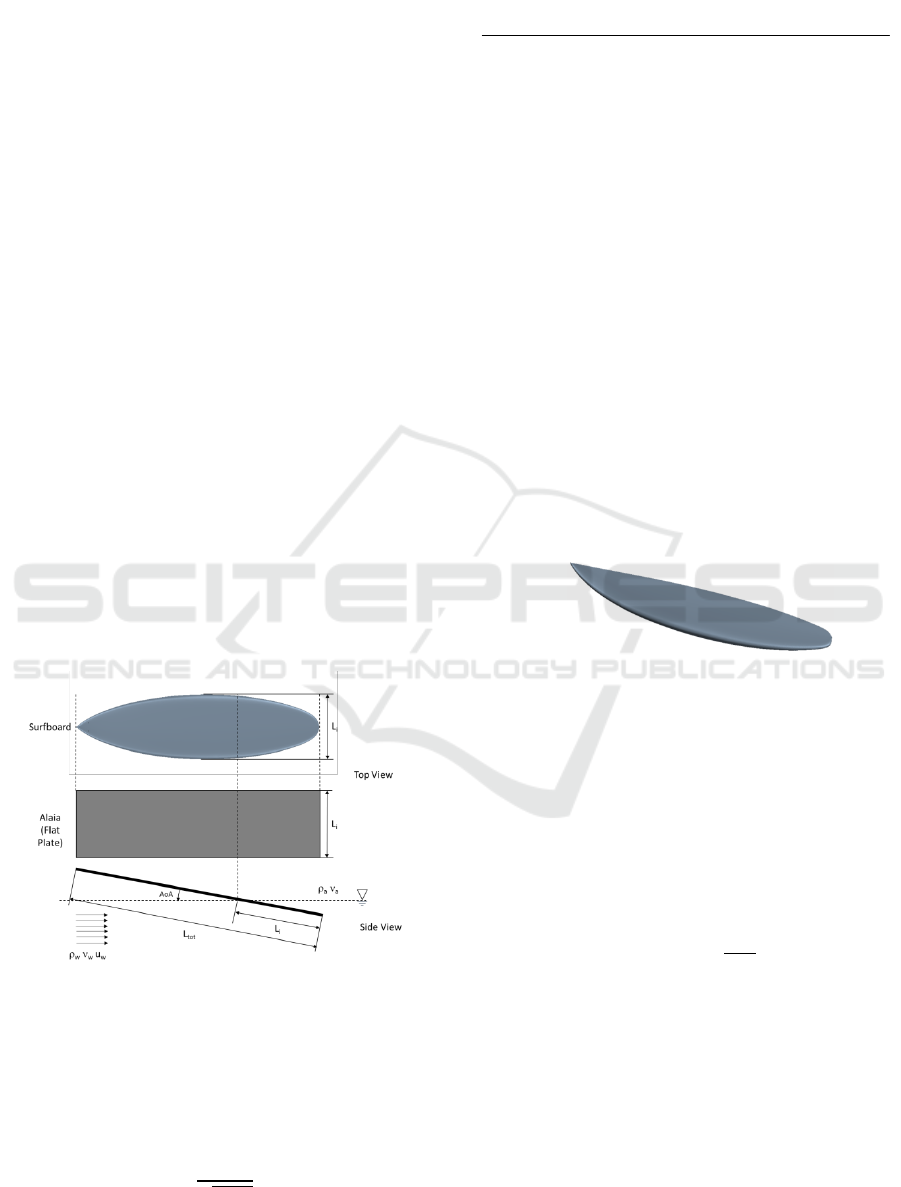
Figure 2: Numerical basin with boundary conditions
applied at each boundary.
Where Eq. 1 represents the conservation of mass
and Eq.2 represents the conservation of momentum.
In the VOF representation, the density
, and the
viscosity,
, are specified in terms of the water
volume fraction,
(3)
(4)
When solving the equations, the water volume
fraction
, once the velocity field is known, is
advanced in time by the transport equation:
(5)
Per each time step, the forces on the model are
calculated by pressure integration on the pressure on
the wetted surface area.
(6)
The domain width is 30m, the depth is 10m and
the length is 200m. The boundary conditions used in
the simulation are shown in Figure 2: slip wall
condition was used at the bottom, symmetry
boundary conditions were used at the sides and top
and a p boundary condition was used at the outlet. A
relaxation area, consisting of an added damping
domain with a flat bottom, 200m long and
discretized with stretched cells in the x-direction was
added at the end of the domain in order to reduce
numerical reflection from the outlet.
2.2 Geometrical Models Used
A surfboard and a flat plate (representing the alaia)
models are used in the present study, both with an
initial immersed length Li=0.5m and oriented with
an angle of attack AoA from the calm-water free-
surface. The model is assumed to travel at a constant
forward speed U on the water surface, which is
assumed to be an incompressible fluid of density ρ
w
and kinematic viscosity ν
w
and it represents the
liquid phase of the mixture. The traveling velocity is
modelled by imposing a velocity inlet boundary
condition at the inlet boundary, where the velocity
u
w
=U is here prescribed to each of the boundary
cells included in the liquid phase of the mixture.
Figure 3: Side and top view of the surfboard and alaia (flat
plate) models used in the simulations.
The second phase of the mixture is assumed to
be air and it is modelled as an incompressible gas of
density ρ
a
and kinematic viscosity ν
a
and u
a
=0.
Defining the Froude Number as
(7)
Table 1: Physical quantities.
Where u
w
is the flow velocity of the water mixture, g
is the gravity and Li is the immersed length, two
different flow velocities, U=4m/s and U=8m/s
corresponding to Fr=1.28 and Fr=2.55 were
simulated. The flow velocities are chosen in order to
be representative for paddling speed (U=4m/s) and
cruising speed (U=8m/s).
2.2.1 Surfboard
The surfboard model used is designed with
Akkushape. The model does not include fins and it
has a length of 1.65m and a width of 0.5m The tail
geometry is a squash tail.
Figure 4: 3D representation of the surfboard model.
2.2.2 Alaia
The alaia model used in the simulations has the same
length and width of the surfboard (length=1.65m,
width= 0.5m). For simplification and in order to
have comparable data available, the alaia design
chosen for the simulations was a simple flat plate
and its dimensions were chosen in order to have the
same aspect ratio as the surfboard where:
(8)
2.3 Grid Topology and Grid
Dependence Study
A trimmed meshing technique was chosen in order
to correctly model the water free surface in the
numerical basin. Different levels of grid refinements
were used in order correctly reproduce the
perturbations to the free surface induced by the
models.
Item
Symbol Value Units
Water density ρ
w
1000 kg/m3
Air density ρ
a
1.19 kg/m3
Water kinematic viscosity ν
w
1.0048∙10
-6
m
2
/s
Air kinematic viscosity ν
a
1.4604∙10
-5
m
2
/s
Immersed length L
i
0.5 m
Gravitational acceleration
g 9.81 m/s
2
Total length
L
tot
1.65 m
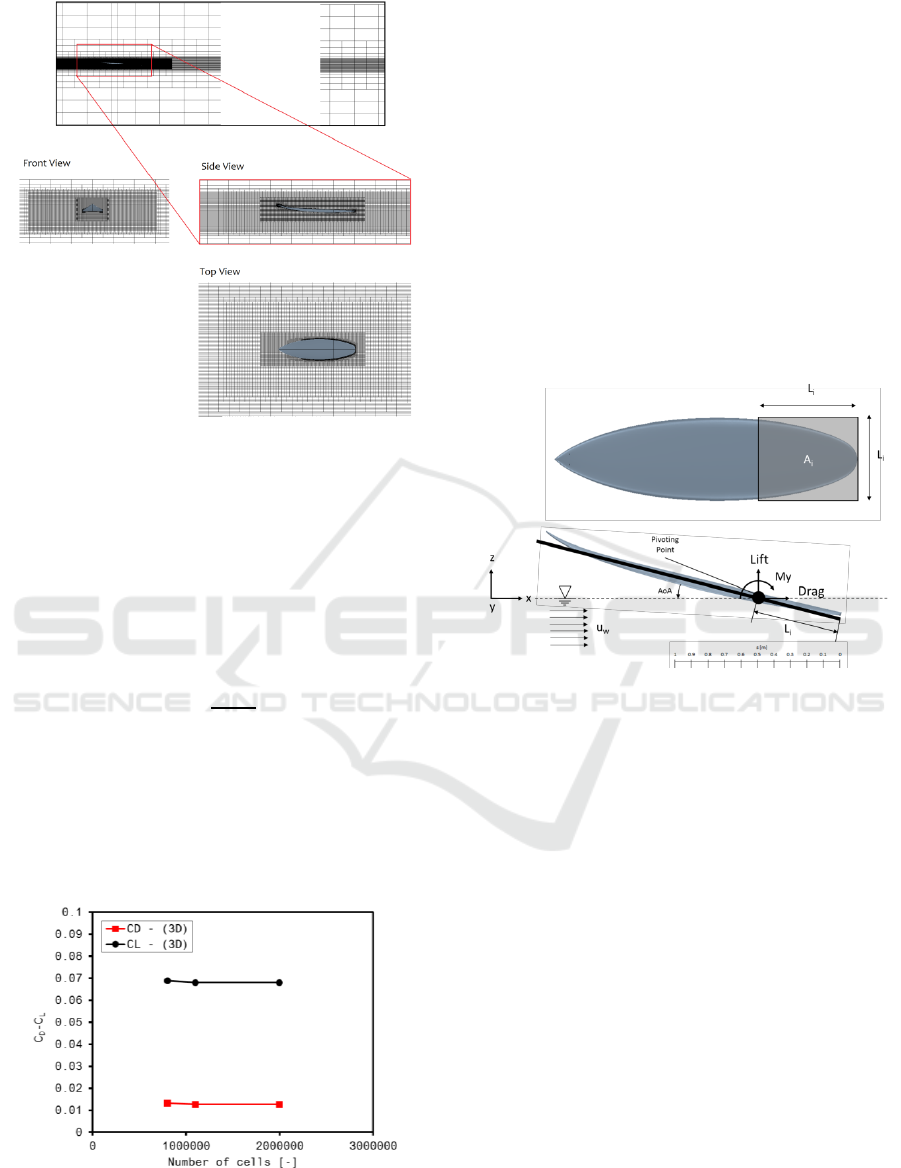
Figure 5: Mesh topology.
The surface mesh was created using 100points
per curvature and a prismatic mesh consisting of 10
layers growing with a growing factor of 1.5 was
created on top of the surface in order to correctly
capture the boundary layer. The first cell height was
chosen so that the wall y+ was kept lower than 5 on
the whole surface. Defining the convective Courant
number as
(9)
Where u
w
is the water flow velocity, Δt is the
time step and Δx is the cell with in the x direction,
the time step was chosen so that CCN=0.5 in the
finer portion of the grid, which is the necessary
condtion for the numerical stability of the VOF
model.
Figure 6: Grid convergence for c
L
and c
D
at Fr.1.1, AoA=4
deg for the surfboard.
A preliminary dependency study was carried out
for AoA=4 deg and Fr=1.1 in order to ensure
numerical convergence and a grid independent
solution. The results are plotted in Figure 6. The plot
shows a clear grid convergence with minimal
differences between the middle refined grid
consisting of 1.2million cells and the fine grid which
consists of 2.1millions cells. The fine grid,
consisting of a total number of cells of 2.1millions
was used in the simulations.
2.4 Model Validation
A preliminary study on a 2D fixed flat plate was
carried out in order to validate the model against
previous work.
Figure 7: Surfboard parameters and coordinate system.
The problem of a two-dimensional planing flat
plate studied using a nonlinear CFD solver for
varying Froude number and angle of studied by
Kramer (Kramer et al., 2013) was chosen for the
comparative study. In Kramer’s work a quasi-steady
CFD approach using inviscid flow was used and
potential-flow assumptions that either assume linear
free-surface and body boundary conditions or ignore
gravitational effects were also addressed. As a
reference case, the test case with Fr=1.1 and
AoA=10deg was chosen. In the present
computations, a fully turbulent approach is used and
both a 2D and 3D computations were carried out and
compared with the previous computations carried
out by Kramer.
The non dimensional coefficients for lift and
drag were chosen to be relative to the direction of
motion with the drag being along the x-axis and
parallel to u
w
and the lift in the y-axis and
perpendicular to the velocity u
w.
The pivoting point
around which the models rotate was placed at
s=0.5m.
The nondimensional coefficients for lift and drag
force can be expressed as follows:
(10)
(11)
With A
i
[m
2
] being the submerged area and being
0.25m and 0.182m respectively for the flat plate
representing the alaia and for the surfboard.
The results from the computations for both 2D and
3D cases are plotten in Figure 8.
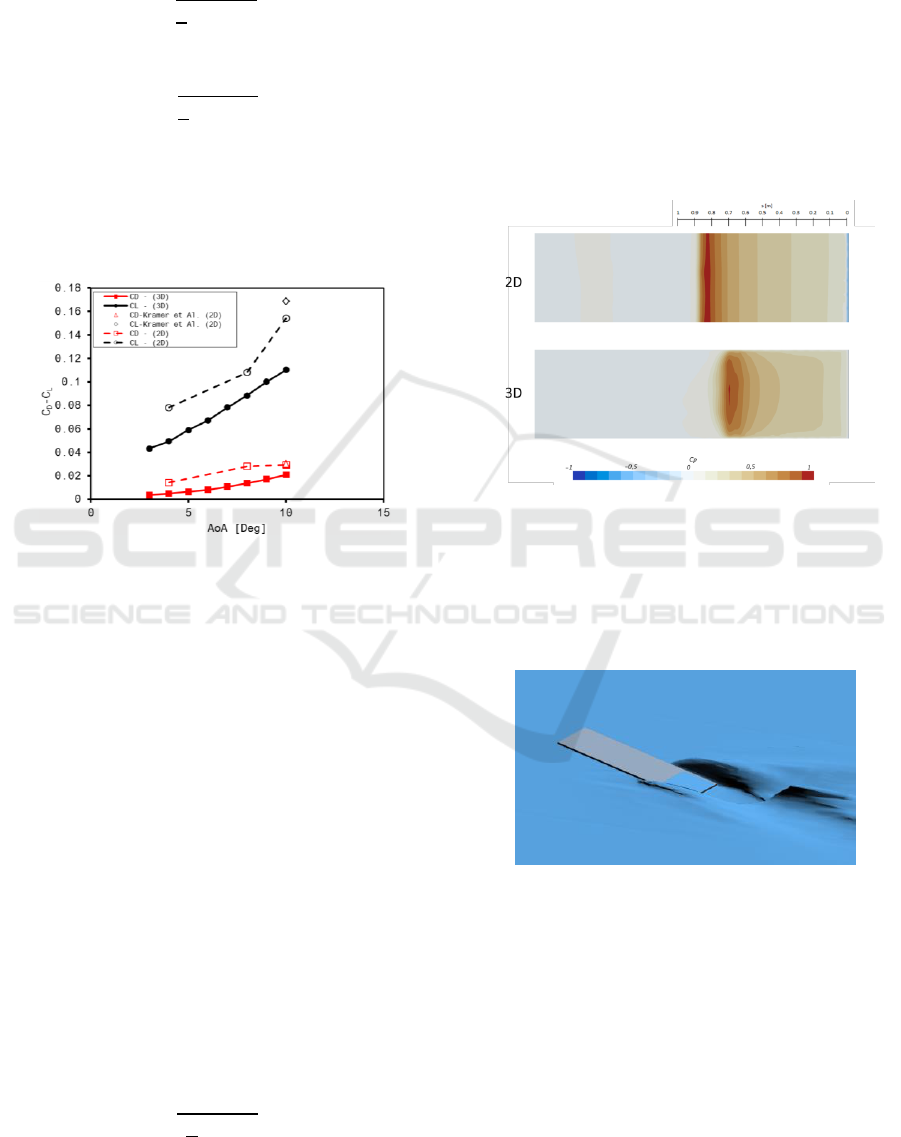
Figure 8: C
D
and C
L
for a 2D and 3D flat plate and
comparison with previous work (Kramer et al., 2013).
A good agreement between the Kramer compu-
tations and the present one can be seen for both lift
and a drag coefficient values for the 2D case. When
comparing the 3D simulations with the 2D
simulations, a clear decrease in drag and lift
coefficient can be seen in Figure 8. This is due to the
influence of the downwash from the extremity
vortices resulting in reduced lift for finite aspect-
ratio plates. This is a known phenomenon and it is
widely addressed in the classical theory for flat
plates aerodynamics (Taira and Colonius, 2009) but
also in the theory for planing flat plates with
different aspect ratios (Perry, 1952) and in the
classical aerodynamics theory (White, 2016). The
drag and lift difference due to extremity vortices can
also be seen when analysing the pressure coefficient
contour plots for the 2D and 3D flat plate from the
simulations at AoA=10deg and Fr=1.1 (Figure 9). In
the plots the pressure has been normalized with the
flow velocity
(12)
The contour plots from the 2D simulations show
that the stagnation point is located at 0.85m from the
trailing edge, which is in line with previous
simulations while for the 3D simulations the
stagnation pint is located further back in the plate at
0.7m from the trailing edge. While in the 2D
simulations the iso-pressure lines are almost parallel,
in the 3D simulations, a pressure drop near the sides
is present. The overall lower pressure experienced
by the 3D plate when compared with the 2D plate,
results leads to a lower drag force but in particular a
lower lift force.
Figure 9: Iso-pressure coefficient contours on the 2D and
3D flat plate.
In Figure 10 the iso-surface representing the free
water surface is shown. Here, the flow detaching
from the flat plate sides that leads to a lower overall
drag on the 3D flat plate is clearly visible.
Figure 10: Free surface snapscho of the flow behind a 3D
flat plate for AoA=10 and Fr=1.1.
3 RESULTS AND DISCUSSION
In the present section, the results from the
simulations are evaluated and the key performances
of the surfboard and the alaia board are compared.
From Figure 11 it is clearly visible the alaia has
a larger drag than the surfboard. This is due to a
number of factors but two main design differences
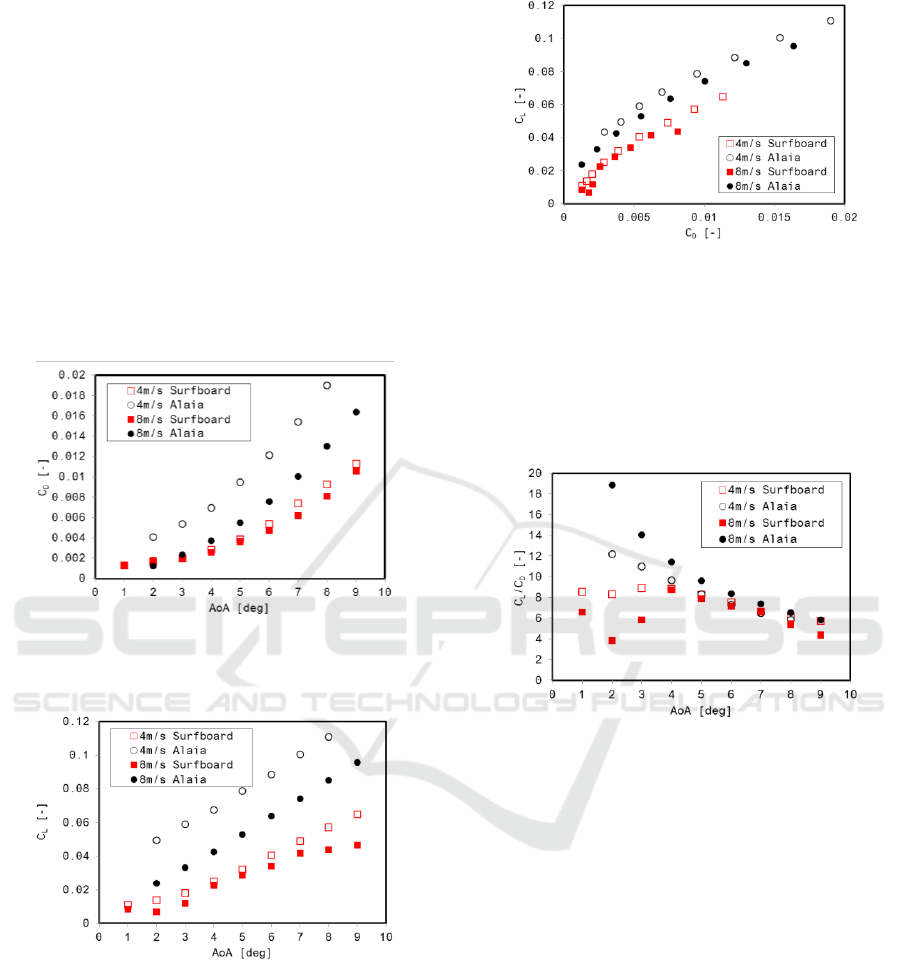
causing this behaviour can be addressed. The bottom
of the boards is different with the surfboard having a
curved bottom surface to deliberately reduce the
drag and increase the speed. The tail shape between
the two boards is also different, with the surfboard
having a tapered shape (introduced in late 1920’s) to
allow for better performances and in particular to
reduce the drag generated by the extremity vortices
detachment. It is also clearly visible that the
surfboard’s c
D
is stable with increasing speeds while
a steep decrease in c
D
happens in in the alaia. This
leads to the need of continuous and more prominent
adjustments from the rider in order to compensate
for the difference in drag generated by the board and
allow the surfer a smooth ride.
Figure 11: Drag coefficient c
D
versus Angle of Attack AoA
for alaia and surfboard at 4m/s and 8m/s. Surfboard in red
(■) and alaia in black (●).
Figure 12: Lift coefficient c
L
versus Angle of Attack AoA
for alaia and surfboard at 4m/s and 8m/s. Surfboard in red
(■) and alaia in black (●).
The alaia also generates a greater lift than the
surfboard due to the topology of its bottom deck
when compared with the surfboard.
A flatter bottom like the one found in the alaia
leads to a larger wetted area and thus larger forces
both in the horizontal and vertical direction. This
also explains the fact that alaias require considerable
smaller volumes to be able to plane.
Figure 13: Lift coefficient c
L
versus drag coefficient c
D
for
alaia and surfboard at 4m/s and 8m/s. Surfboard in red (■)
and alaia in black (●).
Similar conclusions can be drawn when plotting
the polar curve (c
L
vs. c
D
) for both surfboard and
alaia with the latter one generating higher lift for the
same levels of drag when compared with the
surfboard.
Figure 14: Efficiency (c
L
/c
D
) versus Angle of Attack AoA
for alaia and surfboard at 4m/s and 8m/s. Surfboard in red
(■) and alaia in black (●).
When plotting the efficiency (c
L
/c
D
) against the
angle of attack (Figure 14), a different behaviour
between the alaia and the surfboard can be noticed,
with the latter having a lower efficiency at low
angles of attack but a more constant efficiency than
the former. The higher lift generated by the alaia at
low angles of attack is due to the different pressure
distribution that the alaia experiences when
compared with the surfboard in the tail region
(Figure 15). This high pressure in the tail region
generates a negative moment that the surfer will
have compensate by moving his weight on his back
foot and changing the AoA in order to keep the board
stable. In general then the high efficiency at low
angles of attack for the alaia is generated by an
unstable pressure distribution and requires
continuous adjustments from the surfer in order to
compensate the lift generated in the tail area of the
board.
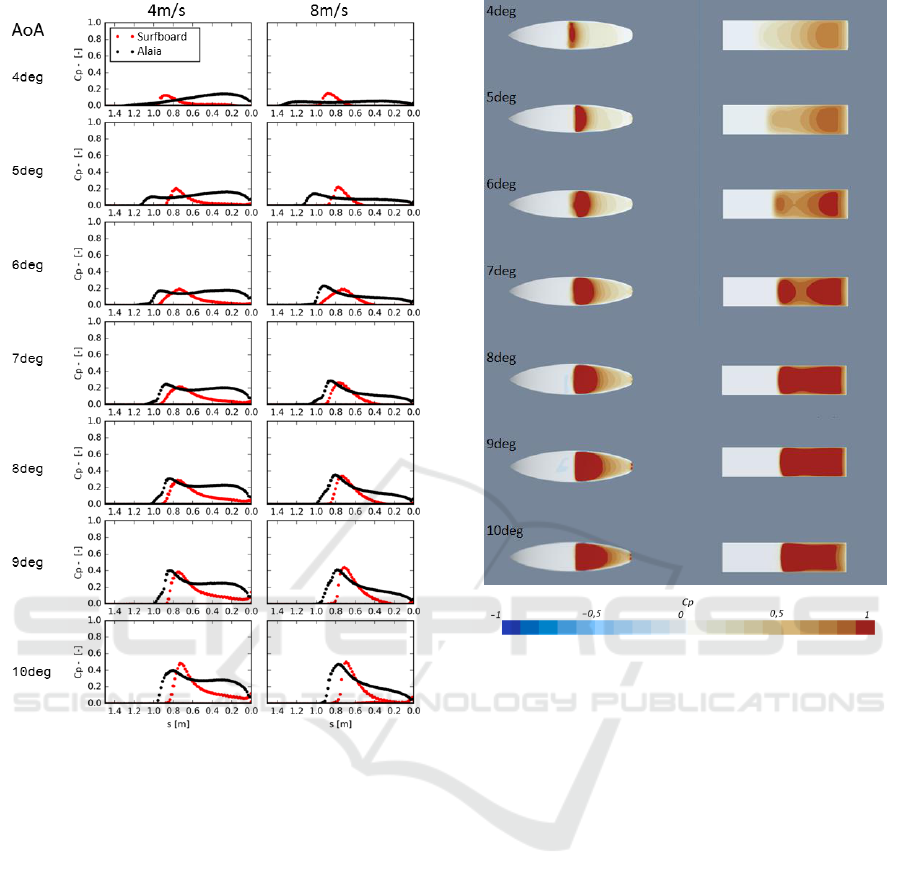
Figure 15: Pressure coefficient plots at the middle section
of the models: surfboard in red (●) and alaia in black (●).
Figure 15 shows how the pressure distribution
varies at different angles of attack on the alaia and
on the surfboard. Due to the increased curvature of
the bottom, the peak in pressure distribution on the
surfboard is constantly placed at ca. s=0.7m, close to
the front foot placement thus allowing the surfer to
always feel the same behaviour of the board under
his feet. It is also important to notice that the
pressure distribution at 4m/s and 8m/s is similar and
thus almost speed independent. The pressure
distribution of the alaia, on the other hand, varies
both with AoA and with speed, forcing the surfer to
apply continuous corrections in order to keep the
board balanced. It is also clearly noticeable that the
alaia has a larger wetted area, which directly reflects
on higher forces and higher pressure on the bottom
deck, resulting then in higher lift and drag.
Figure 16: Pressure distribution on the surfboard (left) and
alaia (right) at U=8m/s.
When analysing the 3D pressure contour plots on
the surfboard and on the alaia for 8m/s plotted in
Figure 16, the same behaviour noticeable in the
pressure distributions plots in Figure 15 can be
highlighted, with the surfboard keeping the
maximum pressure close to where the front foot is
placed and thus allowing a smoother ride to the
surfer without constant corrections. When
comparing the wakes generated by the surfboard and
the alaia (Figure 17) the wake generated by the
surfboard results clearly smaller than the wake
generated by the alaia, directly leading to a lower
drag. This is again due to the different tail shape and
bottom shape between the the two boards with the
alaia needing to move more water in order to be able
to travel at the same speed of the surfboard and thus
generating a wider and deeper wake.
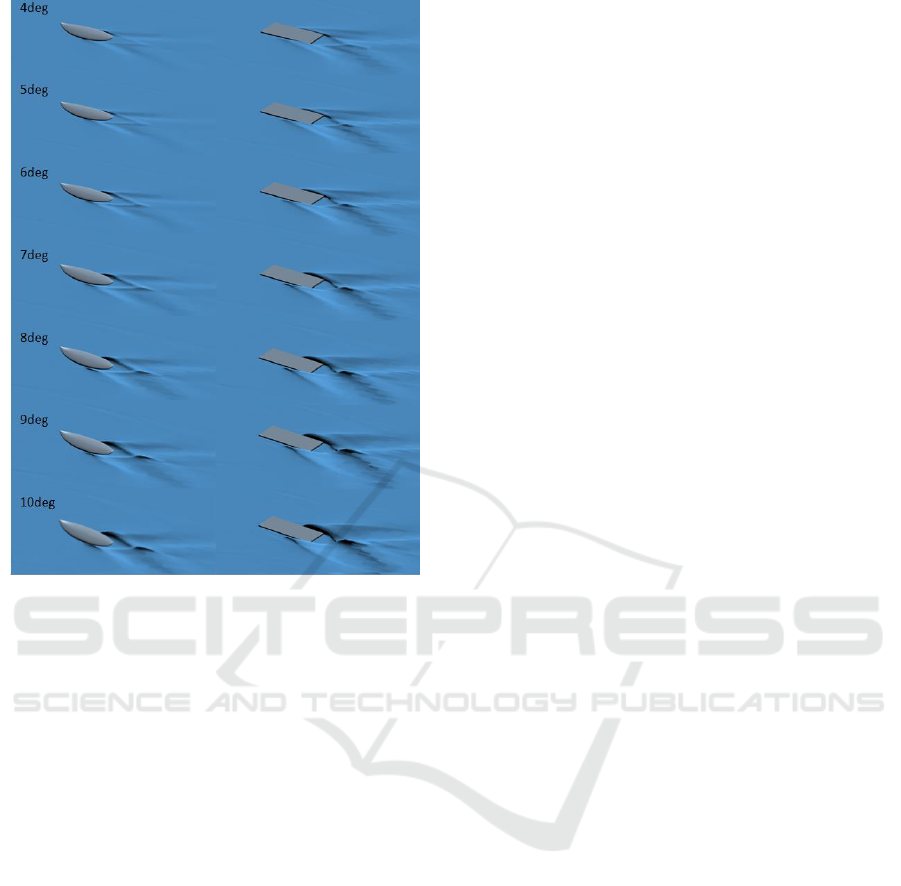
Figure 17: Free and wake development on the surfboard
(left) and alaia (right) at U=8m/s.
4 CONCLUSIONS
CFD simulations proved to be a useful tool and to
evaluate and compare the performances of a
surfboard against an alaia with the same aspect ratio.
The fixed model approach has is however only
useful if used for qualitative comparisons or design
since it does not take into consideration buoyancy
and trimming. Overall the performances of the
surfboard showed a clear superiority in longitudinal
stability when compared with the alaia while the
alaia, mostly due to the flat bottom inducing a larger
wetted area resulted to have higher drag but also
higher lift, however, the strong dependency of the
generated lift to speed and AoA and the placement of
the pressure on the bottom deck, lead to continuous
adjustments needed in order to stabilize the board.
ACKNOWLEDGMENTS
The author would like to thank Max Leinenbach for
providing the surfboard CAD model.
REFERENCES
Ferziger, J. H. & Peric, M. 2001. Computational Methods
for Fluid Dynamics, Springer - London.
Heimann, J. 2010. Surfing.
Hirt, C. W. & Nichols, B. D. 1981. Volume of Fluid (Vof)
Method for the Dynamics of Free Boundaries. Journal
of Computational Physics, 39, 201-225.
Kramer, M. R., Maki, M. J. & Young, Y. L. 2013.
Numerical Prediction of the Flow Past A 2-D Planing
Plate At Low Froude Number. Ocean Engineering, 70,
110–117.
Menter, F. R. 1994. Two-Equation Eddy-Viscosity
Turbulence Models for Engineering Applications.
Aiaa Journal, 32, 1598–1605.
Perry, B. 1952. The Effect of Aspect Ratio on the Lift of
Flat Planing Surfaces. Pasadena: Hydrodynamics
Laboratory California Insitute of Technology.
Taira, K. & Colonius, T. 2009. Three-Dimensional Flows
Around Low-Aspect-Ratio Flat-Plate Wings At Low
Reynolds Numbers. J. Fluid Mech., 623, 187–207.
Ubbink, O. 1997. Numerical Prediction of Two Fluid
Systems With Sharp Interfaces, Phd Thesis Submitted
To The University of London and Diploma of Imperial
College.
Warshaw, M. 2010. The History of Surfing.
White, F. M. 2016. Fluid Mechanics (8th Eidition),
Mcgraw-Hill Book Co, New York, USA.
Wilcox, D. C. 2006. Turbulence Modelling for Cfd, La
Canada, California, USA.
Zaïdi, H., Fohanno, S., Taïar, R. & Polidori, G. 2010.
Turbulence Model Choice For The Calculation of
Drag Forces When Using The Cfd Method. Journal of
Biomechanics, 10, 405-11.
