
Challenging Recommendation Engines Evaluation Metrics and
Mitigating Bias Problem of Information Cascades and Confirmation
Biases
Guillaume Blot
1
, Francis Rousseaux
2
and Pierre Saurel
1
1
SND, Paris-Sorbonne, France
2
CRESTIC, Reims Champagne Ardenne University, France
Keywords:
Recommender Engines, Link Prediction, Collaborative Filtering, Information Cascades, Confirmation Bias.
Abstract:
Digital knowledge gave birth to massive communication spaces, new access paths and new cleavages. Our
experiment deals with the challenging issue of accessing this knowledge on the Internet. Computer scientists
set up prediction algorithms and recommender engines. This way, knowledge access is partly automatized.
Using a real-life dataset, our goal is to simulate the iterative behavior shift produced by most used recom-
mender engines. On this basis, we show that in the context of recommendation, existing evaluation metrics
are driven by prediction testing methods and we argue that ambiguity has to be raised between prediction and
recommendation. Secondly, we propose alternative evaluation metrics for recommendation systems, targeting
mitigating the bias problem of information cascades and confirmation biases.
1 INTRODUCTION
Thanks to its ability to understand connections be-
tween items, the recommender engine is now an
undiscussed browsing feature, helping people to make
their next step through a large amount of possible
steps. Recommender engines are machine learn-
ing systems, looking for reasoning close to the hu-
man cognitive functions. Learning theory is one of
the main approaches of computational intelligence.
Recommender engines are based on two main ele-
ments: a matrix, where is structured user digital ac-
tivities and an operation that is typically either Col-
laborative Filtering (CF) or Link Prediction (LP).
This operation calculates a similarity coefficient be-
tween users or between items. Recommender en-
gines have been first integrated to e-business plat-
forms (Mayer-Schonberger and Cukier, 2013), and
then have reached other online practices, such as
social network, newspaper or also e-learning (Blot
et al., 2014). Depending on the context, items can
be e-business products, web pages, people, events or
e-learning resources. Regarding this wide horizon
of practices, recommending things to people should
not be considered inconsequential. Specifically when
these practices are automated with computational and
artificial intelligence methods. In this article, we
argue that existing evaluation measures for recom-
mender engines are computer-oriented and suffer of a
lack of human impact examinations. We don’t deny
the suitability of existing evaluation methods. Our
objective through this experiment is to raise ethical
concerns regarding the massive deployment of these
engines and enrich the pool of measurement in the in-
terest of the user.
When a user clicks on a recommended item, he
feeds the engine with a new information. This feed-
back enriches the initial dataset. As it was explained
by Adomavicius et al., this model produced a feed-
back loop, where users feed the engine, which in turn
feeds the users (Adomavicius et al., 2013). Here is
how the model is defined : in addition to its natural
cognitive functions, the user relies on artificial cogni-
tion functions (the engine), built with structured items
and AI algorithms. These artificial functions are com-
posed with a form of the user self-cognition aggre-
gated with a form of all other users cognitions. Nat-
ural biases tend to be impacted in this context. Here
we focus on information cascades and confirmation
bias. The first one relies on collective behavior and
the second one is a self-directed bias. One of our goal
is to demonstrate empirically, that in the presence of a
recommender, these biases might be emphasized, pro-
ducing behavior shifts. Here a user behavior is the
recorded trajectory through digital items. We mea-
sure how this trajectory is impacted by recommender
Blot G., Rousseaux F. and Saurel P.
Challenging Recommendation Engines Evaluation Metrics and Mitigating Bias Problem of Information Cascades and Confirmation Biases.
DOI: 10.5220/0006581803930400
In Proceedings of the 9th International Joint Conference on Computational Intelligence (IJCCI 2017), pages 393-400
ISBN: 978-989-758-274-5
Copyright
c
2017 by SCITEPRESS – Science and Technology Publications, Lda. All rights reserved

engines.
1.1 Information Cascades
This social phenomenon appears when an individ-
ual does something because other people are doing
it (Ellis and Fender, 2011). It is a conformist be-
havior which is considered as rational for most cases
(Bikhchandani et al., 1998), despite the fact it can lead
to plural ignorance (Katz and Allport, 1931). On the
Web, the infinity of choices should slow down this
phenomenon, as it was foreseen by Chris Anderson
(Anderson, 2006). But it is actually not the case, and
the main reason is because the transportation of in-
fluence between people has increased (Herring et al.,
2005). One of the major responsible phenomenon
is popularity. This has been observed in many con-
texts: blogs, musicians, digital collections and even
e-learning (Hindman et al., 2003) (Cha et al., 2007)
(Blot et al., 2015) (Beuscart and Couronn
´
e, 2009).
Our experiment shows how popularity is sometimes
polarizing recommender systems.
1.2 The Confirmation Bias
Confirmation bias is another natural cognitive phe-
nomenon that might be impacted by recommender
engines. An individual tends to give way to infor-
mation that confirm his initial trajectory and mini-
mize other true facts (Wason, 1968). It is observed
in our every day life with benign consequences, but
it is also observed in more critical contexts, where a
methodical spirit should rule any human bias, such as
justice decisions and scientific workshops (Wallace,
2015) (Austerweil and Griffiths, 2011). A significant
Web example of this phenomenon is Lada Adamic ex-
periment about political blogs connectivity during an
electoral campaign. He shows that 90% of inter-blogs
hyperlinks are referencing blogs defending the same
ideas (Adamic and Glance, 2005). To our knowledge,
there is no observation about the impact of recom-
mender engines on this bias.
1.3 The Concept of Recommendation
One can take any scientific article, in any case the def-
inition of an accurate recommender engine is when it
can predict a user future trajectory. Here are some ex-
amples (Schr
¨
oder et al., 2011) (
¨
Ozlem
¨
Ozg
¨
obek et al.,
2014) (Arekar et al., 2015). This is understood as if
we had to suggest to people, actions that they are al-
ready planning to do. But, if we can predict that this
user will consume this item, why shall we recommend
it? Shall we have no better items to recommend? For
example an item that the user would not visit natu-
rally, enriching so its experience. Does the concept of
relevance has to be the same for both prediction and
recommendation?
In this article we test the following hypothesis
: prediction methods improve information cascades
and collaborative filtering methods improve confirma-
tion bias. We argue that disconnecting the two con-
cepts (prediction versus recommendation) is a major
concern. Because freed up from Prediction, Recom-
mendation might evolve toward a more relevant in-
tent, more in depth focus with the concept. In the
following section, we present some significant evalu-
ation measures and our experimental ones. In section
3, we explain our experiment and present the real-life
dataset. In section 4 we present our results and then
we raise ethical concerns.
2 RELATED WORK
The wide variety of recommender dimensions implies
a wide variety of evaluation metrics. In this section,
we give an overview of evaluation methods within the
scope of our article purpose. A more exhaustive sur-
vey can be found here (Avazpour et al., 2014).
2.1 Evaluating Recommender Engines
2.1.1 Accuracy, Precision, Recall
Accuracy measures the ability to predict a user rating.
Precision is the proportion of recommendations that
are good recommendations. Recall is the proportion
of good recommendations that appear in top recom-
mendations. All these metrics are based on relevance.
A relevant recommendation is a recommended item
that has been actually consumed by the user.
2.1.2 Coverage
Data-mining techniques implies a preprocessing step
where data are extracted, cleaned and organized. The
final step of this overall process is the actual running
of the engine through a well-prepared and clean ma-
trix. But, for many reasons this complicated opera-
tion might make some part of the dataset unavailable.
Distributed dataset, hugeness, real-time execution or
difficulty to qualify data might be the reason.
Coverage measures the ability to cover the overall
set of items or users (Ge et al., 2010).

2.1.3 Diversity
Diversity measures the ability to recommend a set of
dissimilar items. These items are dissimilar all to-
gether, but each has to be similar with the user back-
ground. This is interesting to evaluate the tendency of
an engine to show off the items diversity (Candillier
et al., 2011).
2.1.4 Novelty
Novelty is the ability to recommend items that are
new for the user. Measuring novelty is an intricate
task, but it can be done by comparing unpopular items
with the recommended items. This approach con-
sider that popular items are already known by the user
(Shani and Gunawardana, 2011).
2.1.5 Serendipity
Serendipity is an unexpected and beneficial recom-
mendation. It refers to items believed to be dissimilar
to a user background, but that are actually proved to
be relevant items (Ge et al., 2010). According to Pek
Van Andel and Dani
`
ele Bourcier, serendipity is a true
interpretation of a surprising observation (Bourcier
and Van Andel, 2011).
2.2 Correcting Recommender Engines
2.2.1 The Gray Sheep Problem
Recommender engines are working with collaborative
rules. As a result, recommendations go toward the
common interest. It means that singular behaviors are
incompatible. Gray sheep is a significant issue, but
no proper measure exists to evaluate the phenomenon,
even though some interesting mechanisms propose to
track singular trajectories (Blot et al., 2014). Our ex-
periment also cover that matter, thanks to the confir-
mation measure.
2.2.2 Regency and User Changes of Interests
Freshness of items decreases through the time. Re-
gency is the ability of the model to integrate this fluc-
tuations. Similar dynamics are observe with users,
who might change their interests. Unlike our purpose,
the objective here is not to enrich a user with another
interest. But, it is the opposite. That is to say, tracking
changes in order to adjust recommendations.
2.2.3 De-biasing Engines
Reducing biases effects is an issue. One approach is
to plug de-biasing features to existing methods. For
example by tracking freshness and interests fluctu-
ations (Yehuda, 2009). This leads to an increased
complexity of the model. On the other hand, another
method is to simplify the model. For example, rat-
ings tend to accentuate the anchoring effect. This ex-
periment proves that reducing rating system from five
stars to a binary system, leads to a more accurate en-
gine (Adomavicius et al., 2014).
2.3 Our Experimental Measures
In this article, we want to challenge accuracy, preci-
sion and recall. These measures might be abusively
used. That observation seems to be shared with oth-
ers, who think that there is something beyond accu-
racy (Ge et al., 2010).
Here we unveil our three experimental measures
with a new evaluation workflow. We discover for each
item which is the most similar item. So we obtain
two sets: the initial dataset and the recommendation.
These elements can be represented as an associated
array, with a (key, value) mechanism, where the key
is an item and the value is the corresponding most
similar item.
2.3.1 Confirmation
Our objective is to measure the ability to recommend
items that are besides the users predicted trajectories.
In a sense, this could be linked with novelty and even
serendipity measures. But as we mentioned, novelty
is an intricate measure, and for the moment, the best
technique is to rely on items popularity. Yet, pop-
ularity is a social phenomenon, where a user trajec-
tory should be more personal. Hypothetically, our
confirmation measure also addresses novelty and gray
sheep problem.
In this experimental approach, we need to know
meta information related to items. For example, deal-
ing with web pages, item categories can be suitable
meta information, as far as it comes from a large and
reliable nomenclature. Then the predicted trajectory
of a user are all items from the same category (we
validate this choice in next section, showing the user
tendency to circulate throuh items from the same cat-
egory). We introduce two degrees of measurement,
where R(i) is the most similar item for i (the Recom-
mended item), T (i) is the supposed trajectory for this
item i and T
2
is the trajectory plus its adjacent trajec-
tories.
C =
∑
i∈I
(T
R(i)
∩ T
i
)
I
(1)
C
2
=
∑
i∈I
(T
2
R(i)
∩ T
i
)
I
(2)

2.3.2 Popularity Influence
Popularity Influence measures the tendency to recom-
mend popular items. This measure works with the
Head and Long Tail classification (Anderson, 2006).
This relies on the fact that, considering a set of items,
classical distribution of users and items interactions is
a power law, where few items are very popular (head)
and the rest of the set tends to be forgotten (long tail).
This is observed in many contexts (Hindman et al.,
2003) (Cha et al., 2007) (Blot et al., 2015) (Beuscart
and Couronn
´
e, 2009).
PI =
∑
i∈I
(R(i) ∩I
Head
)
I
(3)
Popularity Influence is a ratio of popular items in
the recommendations. In the formula, IHead is the
initial head, composed with the 20% of the most pop-
ular items. From this formula we can formalize our
own definition of novelty:
N =
∑
i∈I
(R(i) ∩ I
LongTail
)
I
(4)
2.3.3 Widening
Widening is the ability to recommend a large selec-
tion of the initial set. It is slightly different from nov-
elty and diversity measures. An engine might have
a strong novelty coefficient, but might systematically
keep recommending the same items. Also, where di-
versity focuses on dissimilarity within recommenda-
tions, widening measures the tendency to recommend
a wide range of items.
W =
R(i)
I
(5)
3 EXPERIMENT
Our empirical approach relies on a real-life dataset.
This dataset is used to build a matrix, that can be item-
based or user-based. Here, we use item-based (Sar-
war et al., 2001). Four techniques are run through the
dataset. In this section we present the recommenda-
tion techniques, the dataset, the item-based structure
and we explain our choices.
3.1 Running Engines
The principle is to calculate a Similarity index for all
associations of items.
Table 1: Real-life Dataset Graph Structure Overview.
Statistics Results
Nodes 7000
Edges 13081
Users 25728
Type Undirected
Graph Density 0.001
Average Degree 3.74
Avg. Weighted Degree 7.35
Modularity 0.296
Avg. Clustering Coef. 0.308
Avg. Path Length 3.51
Confirmation 0.25
3.1.1 Local Link Prediction
An item-based matrix is considered as the adjacency
matrix of a graph. Link prediction methods search for
future relevant links. Local similarity only considers
neighbors.
• Common Neighbors (CN): similarity is the inter-
section between neighbors of the items.
• Adar & Adamic (AA): similarity is giving more
credit to links of weak ties (Adamic and Adar,
2005).
3.1.2 Collaborative-Filtering
Items are vectors in a I dimensional space, where I is
the number of items.
• Correlation-based (COR): similarity is based on a
Pearson-r correlation.
• Cosine-based (COS): similarity is measured with
the angle between two vectors.
3.2 Real-life Dataset
Our application context is Web browsing. The real-
life dataset is composed with users, items (web
pages), timestamps and items categories. Other in-
formation that we did not used were available. It
has been downloaded on Kaggle.com
1
, a web shared
platform for datasets and relative applications. This
dataset is provided by Outbrain, a global company
that develops recommender engines. The dataset was
made available in the context of a competition, featur-
ing 1302 competitors and a $25.000 award.
The dataset was huge: several billions of user,
item interactions and a CSV file up to 100GO. Our
experiment focuses on 2% of this dataset.
1
https://www.kaggle.com/c/outbrain-click-prediction
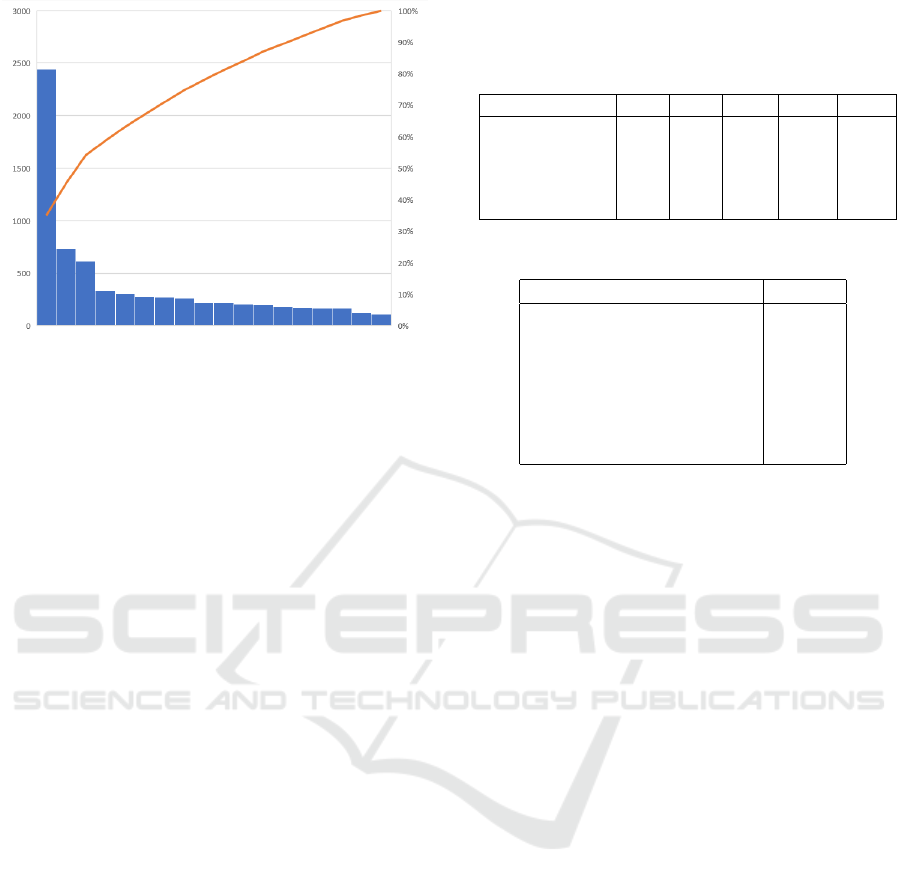
Figure 1: Real-life dataset Distribution represented with a
Pareto Graph. In blue, the popularity of items ordered from
the most to the less. In red, the cumulative subset of items
considered.
3.3 Structuring Data
This section explains how we transform 25728 users
activities into a weighted and undirected graph
G(n, e) composed with 7000 items n and 13081 edges
e (Table 1). This is considered as a large graph.
The first step was defining a connection principle
between items. Our principle is to connect two items
when they are successively visited by the same user.
The resulting graph has a low density (0.001). Mod-
ularity and clustering coefficients are average (0.296
and 0.308). It means that some clusters of items are
observed. In parallel, we calculate an initial confir-
mation (0.25), which means that 25% of the natural
connections are made between items from the same
category. So there are clusters of category. That val-
idates our choice of meta information for the confir-
mation measure.
Moreover, Figure 1 represents the distribution of
the initial dataset. We observe a power law, with the
head composed with few popular items and the un-
popular long tail. The orange line shows the addi-
tional amount of items.
4 RESULTS AND COMMENTS
4.1 Impacts on Confirmation Bias
Table 2 shows our experimental measures for all
methods. We have a wide variety of cate-
gories/trajectories: 88. If we generate random recom-
mendations, the confirmation index is 0.01. In real-
life, we observe a first degree confirmation between
Table 2: Results for all experimented methods: CN = Com-
mon Neighbors, AA = Adar Adamic, COS = Cosine-Based
and COR = Correlation-Based. RAN is an evaluation of a
random engines.
Indices CN AA COS COR RAN
Confirmation 0.16 0.18 0.15 0.15 0.01
Sec. Deg. Conf. 0.97 0.96 0.92 0.92 0.3
Popularity 0.89 0.83 0.22 0.21 0.2
Novelty 0.11 0.17 0.78 0.79 0.8
Widening 0.15 0.23 0.36 0.35 1
Table 3: Category Graph Structure Overview.
Statistics Results
Number of Nodes 88
Average Degree 26.25
Avg. Weighted Degree 356.98
Graph Density 0.302
Avg. Clustering Coefficient 0.713
Modularity 0.069
Avg. Path Length 1.716
0.15 and 0.18, depending on the engine. In order to
analyze the second degree confirmation coefficient,
we have generated a category graph, which is a graph
injection from the item set toward the category set.
Table 3 presents statistic about this graph. For second
degree, a random engines is supposed to confirm user
initial trajectory at 30%. But in real-life, we observe
a second degree confirmation between 0.92 and 0.96.
4.2 Impacts on Information Cascades
4.2.1 Popularity and Novelty
How popularity dynamics impact our engines? Here
we notice a significant gap between results, with a
popularity index between 0.21 and 0.89. A result
around 0.2 is neutral (random engines is 0.2). It
means that the engine is not influenced by the phe-
nomenon of popularity. At the opposite, some meth-
ods are very influenced by the popularity, with for ex-
ample CN (89% of recommendations are from the ini-
tial head). To make one last comment, following our
definition, we notice that novelty is the mirror of pop-
ularity.
4.2.2 Recommendation Distribution
Widening is between 0.15 and 0.36. The ideal coef-
ficient is 1, which means that 100% of the items are
recommended once. Despite some divergences, we
observe that no method is able to open its recommen-
dations to a wide portion of the initial dataset. Some
methods are not wide but have a high level of novelty.
For example, the CB engine recommends 35% of the
items and has a neutral popularity influence. It means
that the relatively small portion of recommendations
are chosen from the entire data set. Besides, AA en-
gine has a 0.23 widening coefficient oriented toward
the initial head at 83%.
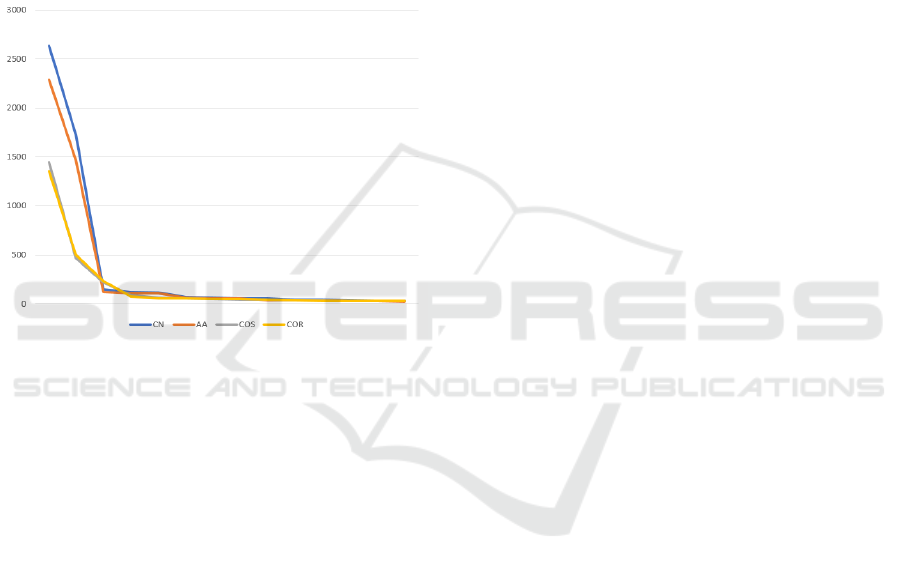
In figure 2 we observe that all recommendation
distributions are fitting a power law. Some items tend
to be more recommended than other. It is not a sur-
prise, because widening coefficient are low. We ob-
serve a correlation between widening coefficients and
the shape of the distribution curves. Low widening
coefficients have higher head and longer tail and re-
ciprocally.
Figure 2: Recommended Items Distribution for each exper-
imented method.
4.3 Link Prediction Versus
Collaborative Filtering
Significant divergences are observed, specifically
between Link prediction (LP) and Collaborative-
filtering (CF) methods. LP seems to be much more
impacted by biases, with a higher influence from so-
cial phenomena such as popularity (0.89 for CN and
0.83 for AA). We also observe a lower widening ten-
dency between 0.15 and 0.23. Confirmation impact is
also a bit higher.
CF does not suffer at all from popularity influence.
As a result it has a better ability to recommend wide
items. This can be explained by their paradigm which
search for similarities everywhere, whereas LP are
local methods and only consider neighbors. On the
other hand, confirmation evaluations show that these
methods are significantly impacted by the confirma-
tion bias. It is not clear if the evaluated confirma-
tion is from individual or social source. But, we can
give a reliable observation. Engines getting social im-
pacts, such as poor novelty appears to confirm more
users initial trajectories. It is not very significant (0.03
and 0.04 differential for first and second degree). In a
sense, it shows that our definition of confirmation bias
is a bit more a social, rather than individual. Glob-
ally our results prove that recommender engines invite
people to confirm their initial trajectories.
5 CONCLUSION
5.1 Discussion and Recommendations
Of course an individual is not exclusively driven by
a recommender engine. He has natural capabilities to
understand and counteract unwanted situations such
as plural ignorance, conformism or extremism. But,
this implies a methodical spirit in all circumstances
(Origgi, 2015) (Bronner, 2013). As we have just seen,
users trajectories are impacted and machine-oriented
recommendations are in part responsible.
We have shown that main engines reproduce cog-
nition biases in a very significant way, where the en-
gine processes an artificial form of our self cognition.
We have reminded that the model is evolving as an
infinite loop where natural (human) and artificial (en-
gine) systems apply mutual influences. Progressing
within this dynamic, the model amplifies biases. This
creates an infinite iterative shift, that participates to
the emergence of dangerous behaviors. We remind
here (but not prove it systematically), that informa-
tion cascades and confirmation biases can lead to un-
rationnal cases of plural ignorance, conformism and
extremism. We have also presented related optimiza-
tions such as de-biasing methods. But, both axis of
optimization have limitations: complexity or simplic-
ity.
Our experiment proves that the impact vary de-
pending of the typology of the recommender. CF and
LP are impacted by the confirmation bias. But, we
have highlighted divergences between CF and predic-
tive methods. LP presents the ideal mechanism to
generate information cascades. It is not a surprise,
because as a definition an effective predictive model
will recommend items that the user is going to visit
in the future anyway. That’s why we recommend a
reevaluation of the term relevance in the scope of rec-
ommendations. To our opinion, an engine suggesting
items that confirm the initial trajectory of the user is
not relevant. Novelty, widening, diversity or confir-
mation should be more relevant evaluations.
With this being said, we believe that using pre-
diction instead of recommendation is interesting for
one purpose: the marketing. Triggering now a user
action because predictions say that this user will do

the action in the future, is a marketing manipula-
tion. Indeed, these methods have been invented for
e-business purposes (Mayer-Schonberger and Cukier,
2013). But unfortunately, in the present state, they are
not relevant for other domains such as digital collec-
tions, e-learning or also social networks.
5.2 Limits and Further Work
We are aware that our experiment is subject to limi-
tations. Some limitations may be pushed away with
further work.
• Multiplying empirical experiments with a similar
methodology, relying on large, reliable and vari-
ous datasets. Moreover, meta information that we
have used in confirmation measure, is difficult to
obtain. Other data might be used. In addition, we
have chosen to connect successively visited items.
It’s a common way to structure users activities.
But, some other models of interactions might be
experimented.
• Formalizing mathematical validations: repro-
ducing empirical demonstrations should not be
enough to fully validate our purpose. Mathemati-
cal demonstrations should be given.
• Experimenting in real-time: working with termi-
nated user activities makes a key factor invisible:
whether or not the user has been influenced by
the suggestion. Experimenting in real-time should
help to concretely measure the impact and con-
ceptualize the mutual influences.
• Organizing a longitudinal study: another way to
represent the iterative shift is by observing trajec-
tories and influences other a larger period. This
can give access to several views, that we could
compare through a longitudinal representation.
REFERENCES
Adamic, L. and Adar, E. (2005). Friends and neighbors on
the web, in social networks.
Adamic, L. and Glance, N. (2005). The political blogo-
sphere and the 2004 u.s election: Divided they blog. In
3rd international workshop on Link discovery, pages
36–43.
Adomavicius, G., Bockstedt, J., Shawn, C., and Zhang, J.
(2014). De-biasing user preference ratings in recom-
mender systems. In Interfaces and Human Decision
Making for Recommender Systems, Foster City, USA.
Adomavicius, G., Bockstedt, J. C., Curley, S. P., and Zhang,
J. (2013). Do recommender systems manipulate con-
sumer preferences? a study of anchoring effects. Info.
Sys. Research, 24(4):956–975.
Anderson, C. (2006). The Long Tail: How the Future of
Business is Selling Less of More. Hyperion Books,
New York, USA.
Arekar, T., Sonar, S., and Uke, J. (2015). A survey on rec-
ommendation system.
Austerweil, J. and Griffiths, T. (2011). Seeking confirma-
tion is rational for deterministic hypotheses.
Avazpour, I., Pitakrat, T., Grunske, L., and Grundy, J.
(2014). Dimensions and Metrics for Evaluating Rec-
ommendation Systems, pages 245–273. Springer
Berlin Heidelberg, Berlin, Heidelberg.
Beuscart, J.-S. and Couronn
´
e, T. (2009). The distribution
of online reputation: Audience and influence of musi-
cians on myspace. In ICWSM Conference, pages 36–
43, San Jose, USA.
Bikhchandani, S., Hirshleifer, D., and Welch, I. (1998).
Learning from the behavior of others: Conformity,
fads, and informational cascades.
Blot, G., Rousseaux, F., and Saurel, P. (2014). Pattern dis-
covery in e-learning courses : a time based approach.
In CODIT14, Metz, France. IEEE.
Blot, G., Saurel, P., and Rousseaux, F. (2015). Recom-
mender engines under the influence of popularity. In
6th International MCETECH Conference, Montreal,
Canada. IEEE.
Bourcier, D. and Van Andel, P. (2011). La s
´
erendipit
´
e - Le
hasard heureux. Hermann.
Bronner, G. (2013). La d
´
emocratie des cr
´
edules. Presses
universitaires de France, Paris, France.
Candillier, L., Chevalier, M., Dudognon, D., and Mothe,
J. (2011). Diversity in recommender systems: bridg-
ing the gap between users and systems. In CENTRIC,
page 48–53.
Cha, M., Kwak, H., Rodriguez, P., Ahn, Y.-Y., and Moon,
S. (2007). I tube, you tube, everybody tubes. In
7th ACM SIGCOMM conference on Internet measure-
ment, New York, USA.
Ellis, C. and Fender, J. (2011). Riots, revolutions,
democratisation, and information cascades. In VOX.
CEPR.
Ge, M., Delgado-battenfeld, C., and Jannach, D. (2010).
Beyond accuracy: evaluating recommender systems
by coverage and serendipity. In In RecSys ’10, page
257.
Herring, S., Kouper, I., Kouper, J., Scheidt, L.-A., Tyworth,
M., Wright, P., and Ning, Y. (2005). Conversations in
the blogosphere: An analysis ”from the bottom up”.
Hawaii.
Hindman, M., Tsioutsiouliklis, K., and Johnson, J. (2003).
Googlearchy: How a few heavily-linked sites domi-
nate politics on the web. In Annual Meeting of the
Midwest Political Science Ass.
Katz, D. and Allport, F. H. (1931). Students’ Attitudes:
A Report of the Syracuse University Reaction Study.
Craftsman Press, New York, USA.
Mayer-Schonberger, V. and Cukier, K. (2013). Big Data: A
Revolution That Will Transform How We Live, Work,
and Think. HAL.
Origgi, G. (2015). La r
´
eputation. Presses universitaires de
France, Paris, France.

Sarwar, B., Karypis, G., Konstan, J., and Riedl, J. (2001).
Item-based collaborative filtering recommendation al-
gorithms. In Proceedings of the 10th International
Conference on World Wide Web, WWW ’01, pages
285–295, New York, NY, USA. ACM.
Schr
¨
oder, G., Thiele, M., and LehnerGunnar, W. (2011).
Setting goals and choosing metrics for recommender
system evaluations. In 5th ACM Conference onDres-
den University of Technology Recommender Systems.
Shani, G. and Gunawardana, A. (2011). Evaluating Rec-
ommendation Systems, pages 257–297. Springer US,
Boston, MA.
Wallace, W. (2015). The effect of confirmation bias on
criminal investigative decision making. Walden Uni-
versity.
Wason, P. (1968). Reasoning about a rule.
Yehuda, K. (2009). The bellkor solution to the netflix grand
prize.
¨
Ozlem
¨
Ozg
¨
obek, Gulla, J. A., and Erdur, C. (2014). A sur-
vey on challenges and methods in news recommenda-
tion.
