
Modeling of C-SNARF-1 pH Fluorescence Properties:
Towards Calibration Free Optical Fiber pH Sensing for in Vivo
Applications
Rutjaphan Kateklum
1
, Bernard Gauthier-Manuel
1
, Christian Pieralli
1
,
Samlee Mankhetkorn
2
and Bruno Wacogne
1,3
1
FEMTO-ST Institute, Univ. Bourgogne Franche-Comté, CNRS, 25030 Besançon cedex, France
2
Center of Excellence in Molecular Imaging, Chiang Mai University, 50200 Chiang Mai, Thailand
3
INSERM CIT1431, Besançon University Hospital, 25000 Besançon, France
Keywords: in Vivo pH Sensing, Fluorescence, Optical Fiber, pH Sensor, Modelling, Calibration Free Measurement.
Abstract: Organic functions of the human body are related to biological constants. Variations of these constants, among
them pH, induce pathological troubles. The general goal of our work is to fabricate a fluorescent pH sensor
at the end of an optical fiber for in vivo pH measurements. One difficulty using fluorescence indicators is the
need to perform an accurate calibration. In this communication, we present methods used to simplify and
potentially avoid calibration procedures of fluorescence indicators. The first method concerns the
simplification of calibration procedures making them independent of the indicator’s concentration, path length
and equipment used. The second method concerns modelling the fluorescence emission of the molecules as a
function of pH only. This model is used to fit the exact shape of C-SNARF-1 fluorescence spectra obtained
at any pH. Subsequently, the pH of a solution can be computed with an accuracy of 0.1 pH unit without the
calibration procedure employed up to now. These methods constitute the first steps toward calibration free
pH measurements. They can be applied to any fluorescent indicator exhibiting a dual emission peak. As a
conclusion, this is the first time that fluorescence properties of C-SNARF-1 are fully mathematically
described.
1 INTRODUCTION
In living beings, biological functions are related to
either acid or alkaline constants. Indeed, the action of
a protein depends on the surrounding pH. An
inadequate value of the pH makes the proteins non
active which is deleterious for the organism. A lot of
pathologies induce or are the consequence of pH
dysregulation. There exist a need for pH sensors
which can be used in the human body. Among the
wide range of technologies potentially useful for this
application, fiber optic fluorescence pH sensing is a
promising technique for in vivo measurements. The
general goal of our work is depicted in figure 1.
Ideally, such a pH sensor should be used in a
calibration free manner. For this, the pH sensitive
molecules to be grafted at the end of the optical fiber
should be chosen with great care. They must exhibit
fluorescence properties which can potentially lead to
the desired calibration free measurement.
In this communication, we present the part of the
pH sensor’s development devoted to this issue.
Figure 1: Schematic diagram of the fiber optic pH sensor
under development.
Kateklum, R., Gauthier-Manuel, B., Pieralli, C., Mankhetkorn, S. and Wacogne, B.
Modeling of C-SNARF-1 pH Fluorescence Properties: Towards Calibration Free Optical Fiber pH Sensing for in Vivo Applications.
DOI: 10.5220/0006514300170024
In Proceedings of the 11th International Joint Conference on Biomedical Engineering Systems and Technologies (BIOSTEC 2018) - Volume 1: BIODEVICES, pages 17-24
ISBN: 978-989-758-277-6
Copyright © 2018 by SCITEPRESS – Science and Technology Publications, Lda. All rights reserved
17

Fluorescent indicators can be divided in three
main classes (Valeur, 2001). These classes depend
whether or not molecules undergo photoinduced
proton or electron transfer, or none of them. C-
SNARF-1 (5-(and-6)-Carboxy SNARF®-1) belongs
to this last class. When in solution, this indicator
exists under two forms: the acidic (or protonated)
form and the basic (or deprotonated) form. The acid-
base reaction equilibrium is driven by the law of mass
action.
C-SNARF-1 exhibits a pKa equal to 7.5 which
makes it a good candidate for sensing in the
physiological pH range. As previously mentioned,
this indicator exhibits only two forms. Therefore, the
fluorescence signal is due to the contribution of these
two forms with relative contributions depending on
the pH of the solution under test. Each protonated or
deprotonated form exhibits characteristic
fluorescence and/or absorption spectra (Yassine,
1997). Shifts between spectra obtained for protonated
and deprotonated species can be exploited in order to
perform a ratiometric measurement. In this case, pH
is directly related to the ratio of the fluorescence
intensities measured at 2 wavelengths which are
characteristic of the indicator used.
However, the reality is a bit more complicated
because a calibration of the molecules in solution
must be performed. Indeed, pH is related to the
activity of H
+
ions and not their concentration. This
make pH determination dependent on factors like
ionic strength, specific interactions depending on the
chemical nature of the indicator and the surrounding
medium as well as structural changes of the medium
(Valeur, 2001). Calibration procedure will be
described in section 2 together with the method we
propose to considerably simplify the procedure.
Note that, to the best of our knowledge, no
simplification of the calibration has been proposed to
date, except a proposition to perform in situ
calibration using nigericin (Negulescu, 1990).
However, this method may not be applicable in all
situations.
In this communication, we also propose a method
which potentially can lead to a calibration free pH
measurement. This method is based on a
mathematical description of the emitted fluorescence
spectra as it will be exposed in section 3. Some
authors developed mathematical models in order to
account for different difficulties encountered in
specific applications. For example in (Zurawik,
2016), authors developed a model to account for the
small number of free H
+
ions in the yeast
mitochondria. In reference (Bottenus, 2009) authors
study the pH behavior in nanochannels. In this case,
the ζ potential is responsible for charges
reorganizations in the channels. In this case however,
fluorescence properties of C-SNARF-1 are described
in a “law of mass action” approach.
Some authors proposed a more mathematical
description of fluorescence properties. In (Ribou,
2002) for example, authors propose to extend the two
wavelength ratiometric method to the analysis of the
whole fluorescence spectrum. Their approach
consists in recording the spectra of both fully
protonated and fully deprotonated forms of SNARF.
These two extreme pH spectra form a basis which is
now used to fit a spectrum recorded at an unknown
pH.
In reference (Owen, 1992 (1 and 2)) authors
employ the same method based on fitting an unknown
spectrum with spectra measured at extreme pHs. The
motivation is that ratiometric measurement are based
on measuring ratios at two distinct wavelengths with
known solutions in order to compute the ratio at
unknown pH with values obtained at two
measurement wavelengths. In other words, they
explain that using two equations to solve two
unknowns does not allow accounting for other
phenomena which can jeopardize the pH
measurement.
Surprisingly, it should noted that, except work
presented in (Zurawik, 2016; Bottenus, 2009), pH
measurement difficulties have poorly been addressed
recently, despite the availability of compact
spectrometers and powerful calculation software
which makes mathematical treatment of spectra easy.
In what follows, section 2 is devoted to a new
method which considerably simplify the calibration
procedure while section 3 deals with first steps
towards calibration measurements. Then, a
conclusion will be proposed in section 4.
2 SIMPLIFYING CALIBRATION
PROCEDURES
Here, we mathematically express the evolution of the
emitted energy as a function of pH and excitation
wavelengths. This expression can be used to post-
process spectra which substantially simplify
calibration procedures.
2.1 About the Current Calibration
Procedure
As previously mentioned, C-SNARF-1 is a pH
indicator exhibiting a dual emission peak. This is
BIODEVICES 2018 - 11th International Conference on Biomedical Electronics and Devices
18
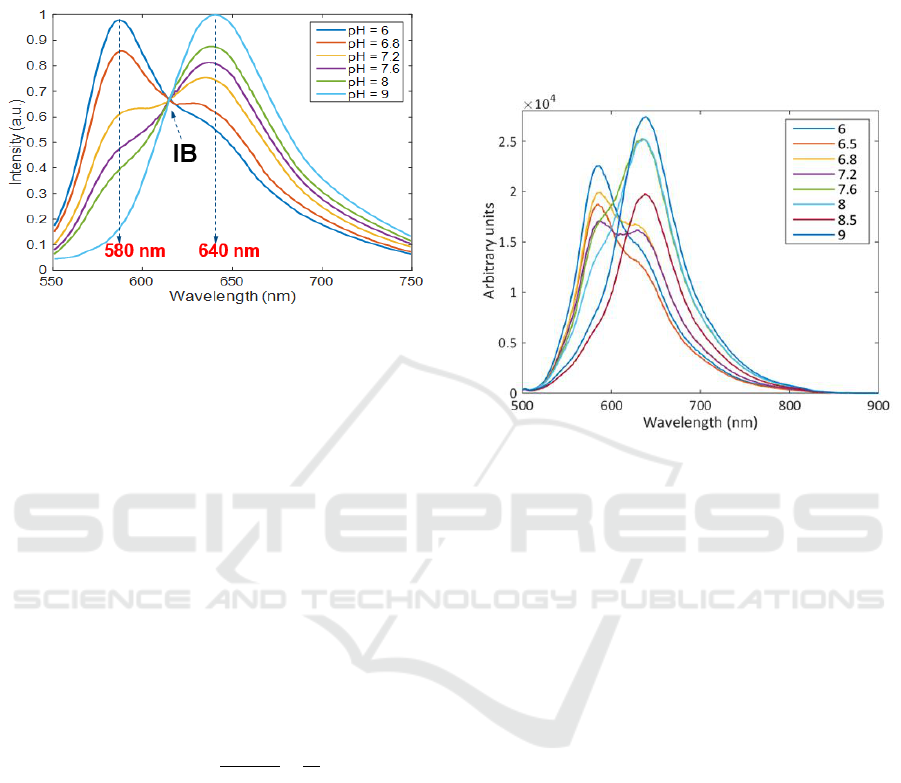
illustrated in figure 2. pH can be deduced from the
intensity ratio at wavelengths corresponding the
maxima emission of both protonated and
deprotonated forms.
Figure 2: pH dependency of C-SNARF-1 molecules
(Thermofisher, no year).
The two wavelengths used for this so-called
ratiometric measurement are 580 nm and 640 nm for
this molecule. However, measuring the fluorescence
emission ratio at two distinct wavelengths does not
lead to an exact determination of pH. Indeed, the
indicator must be calibrated using two extreme pH
solutions for which ratios at measurement
wavelengths are calculated. The calibration
procedure can be found either in the manufacturer
website (Thermofisher, no year) or in various
publications (Whitaker, 1991; Ribou, 2002; Graber,
1986; Bancel, 1990). This is illustrated in equation
(1). Values of R and I coefficients can be found in
(Thermofisher, no year). They represent intensity ratios
at specific wavelengths.
(1)
Calibration requires extreme care when
performing measurements as explained in
(Grynkiewics, 1985) in the case of calcium detection.
Adapted from this reference: “any intervening loss of
dye or changes in instrument sensitivity jeopardizes
the calibration and may be mistaken for a change in
[H
+
]”.
2.2 About the Difficulty to Perform
Calibrations
When extreme care is not taken, spectra obtained with
calibration solutions undergo variations of their
intensities. The isosbestic point (IB in figure 2) no
longer exists and calibration becomes impossible.
This is illustrated in figure 3 where spectra recorded
using basic equipment were obtained. They were
recorded using basic plastic cuvette manually placed
in front of a fluorescence beam-splitter. Therefore,
path-length and multiple reflections in the plastic
cuvette were not controlled, maxima of the spectra
were randomly distributed, and no isosbestic points
was observed.
Figure 3: Spectra obtained using basic equipment.
2.3 Simplifying the Calibration
Procedure
The method we propose is based on the fact that the
emission fluorescence energy does not only depend
on pH but also on the excitation wavelength. By
energy, we understand the integral of the fluorescence
spectra.
Here, we mathematically express the evolution of
the emitted energy with pH and excitation
wavelengths. This equation can now be used to post-
process spectra like those presented in figure 3,
recalculate the energy they should exhibit and retrieve
the existence of the isosbestic point.
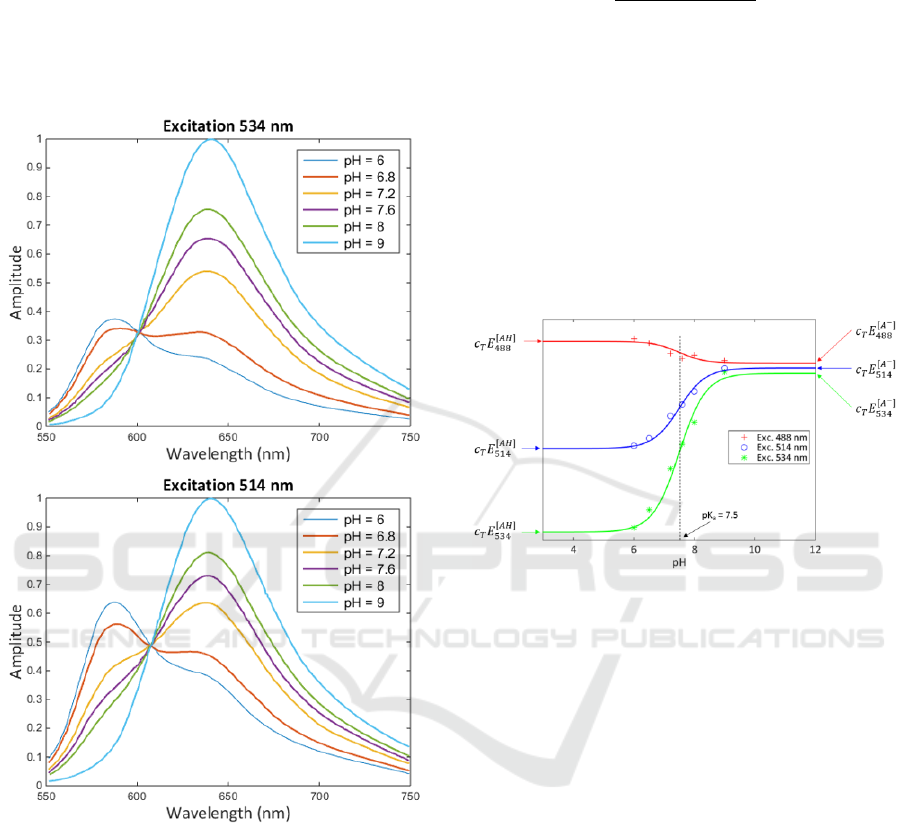
Looking at emission spectra for 2 excitation
wavelengths given by the supplier (figure 4)
(Thermofisher, no year), variations of the energies with
pH and excitation wavelength are clearly visible. In
fact, 3 excitation wavelengths are available from
(Thermofisher, no year) but only 2 sets of spectra are
shown for clarity. In the mathematical development
presented below, the 3 excitation wavelengths are
taken into account.
To describe the evolution of the energies with pH,
we must consider contributions of the protonated and
deprotonated forms. For an excitation wavelength λ
ex
at pHi, the energy can be written as follows.
Modeling of C-SNARF-1 pH Fluorescence Properties: Towards Calibration Free Optical Fiber pH Sensing for in Vivo Applications
19
(2)
In equation (2),
and
represent the
concentration in deprotonated and protonated forms
respectively,
and
represent the energy
emitted by the deprotonated and protonated forms
respectively.
Figure 4: Spectra from supplier for 2 excitation
wavelengths (Thermofisher, no year).
It is often interesting to express concentrations in
terms of dissociation degree of the molecules. The
dissociation degree allows describing proportions in
the protonated or deprotonated form from the total
concentration in indicator as follows. If we note α the
dissociation degree and c
T
the total indicator’s
concentration we have:
(3)
(4)
The dissociation degree is given by:
(5)
Mixing equations (2) to (5) leads to the evolution
of the energies as a function of pH (through the
dissociation degree).
(6)
From equation (6), it is clear that the energies
evolve according to sigmoid functions. Plotting the
emitted energies as a function of pH for the 3
excitation wavelengths and fitting them with equation
(6) leads to figure 5. In this figure we recall the
expressions of the asymptotic values.
Figure 5: Evolution of the emitted energies as a function of
pH and excitation wavelengths.
In the physiological pH range (between 6.5 and
8), the evolution of the energies can be considered
linear. The slopes and the intercept of linear parts of
curves presented in figure 5 also evolve linearly as
shown in figure 6. Therefore, we can defined the
equation which gives the emitted energy for any pH
and any excitation wavelength.
(7)
In equation (7),
and
coefficients correspond to
the linear equation giving the slope and the intercept
of linear regions of curves in figure 5 as a function of
the excitation wavelength calculated from spectra
shown is figure 2.
BIODEVICES 2018 - 11th International Conference on Biomedical Electronics and Devices
20
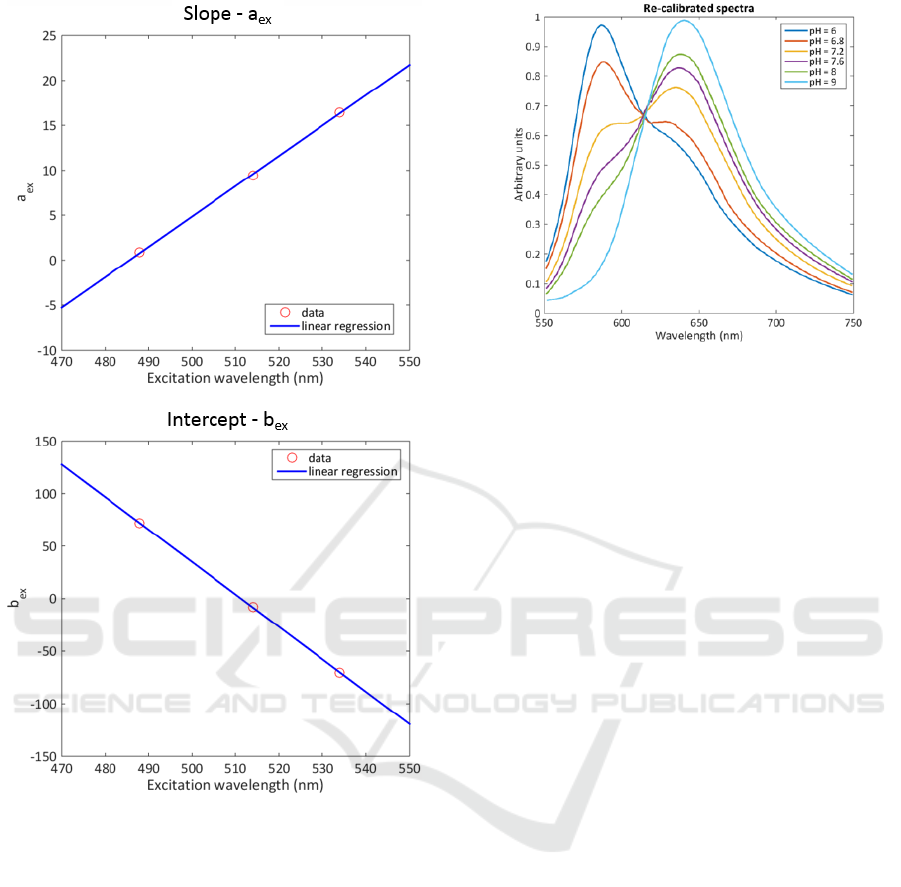
Figure 6: Slope and intercept of the energies as a function
of excitation wavelength.
Spectra post-processing is now extremely simple.
It consists in 2 main steps. First, spectra recorded at
known pH and known excitation wavelength are
normalized. Second, normalized spectra are
multiplied by equation (2) which gives them the
energy they should have (in fact proportionally to
each other’s). Iterating the process for all pH values
allows re-calculating the correct spectra and
retrieving the isosbestic point. This is illustrated in
figure 7 where spectra of figure 3 have been post-
processed.
Figure 7: Spectra of figure 3 post-processed with our
method.
Note that the calibration procedure only implies
ratios of intensities at specific wavelengths.
Therefore, losing the energy value of the initial
spectra when post-processing them is not an issue.
To summarize, this post-processing considerably
simplifies indicators calibration procedures as
calibration becomes independent of the indicator’s
concentration and path length and is not equipment
dependent anymore. This method can easily be
transposed to other ratiometric pH indicators
exhibiting a dual emission peak and also more
generally to ion sensing fluorescent indicators
exhibiting dual emission peaks and for which the
same initial calibration procedure is recommended.
In the next section, we show that we can go a bit
further.
3 TOWARDS CALIBRATION
FREE PH MEASUREMENT
In this section, we show that we can go beyond a
simple simplification of calibration procedures. The
idea is not to describe spectra at unknown pH using
spectra corresponding to the protonated or
deprotonated forms of the indicator as previously
proposed by different teams and mentioned in the
introduction of this communication.
The general goal of the method consists in
proposing a full mathematical description of the pH
dependency of C-SNARF-1 fluorescence emission.
In this way, a complete
function is
defined and can be used to fit spectra obtained at any
pH and to compute the actual pH value. For this,
Modeling of C-SNARF-1 pH Fluorescence Properties: Towards Calibration Free Optical Fiber pH Sensing for in Vivo Applications
21
spectra obtained from the supplier are digitalized and
processed as follows.
3.1 Fitting Spectra with Voigt
Functions
For each of the 6 pH values proposed by the supplier,
we try to fit the spectra with a sum of “n” Voigt
functions. Each individual spectrum is then
decomposed in “n” bands. The goal is to find the
minimum number of bands required to fully describe
spectra. Voigt functions are commonly used in
spectroscopy. We also noted that fitting spectra in the
wavenumbers domain requires less functions than
fitting them in the wavelengths domain. Therefore, in
order to present equations with the traditional unit
used in fluorescence (nm), the Voigt function
associated to the band number i is written as follows.
(8)
In this equation,
represents the area of band i
and
the wavelength corresponding to the center of
band i.
and
represent the half-widths of the
Gaussian and Lorentzian profiles respectively.
Therefore, a Voigt function is described with 4
parameters.
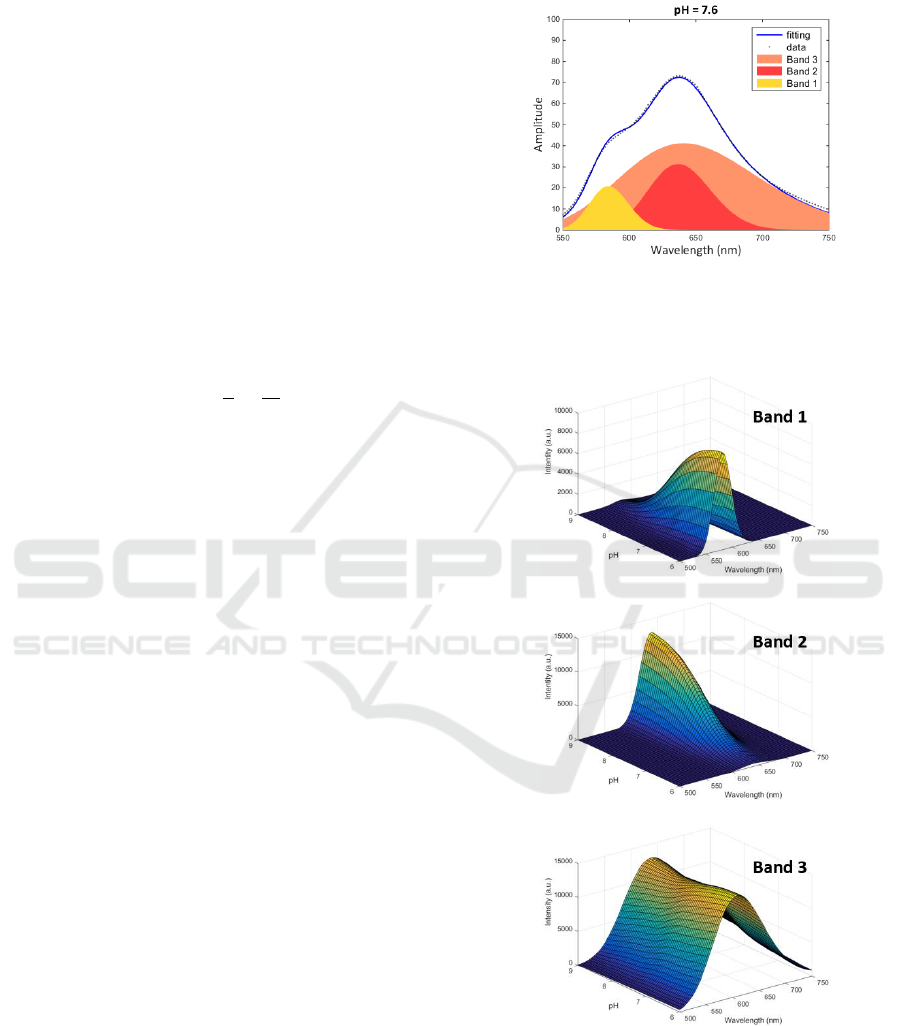
After some series of fittings, we found out that
using 3 functions is enough to fully describe the
evolution of the emitted spectrum as a function of the
pH. Fitting the spectra from supplier was made using
the Levenberg-Marquard algorithm in a multi-branch
fitting which includes all spectra obtained with all pH
values. We recall the we have 4 parameters per Voigt
profile, 3 profiles per pH and 6 pHs available from
the supplier’s website. Therefore, 72 parameters are
required to fully describe the pH behavior of C-
SNARF-1 molecules.
Mathematical developments would be too long to
be exposed here but we described each parameter as
a function of the dissociation degree
. In other
words, although a large number of parameters are
required, only one variable is necessary to fully
describe the pH behavior of C-SNARF-1 molecules.
Working on these first series of fittings, we then
established a
function given in
equation (9).
(9)
In equation (9), functions
are given by
equation (8). The pH dependency of the
function is included in the
dependence of the above mentioned parameters.
Figure 8 shows an example of spectrum fitting using
3 Voigt profiles.
Figure 8: Fitting supplier’s data with 3 Voigt profiles.
Figure 9 shows the evolution of the 3 bands as a
function of pH and wavelength.
Figure 9: Evolution of the 3 bands as a function of pH and
wavelength.
BIODEVICES 2018 - 11th International Conference on Biomedical Electronics and Devices
22
3.2 Fitting Any Spectrum with the
SNARF(λ, pH) Function
The above defined
function was used
to fit uncalibrated spectra presented in figure 3. The
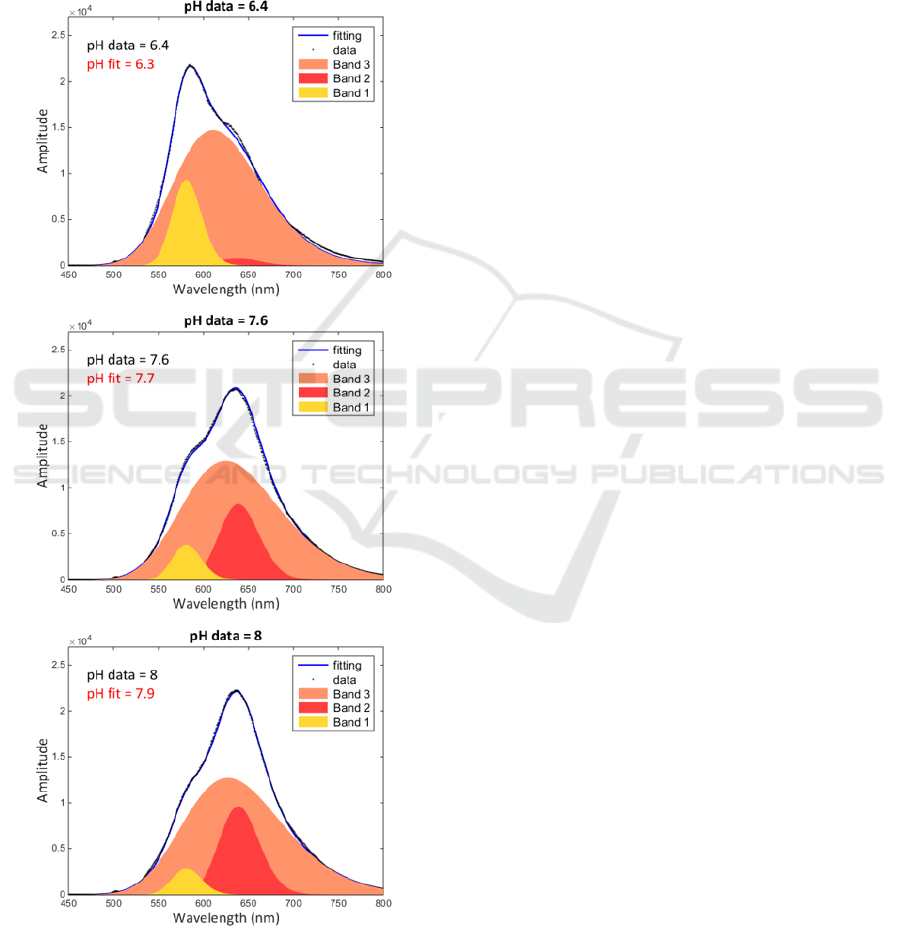
goal was to fit these spectra with the
function in order to compute the value of the pH
directly from the shape of the spectra. The result is
given in figure 10 for a few pH values.
Figure 10: Fitting spectra of figure 2 with
the
function and computing the pH value
from the shape of the spectra.
It can be seen that the pH value can be computed
with an accuracy of about 0.1 pH unit. This result is
particularly encouraging because it was obtained
without using any calibration and with spectra
measured using non sophisticated equipment. To
obtained this, we recall that 72 parameters should be
fitted in order to generate the
function. Although the number of parameters is quite
large, fitting remains highly accurate because of the
even larger number of experimental data. Indeed, the
function was determined using
spectra presented in figure 2. We have about 1000
data points to describe each of the 6 spectra. This
means that 72 parameters are fitted considering about
6000 data points.
Further development must be conducted in order
to improve the accuracy of the method. In particular,
attention should be paid to the influence of the ionic
strength on the value of the pK
a
and possibly on the
shape of the emitted spectra. Using the same fitting
method to account for possible changes of the shape
of the spectra due to variations in the ionic strength
should allow improving the accuracy of the method
and possibly demonstrate the first calibration free pH
measurement.
4 CONCLUSIONS
In this communication, we have presented methods
used to considerably simplify calibration procedures
applied to dual wavelengths ionic fluorescent
indicators and potentially employed to progress
towards calibration free measurements. For
demonstration purpose, we presented results obtained
with C-SNARF-1 molecules when performing a
fluorescence pH sensing.
Simplifying the calibration procedures rely on the
expression of the evolution of the emitted energies as
a function of pH and excitation wavelengths. This
method makes calibration procedures independent of
the experimental conditions. A step towards
calibration free pH measurement was proposed using
a full mathematical description of the pH dependency
of C-SNARF-1 molecules. Using the
function defined using our fitting algorithm allowed
computing pH directly from the analysis of the shapes
of the emitted spectra without any preliminary
calibration. Note that calibration free pH
measurement has never been demonstrating
regardless the technology used. Taking into account
the influence of the ionic strength should further
enhance the pH determination accuracy which is 0.1
pH unit in the examples given here.
Modeling of C-SNARF-1 pH Fluorescence Properties: Towards Calibration Free Optical Fiber pH Sensing for in Vivo Applications
23

Molecules like C-SNARF-1 were mainly
developed for fluorescence imaging of intra-cellular
pH which requires the use of confocal microscope
where the analysis of the fluorescence spectrum is not
possible. However, there exists multi-channel
confocal microscopes which allow obtaining images
at different fluorescence wavelengths. Because the
model is established, images obtained for a reduced
number of individual emission wavelengths may be
sufficient to reconstruct the whole spectra shape,
hence allowing pH determination without calibration.
Concerning the fabrication of a fluorescent fiber
optic pH sensor, work is still ongoing using C-
SNARF-1 as a pH indicator. Fiber optic pH
measurement based on the analysis of the spectra
shapes should be presented shortly.
ACKNOWLEDGEMENTS
This work was partially supported by the European
Commission [grant number FE2007/2013, operation
36381].
REFERENCES
https://www.thermofisher.com/fr/fr/home/references/mole
cular-probes-the-handbook/ph-indicators/probes-
useful-at-near-neutral-ph.html.
Bancel, F., Vigo, J., Salmon, J.M. and Viallet, P., 1990,
Acid—base and calcium-binding properties of the
fluorescent calcium indicator indo-1, Journal of
Photochemistry and Photobiology A: Chemistry, 53,
pp. 397-409.
Bottenus, D., Oh, Y.J., Sang M. Han, Cornelius and Ivory,
F., 2009, Experimentally and theoretically observed
native pH shifts in a nanochannel array, Lab Chip, Vol.
9, pp. 219-231.
Graber, M.L., DiLillo, D.C., Friedman, B.L. and Pastoriza-
Munoz, E., 1986, Characteristics of fluoroprobes for
measuring intracellular pH, Analytical Biochemistry,
Vol. 156, pp. 202-212.
Grynkiewicz, G., Poenie, M., and Tsien, R.Y., 1985, A new
generation of Ca
2+
indicators with greatly improved
fluorescence properties, Journal of biological
chemistry, Vol. 260, pp. 3440-3450.
Negulescu, P.A. and Machen, T.E., 1990, Intracellular ion
activities and membrane transport in parietal cells
measured with fluorescent dyes, Methods Enzymol.,
Vol.192, pp. 38-81.
Owen, C.S., 1992, Comparison of spectrum-shifting
intracellular pH probes 5′(and 6′)-carboxy-10-
dimethylamino-3-hydroxyspiro[7H-benzo[c]xanthene-
7, 1′(3′H)-isobenzofuran]-3′-one and 2′,7′-
biscarboxyethyl-5(and 6)-carboxyfluorescein,
Analytical Biochemistry, Volume 204, pp. 65-71.
Owen, C.S., Carango, P., Grammer, S., Bobyock, S.,
Leeper, D.B., 1992, pH-dependent intracellular
quenching of the indicator carboxy-SNARF-1, Journal
of fluorescence, Vol. 2, pp. 75-80.
Ribou, A.C., Vigo, J., and Salmon, J.M, 2002, C-SNARF-
1 as a fluorescent probe for pH measurements in living
cells: two-wavelength-ratio method versus whole-
spectral-resolution method, J. of Chem. Educ., Vol. 79,
pp. 1471-1474.
Valeur, B., 2001, Molecular Fluorescence: Principles and
Applications”. 2001 Wiley-VCH Verlag GmbH.
ISBNs: 3-527-29919-X (Hardcover); 3-527-60024-8
(Electronic).
Whitaker, J.E., Haugland, R.P., and Prendergast, F.G.,
1991, Spectral and photophysical studies of
benzo[c]xanthene dyes: Dual emission pH sensors”,
Analytical Biochemistry, Volume 194, pp. 330-344.
Yassine, M., Salmon, J.M., Vigoand, J. and Viallet, P.,
1997, C-SNARF-1 as a pHi fluoroprobe: discrepancies
between conventional and intracellular data do not
result from protein interactions”, Journal of
Photochemistry and Photobiology B: Biology, Vol. 37,
pp. 18-25.
Żurawik, T.M., Pomorski, A., Belczyk Ciesielska, A.,
Goch,, G., Niedźwiedzka, K., Kucharczyk, R., Krezel,
A. and Bal, W.,2016, Revisiting Mitochondrial pH with
an Improved Algorithm for Calibration of the
Ratiometric 5(6)-carboxy-SNARF-1 Probe Reveals
Anticooperative Reaction with H+ Ions and Warrants
Further Studies of Organellar pH”, PLoS ONE 11:
e0161353.
BIODEVICES 2018 - 11th International Conference on Biomedical Electronics and Devices
24
