
Patch-based Carcinoma Detection on Confocal Laser Endomicroscopy
Images - A Cross-site Robustness Assessment
Marc Aubreville
1
, Miguel Goncalves
2
, Christian Knipfer
3,4
, Nicolai Oetter
5,4
, Tobias W
¨
urfl
1
,
Helmut Neumann
6
, Florian Stelzle
5,4
, Christopher Bohr
2
and Andreas Maier
1,4
1
Pattern Recognition Lab, Computer Science, Friedrich-Alexander-Universit
¨
at Erlangen-N
¨
urnberg, Germany
2
Department of Otorhinolaryngology, Head and Neck Surgery, University Hospital Erlangen,
Friedrich-Alexander-Universit
¨
at Erlangen-N
¨
urnberg, Germany
3
Department of Oral and Maxillofacial Surgery, University Medical Center Hamburg-Eppendorf, Germany
4
Erlangen Graduate School in Advanced Optical Technologies (SAOT),
Friedrich-Alexander-Universit
¨
at Erlangen-N
¨
urnberg, Germany
5
Department of Oral and Maxillofacial Surgery, University Hospital Erlangen,
Friedrich-Alexander-Universit
¨
at Erlangen-N
¨
urnberg, Germany
6
First Department of Internal Medicine, University Medical Center Mainz,
Johannes Gutenberg-Universit
¨
at Mainz, Germany
Keywords:
Automatic Carcinoma Detection, Confocal Laser Endomicroscopy, Deep Convolutional Networks, Squamous
Cell Carcinoma.
Abstract:
Deep learning technologies such as convolutional neural networks (CNN) provide powerful methods for image
recognition and have recently been employed in the field of automated carcinoma detection in confocal laser
endomicroscopy (CLE) images. CLE is a (sub-)surface microscopic imaging technique that reaches magnifi-
cations of up to 1000x and is thus suitable for in vivo structural tissue analysis.
In this work, we aim to evaluate the prospects of a priorly developed deep learning-based algorithm targeted
at the identification of oral squamous cell carcinoma with regard to its generalization to further anatomic loca-
tions of squamous cell carcinomas in the area of head and neck. We applied the algorithm on images acquired
from the vocal fold area of five patients with histologically verified squamous cell carcinoma and presumably
healthy control images of the clinically normal contra-lateral vocal cord.
We find that the network trained on the oral cavity data reaches an accuracy of 89.45% and an area-under-
the-curve (AUC) value of 0.955, when applied on the vocal cords data. Compared to the state of the art, we
achieve very similar results, yet with an algorithm that was trained on a completely disjunct data set. Concate-
nating both data sets yielded further improvements in cross-validation with an accuracy of 90.81% and AUC
of 0.970.
In this study, for the first time to our knowledge, a deep learning mechanism for the identification of oral
carcinomas using CLE Images could be applied to other disciplines in the area of head and neck. This study
shows the prospect of the algorithmic approach to generalize well on other malignant entities of the head and
neck, regardless of the anatomical location and furthermore in an examiner-independent manner.
1 INTRODUCTION
Squamous cell carcinoma is a common kind of cancer,
found in epithelial tissue. The prevalence within the
head and neck region is estimated to be around 1.3
million cases per year (Forastiere et al., 2001; Ferlay
et al., 2014).
Many cases of head and neck squamous cell carci-
noma (HNSCC) are diagnosed at a late stage, which
impairs treatment outcomes and increases mortality
(Muto et al., 2004). The gold standard of diagno-
sis is invasive biopsy of the tissue with subsequent
histopathological assessment (Oetter et al., 2016).
However, biopsies carry the risk of infections and
bleeding. Furthermore, due to the invasiveness a limi-
tation in the sample size and quantity hinders the find-
ing of accurate resection margins (Dittberner et al.,
2016; Nathan et al., 2014). An non- or minimally
invasive in vivo characterization of microstructures
could help detecting such malignancies at an early
stage while at the same time reducing risk. Further,
it could be of help for periodic monitoring of possibly
malignant cellular structures, reducing the risk for un-
necessary biopsies.
Aubreville, M., Goncalves, M., Knipfer, C., Oetter, N., Würfl, T., Neumann, H., Stelzle, F., Bohr, C. and Maier, A.
Patch-based Carcinoma Detection on Confocal Laser Endomicroscopy Images - A Cross-site Robustness Assessment.
DOI: 10.5220/0006534700270034
In Proceedings of the 11th International Joint Conference on Biomedical Engineering Systems and Technologies (BIOSTEC 2018) - Volume 2: BIOIMAGING, pages 27-34
ISBN: 978-989-758-278-3
Copyright © 2018 by SCITEPRESS – Science and Technology Publications, Lda. All rights reserved
27

Hard palate
(OC)
Inner Labium (OC)
Alveolar ridge
(OC)
Vocal co
(VC)
Figure 1: Anatomical locations from the oral cavity and the
upper aero-digestive and respiratory tract.
One method that has successfully been applied
for visual inspection of suspicious lesions is Con-
focal Laser Endomicroscopy (CLE). In this imaging
method, laser light is emitted and applied on tis-
sue using a fibre-optic bundle that is typically in-
serted through the accessory channel of an endoscope
(Chauhan et al., 2014). The resolution of CLE is high,
providing magnifications of up to 1000x (Oetter et al.,
2016) and enabling sub-cellular imaging. A contrast
agent (fluorescein) is applied intravenously prior to
the examination in order to stain the intercellular gap
and hence outline the cell borders. CLE is success-
fully used in clinical routine diagnostics of the intes-
tine (Neumann et al., 2010) and was recently also suc-
cessfully applied on cancer assessment in the oral cav-
ity (Oetter et al., 2016) and the upper respiratory tract
(Goncalves et al., 2017).
Due to the property of making cellular structures
visible, CLE is said to provide ’real-time’ optical
biopsies (Parikh et al., 2016), which is a major ad-
vantage over the need to perform traditional biopsies,
e.g. when finding a proper resection margin for intra-
operative monitoring during surgical tumor removal.
However, it was shown that the accuracy in interpreta-
tion of CLE images is highly dependent on the experi-
ence of the clinical expert, and that a significant learn-
ing curve exists (Neumann et al., 2011). An automatic
detection and interpretation of such images could thus
help to improve the standard and make CLE also ap-
plicable with less training involved.
Deep learning methods, such as convolutional
neural networks (CNN) have recently been used in a
variety of image recognition tasks. We have shown
that CNN-based recognition methods outperform the
state of the art in HNSCC detection on CLE im-
ages, using a data set of 12 patients (Aubreville et al.,
2017). In order to investigate the robustness of the
method, generalization has to be assessed to other en-
vironments. One step into showing this generalization
is to apply a trained machine learning model from one
anatomical site and clinical team to another, without
any modification of the underlying model structure
and content. This would provide a strong hint of gen-
eralization towards other locations of the upper aero-
digestive tract with similar but not identical epithelia.
2 MATERIAL
For the present work, we are using images from two
anatomical locations (see figure 1): From within the
oral cavity, we used images from three clinically nor-
mal sites and a lesion site with verified SCC. From
the upper aero-digestive and respiratory tract, we used
images of the vocal cords (clinically normal and with
verified malign changes). All images were acquired
using a probe-based CLE (pCLE) system (Cellvizio,
Mauna Kea Technologies, Paris, France). From all
patients, written informed consent was obtained prior
to the study. Approval was granted by the respec-
tive institutional review boards. The research was car-
ried out in accordance with the Code of Ethics of the
World Medical Association (Declaration of Helsinki)
and the guidelines of the Friedrich-Alexander Univer-
sity Erlangen-Nuremberg.
2.1 Oral Cavity (OC)
We included image sequences (N = 116) from 12 pa-
tients with diagnosed and verified HNSCC in the oral
cavity that were recorded at the Department of Oral
and Maxillofacial Surgery (University Hospital Er-
langen)
1
. For all patients, imaging was performed at
the suspected carcinoma site, as well as three other
anatomical sites within the oral cavity. After verifi-
cation of the carcinoma diagnosis by histo-pathology,
all patients underwent surgery for removal of the sus-
pected tissue. Oetter et al. found that the accuracy
as rated by CLE-experienced specialists was 92.3%,
where the experts were allowed to see the complete
video sequence to base their assessment upon. So,
this number accounts for occurrence of singular or
sparse cues for a correct classification. It is to be ex-
pected that an assessment of a whole sequence can
achieve a better performance than on singular images.
In contrast, we performed evaluation on a per-frame
base. The total number of images with sufficient qual-
ity in this data set is 7,894.
1
Study approved by the ethics committee of the Univer-
sity of Erlangen-N
¨
urnberg; reference number: 243 12 B
BIOIMAGING 2018 - 5th International Conference on Bioimaging
28
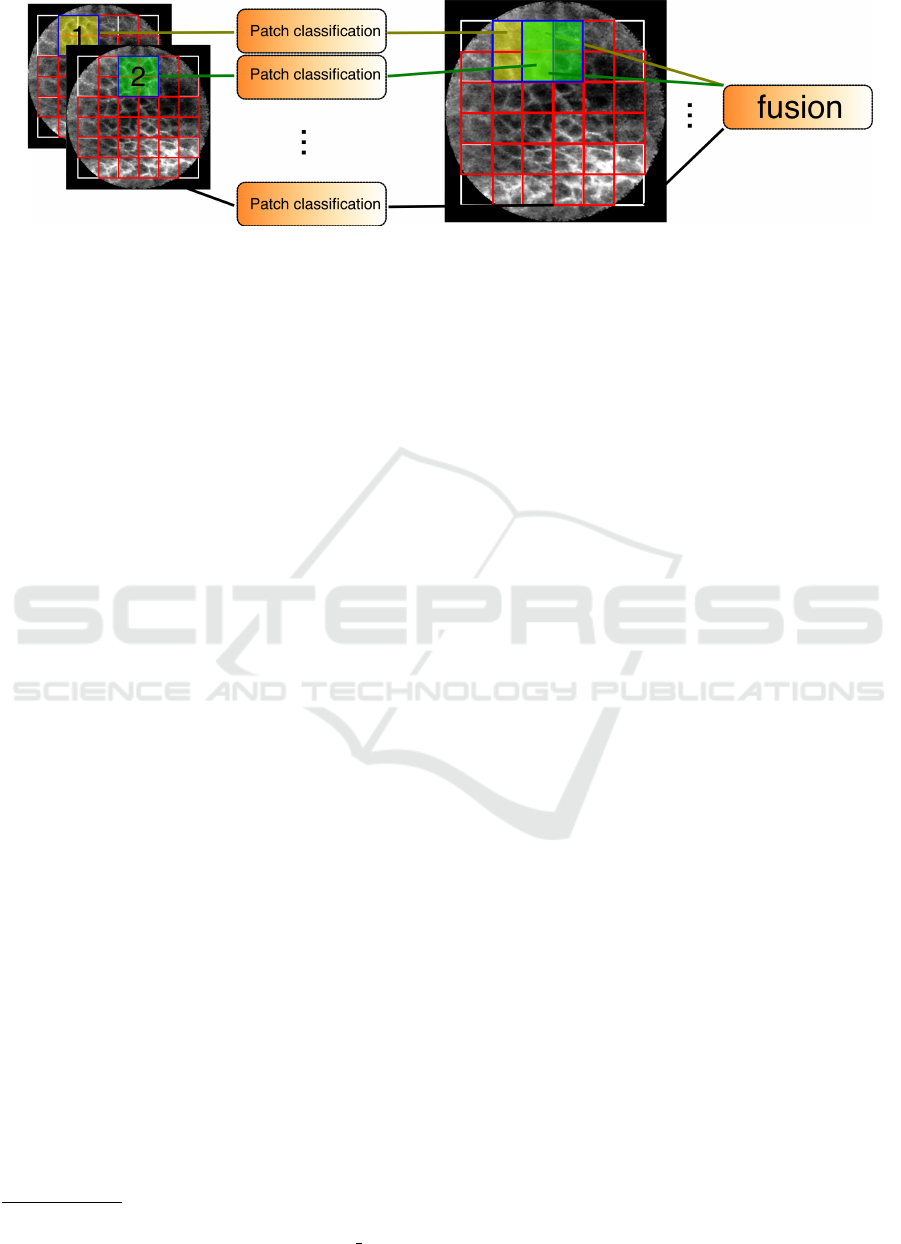
Figure 2: Overview of the classification method. Patches (1,2,...) are extracted from the visible view area of the image and
independently fed into a CNN-based patch classification. The resulting probabilities are then fused in a final step to one
class-probability tuple for the whole image.
2.2 Vocal Cords (VC)
Squamous cell carcinoma of the vocal cords is the
most prevalent form of cancer of the laryngeal tract
(Parkin et al., 2005) and an anatomy where bright
light endoscopy alone is insufficient for diagnosis,
because a significant range of benign mucosal al-
terations with similar macroscopic appearance exist
(Goncalves et al., 2017). Biopsies require a suffi-
cient amount of material and extensive biopsy in this
anatomical region causes functional problems, such
as chronic hoarseness or other voice modifications
(Cikojevi
´
c et al., 2008). Accurate diagnosis using op-
tical, non-invasive methods would thus provide a sig-
nificant improvement for the life quality of patients
with suspected cancer of the upper respiratory tract.
In this study, we included N = 73 image sequences
from five patients with verified malignant transfor-
mations of the vocal folds. For each patient, the
contra-lateral vocal cord (that was clinically normal
in all cases) was also investigated using CLE, build-
ing a presumably healthy data set. The images were
acquired at the Department of Otorhinolaryngology,
Head and Neck Surgery, University Hospital Erlan-
gen
2
. All image sequences were taken during micro-
laryngoscopy and were pre-selected by a clinical ex-
pert in CLE imaging, in order to remove images
where the acquisition was not performed properly,
e.g. when the probe was not in contact with the tissue.
For one patient only image sequences of the clinically
normal vocal cord exist in a sufficient quality, reduc-
ing the number of carcinoma patients to four. The
total number of images in this data set is 4,425. Pre-
vious studies of automatic carcinoma detection on this
data set have shown accuracies in grading of between
86.4% and 89.8% (Vo et al., 2017), using the methods
of Jaremenko (Jaremenko et al., 2015).
2
Study approved by the ethics committee of the Univer-
sity of Erlangen-N
¨
urnberg; reference number: 60 14 B
Goncalves et al. selected 31 representative images
out of a different vocal cord data set of 7 patients and
found rating accuracies by ENT specialists to be be-
tween 58.1% and 87.1%, where the non-CLE expe-
rienced doctors had a mean accuracy of 67.7% and
those with profound experience of CLE one of 82.2%
(Goncalves et al., 2017). Also for this data set, the
differences in recognition performance are well ex-
plained by the learning effect as described by Neu-
mann (Neumann et al., 2011). However, the rela-
tively low accuracies for less experienced observers
also motivate the development of an automated ap-
proach, as pointed out by Goncalves.
2.3 Image Quality and Artifact
Occurrence
CLE images suffer from a range of deteriorations
in image quality (Neumann et al., 2012; Aubreville
et al., 2017). While some images are tainted by mo-
tion artifacts, others have a very low signal to noise
ratio (see figure 4, second column).
For images acquired by CLE, image noise inten-
sity is mostly dependent on the actual amount of re-
ceived photons, i.e. the optical response of the tissue,
since the optical receiver has a broad dynamic range
and images are automatically range compressed by
the viewing software to fit the gray level range (8bit)
of today’s screens and image file formats. One met-
ric to measure this optical response is by the pixel
value distribution of the image. We calculated the me-
dian pixel value of each image to assess the optical
response and compared the different anatomical loca-
tions of clinically normal tissue (see figure 5). CLE
images have sparse occurrences of vessels (see 4, top
left), which are typically very bright, which is why the
median might be beneficial for contrast assessment of
the cellular structures of the overall image. Low val-
ues of the median indicate a noisy image, while high
Patch-based Carcinoma Detection on Confocal Laser Endomicroscopy Images - A Cross-site Robustness Assessment
29
clinically normal vocal fold
verified carcinoma
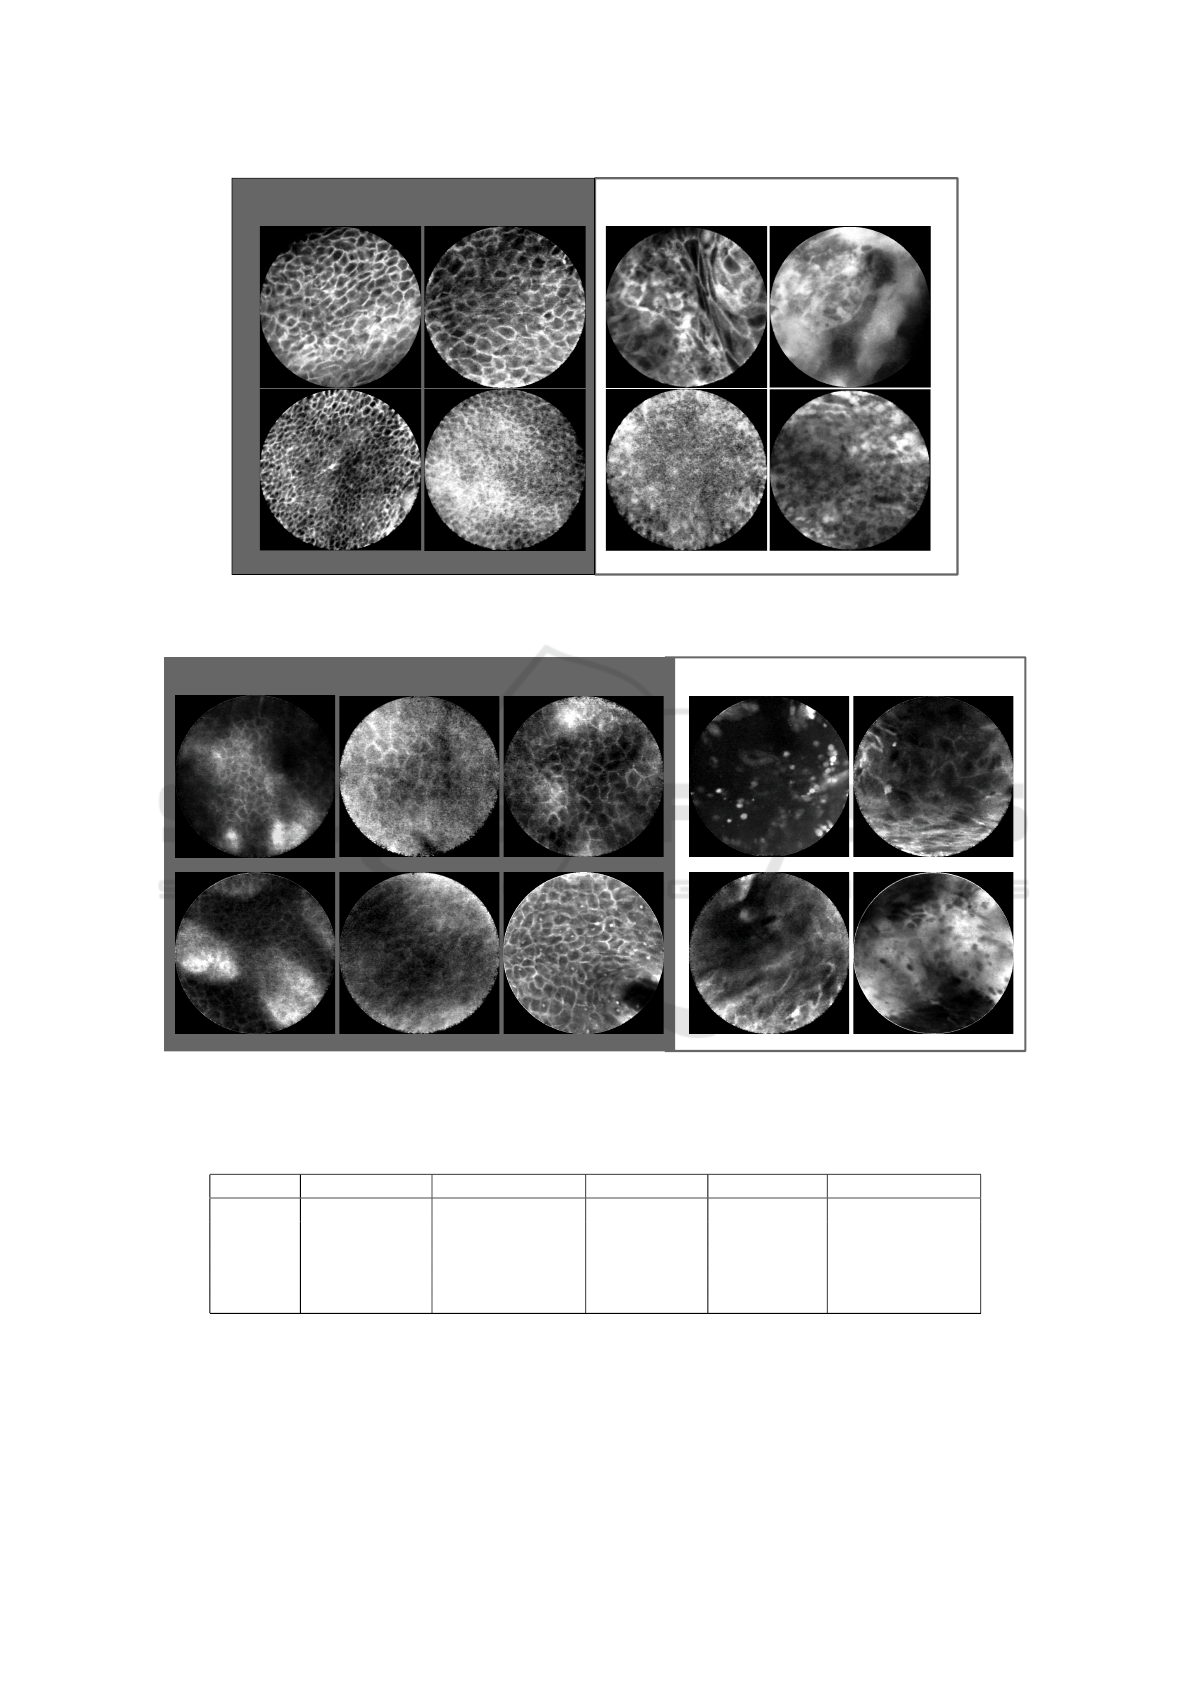
Figure 3: Selected CLE Images acquired from the vocal fold area. On the left, presumably healthy images are depicted that
were taken from the clinically normal contralateral vocal cord of patients with epithelial cancer one of the both vocal cord.
clinically normal oral cavity images
verified carcinoma
labial
hard palate
alveolar ridge
Figure 4: Selected CLE Images acquired from the oral cavity. On the left, presumably healthy images are depicted that
were taken from clinically normal regions from patients suffered from histologically verified head and neck squamous cell
carcinoma.
Table 1: Test conditions. For cross-correlation, a leave-one-patient out scheme was used.
Name Train data set Patients training Test data set Patients test Cross validation
OC Oral cavity 11 Oral cavity 1 LOPO
VC Vocal cords 4 Vocal cords 1 LOPO
OC/VC Oral cavity 12 Vocal cords 5 -
VC/OC Vocal cords 5 Oral cavity 12 -
OC+VC both 16 both 1 LOPO
values indicate an image with a high optical response
to the laser. For low values, the range compression
of the viewing system is in fact an extension, which
amplifies noise further for the examiner.
We find that a significant amount of images of the
palatinal and labial region have a low response, indi-
cating high noise levels, which is also confirmed by
optical inspection of the images. In contrast, images
BIOIMAGING 2018 - 5th International Conference on Bioimaging
30
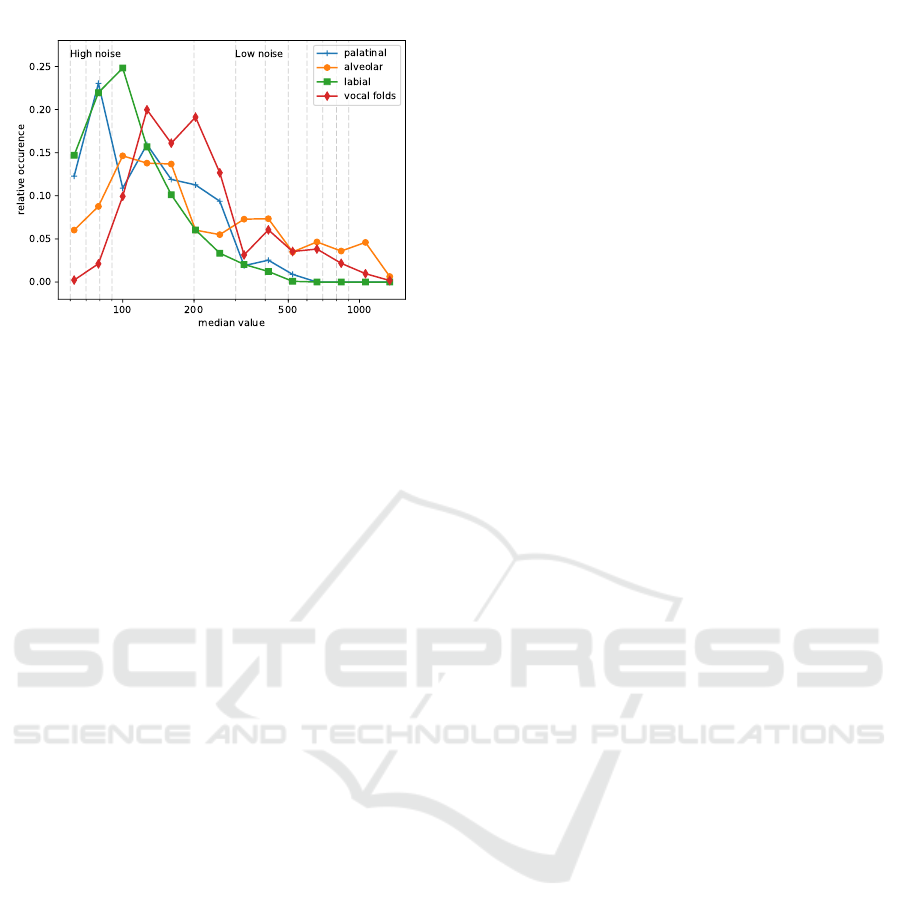
Figure 5: Normalized histogram of the median value for the
different classes of clinically normal tissue from both data
sets. Due to the wide range of pixel values, the histogram is
given at log scale.
of the alveolar ridge and - even more - the vocal folds
tend to have a better signal to noise ratio, as depicted
in figure 5.
This can be related to the different anatomical
properties of the respective epithelia: Regions with
high mechanical stress due to chewing have a higher
degree of cornification (Rohen and L
¨
utjen-Drecoll,
2000). Specifically, the hard palate is known to have
a high degree of cornification (Luellmann-Rauch,
2015). The inner lip (labium) is generally not consid-
ered a cornified epithelium, however our images were
taken at the intersection between mucous membrane
and outer lip with its epidermal layer, where cornifi-
cation is indeed prominent (Rohen, 1994). Contrary
to this, the vocal cords are known to consist of mul-
tiple layers of uncornified squamous epithelium (Ro-
hen, 1994).
The difference in image quality could, however,
also be caused by a different preselection bias be-
tween the two clinical teams.
In our data sets, motion artifact incidence is signif-
icantly higher in the oral cavity images compared to
the vocal cords images. This can be related to patients
being under general anaesthesia in case of the vocal
fold microendoscopy (Goncalves et al., 2017). In this
case, the only reason for motion is hand movement of
the clinician performing the image acquisition.
3 METHODS
Our method is based on the extraction of squared
patches from the round field of view area of a CLE
image, classification by a deep convolutional network
(CNN). Subsequently, the a posteriori probabilities
are fused (see Fig. 2; for more details, see (Aubre-
ville et al., 2017)). The approach limits overfitting
of the CNN model by a small patch size (80x80 px)
and thus a reduced capacity of the network. Addition-
ally, the strategy results in a large number of training
samples, since every image consists of a multitude of
patches. We trained the network for 60 epochs, us-
ing the Adam optimizer at an initial step size of 0.01
within the TensorFlow framework.
In total, we performed two additional test sets:
1. Generalization Tests
We performed training of our deep convolutional
models on one anatomical location and testing on
the other (tests OC/VC and VC/OC, see table 1).
2. Algorithmic Validation
We performed a validation of the automatic de-
tection algorithm (Aubreville et al., 2017) on the
vocal cords data set and on the concatenated data
set (tests VC and OC+VC, respectively).
For all tests, where train and test data were
taken from the same data set, we applied leave-
one-patient-out cross validation. Independent x-fold
cross-validation or simple random train-test-splitting
isn’t applicable, since high correlations between con-
secutive frames within one sequence might exist. The
VC data set is small compared to the other data sets,
has a much lower number of patients and comes from
a small anatomical structure. This leads us to expect
generalization to the oral cavity to work better than
vice versa.
Our intention for the last test (OC+VC) is, how
well the algorithm is able to improve overall results
from more image material.
4 RESULTS
We find that the patch-based classification method
seems to generalize well from the oral cavity data set
to the vocal cords dataset (ROC area-under-the-curve
of 0.9548). It is a comparable figure to the original
data, where the ROC AUC was 0.9550. Trained on
the vocal cords data set, the method outperforms the
cross-validation results as reported by Vo et al. for the
method by Jaremenko et al. slightly (Vo et al., 2017;
Jaremenko et al., 2015). When comparing the results
on individual patients, slight differences between both
approaches occur, where the approach only trained on
VC data performs better for patient 3, while the ap-
proach trained on OC data performs better for patient
Patch-based Carcinoma Detection on Confocal Laser Endomicroscopy Images - A Cross-site Robustness Assessment
31
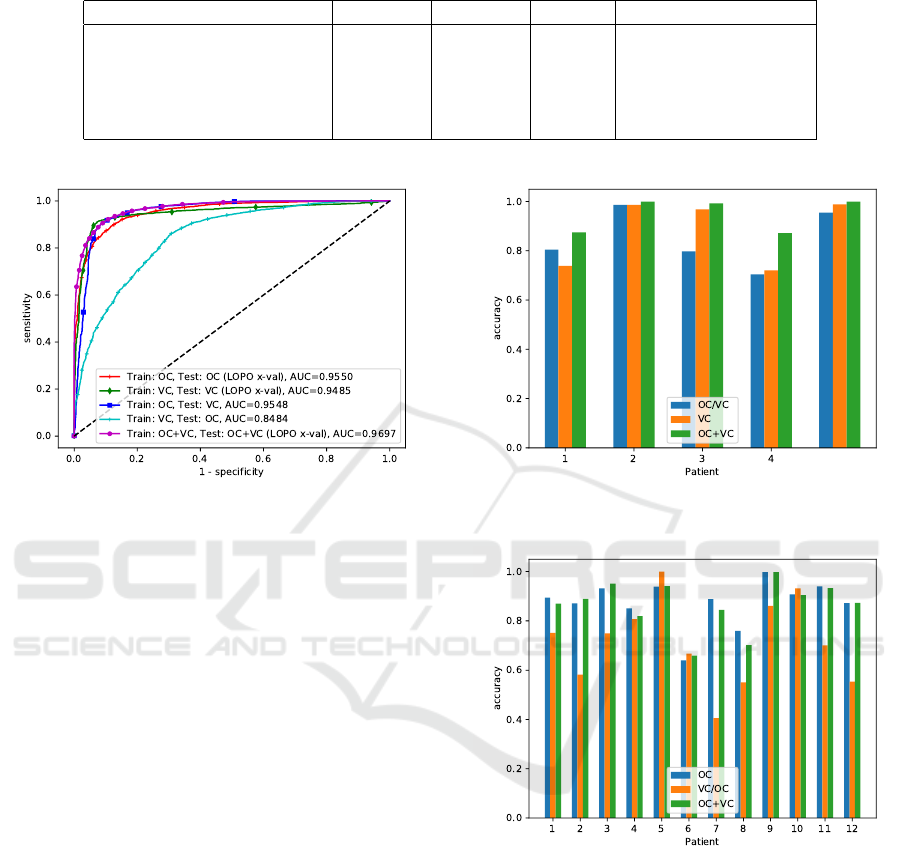
Table 2: Results of all tests. For the cross validation cases OC, VC and OC+VC, the results were calculated on the concate-
nated result vector of all cross validation steps.
Condition Accuracy Precision Recall ROC area under curve
OC (Aubreville et al., 2017) 88.34% 85.40% 91.10% 0.9550
VC 91.39% 93.64% 92.03% 0.9484
OC/VC 89.45% 87.47% 96.37% 0.9548
VC/OC 68.53% 60.81% 95.63% 0.8484
OC+VC 90.81% 90.12% 92.59% 0.9697
Figure 6: Receiver Operating Characteristic (ROC) curve
for the different setups. (OC=oral cavity, VC=vocal cords).
1. The concatenated data set increased performance
for all patients in cross-validation (cf. figure 7).
The generalization task from the vocal cord data
set to the much larger oral cavity data set, however,
did not show comparable results, having AUC val-
ues of only 0.8484. Inspecting individual patient per-
formance, it is obvious that the generalization loss is
prominent in a number of patients, while others, like
the tests on patient 4,5,6 and 10 perform comparable
to the tests on the original OC data set.
When the data set is concatenated (condition
OC+VC), the accuracy and ROC AUC values in-
creases, with values of 90.81% and 0.9697, respec-
tively.
5 DISCUSSION
The much greater variance of the oral cavity data set
(cf. figure 5) due to the larger variety in acquisition
conditions led to better generalization properties com-
pared to the vocal cords data set. The general signal-
to-noise ratio was much better in this case. This is the
reason why the classifier trained on the vocal cords
tends to confuse noisier images, as they have been
recorded from the cornified sections of the oral cavity,
for malignant tissue. This is also reflected by the high
recall and low precision ratings in this classification
Figure 7: Accuracy for all patients with both classes of the
vocal fold data set.
Figure 8: Accuracy for all patients of the oral cavity data
set.
task (cf. 4th row of table 2).
For the generalization from the oral cavity to the
vocal fold data set, this restriction did not apply, since
the CLE imaging conditions within the oral cavity
seems to be a superset of those on the vocal folds.
However, also the greater number of patients for
whom verified carcinoma imaging material was avail-
able likely played a role, which is also indicated by
the increased performance in cross-validation for the
concatenated data set. This indicates that the pattern
recognition capacity of the model is not yet reached
and that additional imaging data would likely increase
BIOIMAGING 2018 - 5th International Conference on Bioimaging
32

performance further.
Since histological verification was only present
for cancerous areas in both data sets, we can only as-
sume that clinically normal regions represent healthy
epithelium. Extraction of tissue from those regions
would however be ethically questionable and not re-
ceive approval of the review boards.
It is questionable, if an 100% accurate classifica-
tion of epithelial tissue is possible using CLE alone,
as even experts in the field of CLE were not able to
classify cancerous tissue perfectly (Goncalves et al.,
2017; Oetter et al., 2016). Due to the low penetration
depth of CLE, it is sometimes possible to overlook tu-
mors that spread within the submucosa. Such tumors
could be visualized only through histological section
or perhaps through Optical Coherence Tomography
(Betz et al., 2015).
One important aspect in automated inspection of
CLE images is the removal of artifact-tainted images
prior to training, since artifact occurrence is corre-
lated with the surface conditions of the epithelium.
This implies that it is also correlated to the malig-
nancy classification, a causal relationship between
artifact prevalence and tissue classification should,
however, be neglected. This step was done manu-
ally in this work and this problem is subject of future
work.
Even though our approach found good accuracy
ratings, generalization can not be claimed to be fully
shown with this study, due to the limited amount of
patient data. Because of this, future work of our re-
search group will concentrate on the acquisition of
imaging data in order to increase the variance in the
data set, which will presumably increase performance
and robustness of the algorithmic approach.
6 SUMMARY
In this work, we have shown the principal ability to
generalize patch-based CLE image classification with
convolutional networks of potentially cancerous ep-
ithelium from a more diversified data set (from the
oral cavity) to one of another anatomical location (the
vocal folds) with less variance. The second data set
was from a different clinic and a different team.
The generalization showed very promising re-
sults and concatenation of both sets did show fur-
ther improvements in a leave-one-patient-out cross-
validation scenario.
In total, we achieved an accuracy of 89.45% in
the generalization task, where the classification model
was trained on the oral cavity data set and applied on
the vocal cords data set. For the concatenated data
set with 17 patients, we achieved a total accuracy of
90.81% for the complete data set.
REFERENCES
Aubreville, M., Knipfer, C., Oetter, N., Jaremenko, C., Rod-
ner, E., Denzler, J., Bohr, C., Neumann, H., Stelzle,
F., and Maier, A. K. (2017). Automatic classification
of cancerous tissue in laserendomicroscopy images of
the oral cavity using deep learning. Scientific Reports
7:11979.
Betz, C. S., Kraft, M., Arens, C., Schuster, M., Pfef-
fer, C., R
¨
uhm, A., Stepp, H., Englhard, A., and
Volgger, V. (2015). Optische Diagnoseverfahren
zur Tumorfr
¨
uhdiagnostik im oberen Luft-Speise-Weg.
HNO, 64(1):41–48.
Chauhan, S. S., Dayyeh, B. K. A., Bhat, Y. M., Gottlieb,
K. T., Hwang, J. H., Komanduri, S., Konda, V., Lo,
S. K., Manfredi, M. A., Maple, J. T., et al. (2014).
Confocal laser endomicroscopy. Gastrointestinal en-
doscopy, 80(6):928–938.
Cikojevi
´
c, D., Glun
ˇ
ci
´
c, I., and Pe
ˇ
suti
´
c-Pisac, V. (2008).
Comparison of contact endoscopy and frozen section
histopathology in the intra-operative diagnosis of la-
ryngeal pathology. The Journal of Laryngology &
Otology, 122(8):836–839.
Dittberner, A., Rodner, E., Ortmann, W., Stadler, J.,
Schmidt, C., Petersen, I., Stallmach, A., Denzler, J.,
and Guntinas-Lichius, O. (2016). Automated analy-
sis of confocal laser endomicroscopy images to detect
head and neck cancer. Head & Neck, 38(S1):E1419–
E1426.
Ferlay, J., Soerjomataram, I., Dikshit, R., Eser, S., Mathers,
C., Rebelo, M., Parkin, D. M., Forman, D., and Bray,
F. (2014). Cancer incidence and mortality worldwide:
Sources, methods and major patterns in GLOBOCAN
2012. International Journal of Cancer, 136(5):E359–
E386.
Forastiere, A., Koch, W., Trotti, A., and Sidransky, D.
(2001). Head and Neck Cancer. The New England
Journal of Medicine, 345(26):1890–1900.
Goncalves, M., Iro, H., Dittberner, A., Agaimy, A., and
Bohr, C. (2017). Value of confocal laser endomi-
croscopy in the diagnosis of vocal cord lesions. Eu-
ropean Review for Medical and Pharmacological Sci-
ences, 21(18):3990-3997.
Jaremenko, C., Maier, A., Steidl, S., Hornegger, J., Oet-
ter, N., Knipfer, C., Stelzle, F., and Neumann, H.
(2015). Classification of Confocal Laser Endomicro-
scopic Images of the Oral Cavity to Distinguish Patho-
logical from Healthy Tissue. In Bildverarbeitung f
¨
ur
die Medizin 2015, pages 479–485. Springer Berlin
Heidelberg.
Luellmann-Rauch, R. (2015). Taschenbuch Histologie.
Thieme, Stuttgart u.a.
Muto, M., Nakane, M., Katada, C., Sano, Y., Ohtsu, A.,
Esumi, H., Ebihara, S., and Yoshida, S. (2004). Squa-
mous cell carcinoma in situ at oropharyngeal and hy-
Patch-based Carcinoma Detection on Confocal Laser Endomicroscopy Images - A Cross-site Robustness Assessment
33

popharyngeal mucosal sites. Cancer, 101(6):1375–
1381.
Nathan, C. A. O., Kaskas, N. M., Ma, X., Chaudhery, S.,
Lian, T., Moore-Medlin, T., Shi, R., and Mehta, V.
(2014). Confocal Laser Endomicroscopy in the De-
tection of Head and Neck Precancerous Lesions. Oto-
laryngology – Head and Neck Surgery, 151(1):73–80.
Neumann, H., Kiesslich, R., Wallace, M. B., and Neurath,
M. F. (2010). Confocal Laser Endomicroscopy: Tech-
nical Advances and Clinical Applications. YGAST,
139(2):388–392.e2.
Neumann, H., Langner, C., Neurath, M. F., and Vieth, M.
(2012). Confocal Laser Endomicroscopy for Diagno-
sis of Barrett’s Esophagus. Frontiers in oncology, 2.
Neumann, H., Vieth, M., Atreya, R., Neurath, M. F., and
Mudter, J. (2011). Prospective evaluation of the learn-
ing curve of confocal laser endomicroscopy in patients
with IBD. Histology and histopathology, 26(7):867–
872.
Oetter, N., Knipfer, C., Rohde, M., Wilmowsky, C., Maier,
A., Brunner, K., Adler, W., Neukam, F.-W., Neumann,
H., and Stelzle, F. (2016). Development and validation
of a classification and scoring system for the diagno-
sis of oral squamous cell carcinomas through confo-
cal laser endomicroscopy. Journal of Translational
Medicine, 14(1):1–11.
Parikh, N. D., Gibson, J., Nagar, A., Ahmed, A. A.,
and Aslanian, H. R. (2016). Confocal laser en-
domicroscopy features of sessile serrated adeno-
mas/polyps. United European Gastroenterology Jour-
nal, 4(4):599–603.
Parkin, D. M., Bray, F., Ferlay, J., and Pisani, P. (2005).
Global Cancer Statistics, 2002. CA: A Cancer Journal
for Clinicians, 55(2):74–108.
Rohen, J. W. (1994). Histologische Differentialdiagnose:
Anleitung zur Diagnose histologischer Pr
¨
aparate.
Rohen, J. W. and L
¨
utjen-Drecoll, E. (2000). Funktionelle
Histologie. Schattauer, 4 edition.
Vo, K., Jaremenko, C., Bohr, C., Neumann, H., and Maier,
A. (2017). Automatic Classification and Pathological
Staging of Confocal Laser Endomicroscopic Images
of the Vocal Cords. In Maier-Hein, K. H., editor, Bild-
verarbeitung f
¨
ur die Medizin 2017 Algorithmen Sys-
teme Anwendungen, pages 312–317, Heidelberg.
BIOIMAGING 2018 - 5th International Conference on Bioimaging
34
