
A Novel Handwritten Digits Recognition Method based on Subclass Low
Variances Guided Support Vector Machine
Soumaya Nheri
1
, Riadh Ksantini
1,2
, Mohamed B
´
echa Ka
ˆ
aniche
1
and Adel Bouhoula
1
1
Higher School of Communication of Tunis, Research Unit: Digital Security, University of Carthage, Carthage, Tunisia
2
University of Windsor, 401, Sunset Avenue, Windsor, ON, Canada
Keywords:
Handwritten Digits Recognition, Support Vector Machine, Kernel Covariance Matrix, One-Class Classifica-
tion, Outlier Detection, Subclass Low Variances.
Abstract:
Handwritten Digits Recognition (HWDR) is one of the very popular application in computer vision and it
has always been a challenging task in pattern recognition. But it is very hard practical problem and many
problems are still unresolved. To develop a high performance automatic HWDR, several learning algorithms
have been proposed, studied and modified. Much of the effort involved in Handwritten digits classification
with Support Vector Machine (SVM). More specifically, in the current study we are focusing on one-class
SVM (OSVM) approaches which are of huge interest for our problem. Covariance Guided OSVM (COSVM)
algorithm improves up on the OSVM method, by emphasizing the low variance directions. However, COSVM
does not handle multi-modal target class data. Thus, we design a new subclass algorithm based on COSVM,
which takes advantage of the target class clusters variance information. To investigate the effectiveness of
the novel Subclass COSVM (SCOSVM), we compared our proposed approach with other methods based on
other contemporary one-class classifiers, on well-known standard MNIST benchmark datasets and Optical
Recognition of Handwritten Digits datasets. The experimental results verify the significant superiority of our
method.
1 INTRODUCTION
Nowadays Digit Recognition is widely used in many
applications: Banking to recognize amounts written
on checks (Mahmoud and Al-Khatib, 2011), postal
services for zip codes on envelopes (Niu and Suen,
2012), Optical Character Recognition (OCR) to read
text from scanned document and translating the ima-
ges into a form that computer can manipulate, etc. Di-
git Recognition can be divided into two categories:
Printed Digits Recognition and Handwritten Digits
Recognition. Printed Digits have regular shapes and
differences between images of the same number are
just in the angle of view, size, color, etc. Automa-
tic Handwritten Digits Recognition (HWDR) is the
process of interpreting handwritten digits by machi-
nes (Tuba et al., 2016). The HWDR is a complica-
ted undertaking compared with recognition of printed
digits, since handwriting depends much on the wri-
ter personal behavior, where there are several number
models based on angles, length of the segments, stress
on some parts of numbers, etc. Thus, the same digit
can be written in many different ways, hence more
effort is required to find similarity between instances
of the same digit. In fact, it is difficult operation for
the machines, especially, when there are some am-
biguities on different classes (e.g.
0
1
0
and
0
7
0
) (Ebra-
himzadeh and Jampour, 2014). In the past few years,
many classification and regression techniques have
been proposed to improve HWDR, including linear
and nonlinear Regression models, Nearest Neighbor
classifiers, Decision Tree (Zhang et al., 2014), Baye-
sian classifiers and Support Vector Machines (SVM).
Today, one of the most successful and popular classi-
fiers is SVM, which constructs a hyper-plane in high
order space, in order to perform classification effi-
ciently (Cortes and Vapnik, 1995). Many applicati-
ons use SVM for solving classification problems, es-
pecially, those of HWDR. In (Gorgevik and Cakma-
kov, 2004) SVM and neural network were combined
for classification of handwritten digits. Recently, in
(Malon et al., 2008), SVM was used to improve clas-
sification accuracy for the OCR of mathematical do-
cuments. More recently, it was used for classifica-
tion of brain metastasis and radiation necrosis (Lar-
roza et al., 2015). However, in real workflows, if
28
Nheri, S., Ksantini, R., Kaâniche, M. and Bouhoula, A.
A Novel Handwritten Digits Recognition Method based on Subclass Low Var iances Guided Support Vector Machine.
In Proceedings of the 13th International Joint Conference on Computer Vision, Imaging and Computer Graphics Theory and Applications (VISIGRAPP 2018) - Volume 4: VISAPP, pages
28-36
ISBN: 978-989-758-290-5
Copyright © 2018 by SCITEPRESS – Science and Technology Publications, Lda. All rights reserved

the classification is based on the content of the hand-
written digits, it may happen that the classes are ill-
defined, neither well known and only few examples
of each class could be available. Second, even if most
of the time the categories of handwritten digits could
be well identified, it could happen that the catego-
rization is not so simple. The one-class classifica-
tion problem is different from the multi-class classi-
fication problem in the sense that in one-class clas-
sification it is assumed that only information of one
of the classes, the target class, is available (Tax and
Duin, 2001). SVM can be used as one-class classifier
which is of huge interest for our problem. One-Class
Support Vector Machine (OSVM) separates the target
from outliers, but does not put any special emphasis
on the target class low variance direction, which are
very crucial for one-class classification. Thus, Cova-
riance Guided OSVM (COSVM) classification met-
hod was proposed by (Khan et al., 2014) to emphasize
the low variance projectional directions of the training
data without compromising any important characte-
ristics. COSVM improves up on the OSVM method
by controlling the direction of the separating hyper-
plane through incorporation of the estimated cova-
riance matrix from the training data. However, the
COSVM method does not handle multi-modal target
class data.
In this paper, we propose a HWDR method which is
based on novel Subclass COSVM (SCOSVM). This
latter takes advantage of the target class clusters va-
riance information and improves upon the classical
COSVM method, by dividing the target class into
groups, where similar observations are assigned to the
same group or cluster. Then, we select the cluster low
variance direction which provides the most discrimi-
nating projectional directions, leading to the best clas-
sification accuracy. The SCOSVM is still based on
convex optimization problem, which could be solved
efficiently using classical numerical methods.
The rest of the paper is organized as follows: In the
next section, we will describe in details the propo-
sed HWDR method based on the novel SCOSVM.
Section 3 and section 4 present, respectively, the ex-
perimental setting and comparative evaluation of our
method to other methods based on relevant one-class
classifiers, on several common HWDR data sets. Fi-
nally, section 5 contains some concluding remarks.
2 PROPOSED METHOD
In this section, we describe in details our subclass
HWDR method. It consists of two main phases: Pre-
processing, feature extraction and selection. Then, fe-
ature classification using a novel Subclass COSVM
(SCOSVM).
2.1 Handwritten Digits Preprocessing
and Feature Extraction
In general, HWDR consists of three phases: Prepro-
cessing, feature extraction (and selection) and clas-
sification. The pre-processing technique or dimen-
sionality reduction (DR) allows an efficient data re-
presentation and makes them easier to handle. In the
preprocessing (filtering, segmentation, normalization,
thinning, etc.), we have some basic image proces-
sing to separate numbers from real samples or prepa-
ring data from dataset. Some of the common prepro-
cessing steps are centering, morphological operations
and more (Tuba et al., 2016).
Feature extraction is very important step that also
aims at reducing the dimension of the data, while ex-
tracting relevant information. In HWDR, features are
created from knowledge of the data. A good set of
features should represent characteristics that are par-
ticular for one class and be as invariant as possible to
changes within this class (Lauer et al., 2007).
Feature selection is important when we want to fit a
classifier using finite sample sizes. Using too many
features will introduce too much noise, and classi-
fiers can easily overt. To avoid this, the data is pre-
processed to remove as many noisy or redundant fe-
atures as possible. The implementation of the fea-
ture selection is used after feature extraction to con-
struct vector space. The main goal of feature se-
lection is to keep words with highest scores accor-
ding to a set of predefined measures (Zi-qiang et al.,
2006). A good feature selection metric should con-
sider problem domain and algorithm characteristics.
Since many classifiers cannot process efficiently the
raw images or data, many feature evaluation metrics
have been explored, notable among which are: Ho-
rizontal and vertical projection with dynamic thres-
holding (Jagannathan et al., 2014), projection histo-
grams are usually used for printed digit recognition
and combined with other feature sets, invariant mo-
ments like geometric moments, fourier coefficients,
prole correlations, karhunen-love coefficients, pixel
averages, Zernike moments and morphological are
the common choices for features. Each Handwritten
digit image is represented with same set of features
and a novel subclass COSVM classifier aims to detect
whether an input is part of the data the classifier was
trained on, or it is unknown.
A Novel Handwritten Digits Recognition Method based on Subclass Low Variances Guided Support Vector Machine
29

2.2 Subclass Low Variances Guided
Classification
In this section, we will present in details the OSVM
and COSVM since they are the basis of our proposed
method and then introduce the novel SCOSVM.
2.2.1 One-Class SVM (OSVM)
One-Class SVM has been proposed by Scholkopf
(Sch
¨
olkopf et al., 2001). Its main principle consists of
mapping the feature X via a kernel Φ method to a hig-
her dimensional feature space, where an hyperplane is
estimated to separate the training data from the origin
with maximum margin. This hyperplane can be mo-
deled by the following optimization problem:
min
w6=0,ρ
1
2
w
T
w − ρ+
1
vN
N
∑
i=1
ξ
i
, (1)
s.t. w
T
Φ(x
i
) ≥ ρ − ξ
i
, ξ
i
≥ 0 ∀i = 1, . . . N.
Where the weight vector w = (w
1
, . . . , w
N
) and the
offset ρ are the parameters to estimate, ξ
i
are the slack
variables to the optimization problem and v ∈ (0, 1]
is the key parameter that controls the fraction of out-
liers and that of support vectors (SVs). To solve the
OSVM optimization problem (1), we use Lagrange
multipliers (Sch
¨
olkopf et al., 2001) to find the dual
problem. By introducing the Lagrange variables, pro-
blem (1) becomes the following:
min
α
α
T
Qα (2)
s.t. 0 ≤ α
i
≤
1
vN
,
N
∑
i=1
α
i
= 1.
For clarity, we have used the vectorized form of α =
(α
1
, . . . , α
N
). Q is the kernel matrix for the training
data: Q(i, j) = K (x
i
, x
j
), i = 1, . . . , N; j = 1, . . . , N.
Now, w can be recovered using the following equa-
tion: w =
∑
N
i=1
α
i
Φ(x
i
).
However, it has been shown in (Moya et al., 1993)
that low variance direction of the target class are cru-
cial for one-class classification. Thus, to keep the ro-
bustness of the OSVM classifier intact while emphasi-
zing the small variance directions, (Khan et al., 2014)
have proposed the COSVM by incorporating the ker-
nel covariance matrix into the objective function of
the OSVM optimization problem.
2.2.2 Covariance Guided One-Class Support
Vector Machine (COSVM)
The convex optimization problem of COSVM method
can be described as follows:
min
α
α
T
(ηQ + (1 − η)∆)α (3)
s.t. 0 ≤ α
i
≤
1
vN
,
N
∑
i=1
α
i
= 1,
where ∆ = Q(I − 1
N
)Q
T
. I is the identity matrix, 1
N
is a matrix with all entries
1
N
and η is the tradeoff
parameter that controls the balance between the ker-
nel matrix Q and the dual kernel covariance matrix
∆. However, the COSVM method does not handle
multi-modal target class data. More precisely, it does
not take advantage of the target class clusters vari-
ance information. Thus, we propose a novel ’Subclass
COSVM’ (SCOSVM) method that aims to improve
the unimodal COSVM.
2.2.3 Subclass COSVM
The proposed SCOSVM is organized in twofold.
First, we divide data into groups using cluster va-
lidation, where similar observations are assigned to
the same cluster. Second, we plug the kernel cova-
riance matrix for each cluster into the optimization
problem of OSVM, derive the dual problem, mini-
mize the resulted problem for each target class cluster
and finally select the cluster low variance direction
which provides the most discriminating projectional
directions, leading to the best classification accuracy.
Let X = {x
i
}
N
i=1
represents the training data set of
N samples. Once the target class is divided into K
clusters {C
s
}
K
s=1
, where |C
s
| = N
s
, we incorporate the
kernel covariance matrix Σ
s
Φ
of each subclass or clus-
ter C
s
, ∀s ∈ {1, 2, . . . , K} into the OSVM optimisation
problem (1). In fact, the kernel covariance matrix
Σ
s
Φ
of the training cluster C
s
contains all projectional
directions, from high variance to low variance. We
can assume that if we plug the cluster kernel covari-
ance matrix into the optimization problem of OSVM,
during the optimization algorithm, the influence of
low variance directions will be fine-tuned. Hence, as
the optimization problem is finally solved, the weight
vector w
s
will be adjusted in a way that low variance
directions are emphasized more. The kernel covari-
ance matrix is defined as follows:
Σ
s
Φ
=
N
s
∑
i=1
(Φ(x
i
) − m
s
Φ
)(Φ(x
i
) − m
s
Φ
)
T
. (4)
VISAPP 2018 - International Conference on Computer Vision Theory and Applications
30
Where m
s
Φ
is the mean of the cluster C
s
calculated in
feature space:
m
s
Φ
=
1
N
s
N
s
∑
i=1
Φ(x
i
). (5)
Moreover, despite that Equation (4) provides a form
of the covariance matrix in kernel space, this form
is not directly computable. Therefore, we have to
use the kernel trick to represent the additional term
w
s
T
Σ
s
Φ
w
s
in terms of dot products only. From the the-
ory of reproducing kernels (Saitoh, 1998), we know
that any solution w
s
must lie in the span of all trai-
ning samples. Hence, we can find an expansion of w
s
of the form: w
s
=
∑
N
i=1
α
s
i
Φ(x
i
). By using the defini-
tions of Σ
s
Φ
(Equation (4)), m
s
Φ
(Equation (5)) and the
kernel function K (x
i
, x
j
) =< Φ(x
i
), Φ(x
j
) >, ∀i, j ∈
{1, 2, . . . , N}, we can derive the dot product form as
follows: w
s
T
Σ
s
Φ
w
s
= α
s
T
∆
s
α
s
. ∆
s
is the dual version
of Σ
s
Φ
:
∆
s
= Q
s
T
(I − 1
N
s
)Q
s
. (6)
Q
s
is the kernel matrix of the cluster C
s
, defined by
Q
s
(i, j) = K (x
i
, x
j
), i = 1, . . . , N
s
; j = 1, . . . , N. Thus,
our method consists of solving the following optimi-
zation problem:
min
α
s
α
s
T
(ηQ + (1 − η)∆
s
)α
s
(7)
s.t. 0 ≤ α
i
s
≤
1
vN
,
N
∑
i=1
α
i
s
= 1.
Where η is the balance control parameter between the
whole target class kernel matrix Q and dual kernel
covariance matrix ∆
s
and α
s
= {α
i
s
}
N
i=1
, s = 1, . . . , K
are the weights to be computed for the cluster C
s
, s =
1, . . . , K. Here, η can take value from 0 to 1 and it
is estimated by applying the unimodal COSVM on
whole target class. We are aware that this estima-
tion could be suboptimal, especially, when the tar-
get class clusters have different low variance directi-
ons, but we claim that they have very negligible ef-
fect on classification accuracy, since a further fine-
tuning low variance selection is performed using the
dual kernel covariance matrix term. Moreover, our
assumption avoids the high complexity of computing
multiple η values for different clusters. The propo-
sed method still results in a convex optimization pro-
blem since both the kernel matrix Q and the dual
covariance matrix ∆
s
are positive definite (Michelli,
1986). Finally, we solve the optimization problem for
each target class cluster C
s
, s = 1, . . . , K, and then the
weights α
s
∗
= {α
i
s
∗
}
N
i=1
that lead to the most discri-
minating projectional directions are selected for best
classification accuracy. The optimization problem
of SCOSVM (7) is solved using the Lagrange mul-
tipliers and the SVM-KM toolbox (Rakotomamonjy
et al., 2007).
2.2.4 Schematic Depictions
In this section, we present schematic depictions to
show the advantage of our SCOSVM method over the
unimodal COSVM.
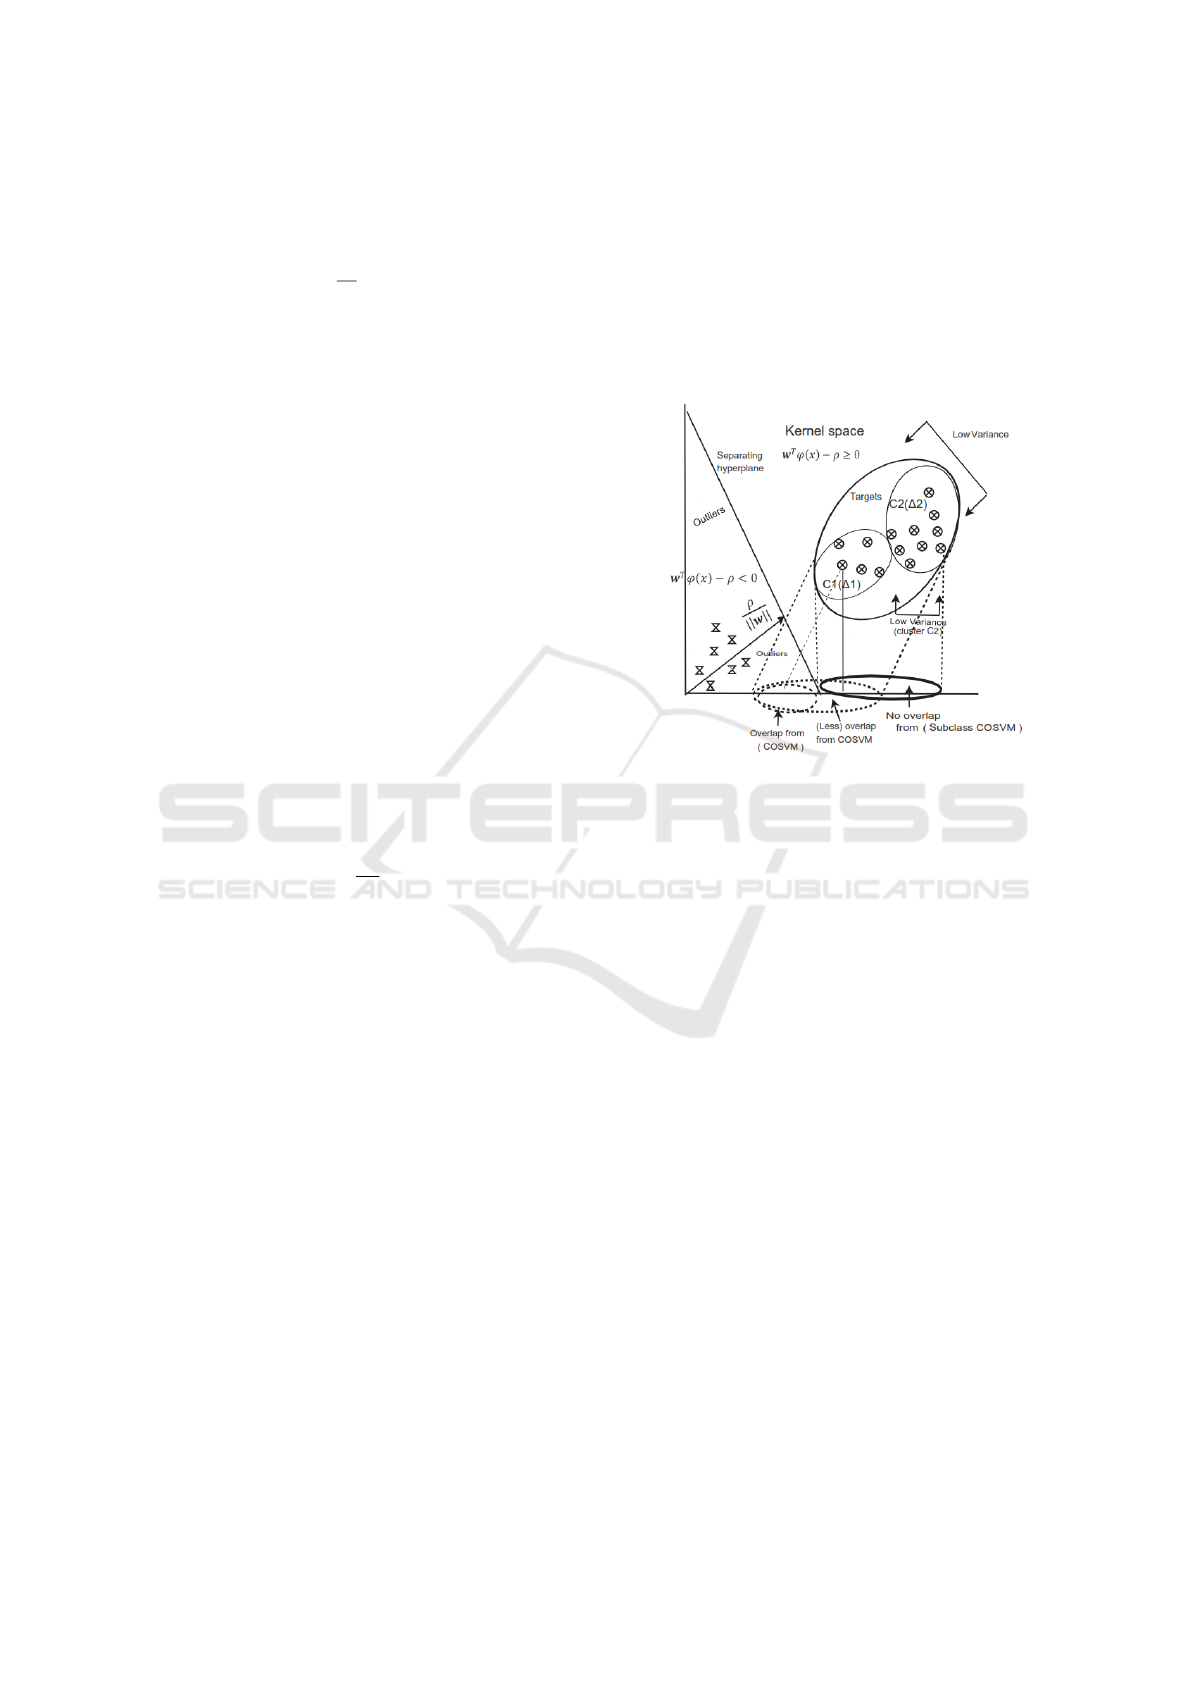
Figure 1: General Case: The value of the tradeoff parame-
ter η is set equal to 0. The COSVM linear projection in
target class low variance direction (depicted by dotted ar-
rows), results in overlap between the target class examples
and hypothetical outlier data (circled by dotted boundary),
while an optimally tuned SCOSVM projection in C
2
low va-
riance direction (depicted by solid arrows), does not result
in any overlap (circled by solid boundaries).
According to Figure 1, the value of the tradeoff
parameter η is set equal to 0. Thus, the projecti-
ons for COSVM and SCOSVM are based only on
optimizing the dual kernel covariance matrix terms.
The projection of the target class in low variance di-
rection, results in higher overlap between the target
class and the outliers data points (circled with dotted
boundary). However, on the other hand, projecting
the target class in the sub class C
2
low variance di-
rection, does not result in any overlap. This shows
clearly that our subclass method performs better than
the unimodal COSVM method.
2.3 HWDR Method Algorithm
The following algorithm describes our proposed
subclass HWDR method:
A Novel Handwritten Digits Recognition Method based on Subclass Low Variances Guided Support Vector Machine
31

Algorithm 1: HWDR method algorithm.
1. Let X = {x
i
}
N
i=1
represent the training data set
of N samples, which are the features vectors as-
sociated to database Handwritten Digits. Divide
X into K clusters {C
s
}
K
s=1
, where |C
s
| = N
s
, ∀s ∈
{1, 2, . . . , K}.
2. Estimate the target class kernel matrix Q and
kernel matrix Q
s
for each cluster C
s
, ∀s ∈
{1, 2, . . . , K}.
3. Estimate the dual covariance matrix ∆
s
of each
cluster C
s
using (6).
4. Apply COSVM method for all data and find the
parameter η.
5. Solve the optimisation problem (7) for each clus-
ter C
s
, s = 1, . . . , K.
6. Select the weights α
s
∗
= {α
i
s
∗
}
N
i=1
and the cluster
low variance direction which allow the best clas-
sification accuracy.
7. HWDR phase.
3 EXPERIMENTAL SETTING
In this section, we will describe the Handwritten Di-
gits datasets used and provide the experimental proto-
col.
3.1 Datasets Used
We have employed publicly available datasets, which
have been widely adopted in relevant research works
based on Handwritten Digits Classification, namely,
“The Optical Recognition of Handwritten Digits”
(Bache and Lichman, 2013) and “The MNIST Data-
base of Handwritten Digits” (Deng, 2012).
3.1.1 Optical Recognition of Handwritten Digits
This database is hosted in the well-known UCI Ma-
chine Learning Repository (Bache and Lichman,
2013), and consists of features of handwritten nume-
rals (
0
0
0
...
0
9
0
). 200 patterns per class are represen-
ted in terms of the following six feature sets: Fou-
rier coefficients of the character shapes (mfea fou),
Profile correlations (mfeat fac), Karhunen-Love coef-
ficients (mfeat kar), Pixel averages (mfeat pix), Zer-
nike moments (mfeat zer) and Morphological featu-
res (mfeat mor). A detailed description of the data
sets used can be found in Table (1): Each file is com-
posed of 2000 samples, where 1400 samples are for
training (target class) and the remaining 600 samples
are for testing.
3.1.2 The MNIST Database of Handwritten
Digits
The Mixed National Institute of Standards and
Technology (MNIST) database of handwritten digits
has a training set of 60, 000 examples, and a test set of
10, 000 examples. It is a subset of a larger set availa-
ble from NIST. The digits have been size-normalized
and centered in a fixed-size image. In order to be
classified, the modified image file had to be conver-
ted from a 2 dimensional 28 by 28 px array into a 784
column wide row vector. The dataset contains X and
Y , the matrices of examples and labels respectively.
Each row of X is a vectorized 28x28 grayscale image
of a handwritten digit from the MNIST dataset. We
tested our algorithm on limited set of digits. Figure
2 shows HWD images from MNIST database. We
created different datasets by randomly split the data-
set into a training and a test set; different number of
training and testing points are described in Table (2).
3.2 Experimental Protocol
We choose the clustering method and the validity in-
dex proposed in (Bouguessa et al., 2006), as it per-
forms well when clusters overlap or there is signi-
ficant variation in their covariance structure. First,
for all data sets used, we set the number of clusters
C
min
= 2 and C
max
= 10 with the assumption that each
data sets target has a minimum of 2 clusters (sub-
class) to a maximum of 10 clusters. Second, we used
10-fold stratied cross validation. In fact, we added
10% randomly selected data to the outliers for testing,
and the remaining was used as the training data. To
build different training and testing sets, this approach
was repeated 10 times. The final result was achieved
by averaging over these 10 models. This ensures that
the achieved results were not a coincidence.
In one-class classifiers and novelty detection, the
Receiver Operating Characteristic (ROC) curves is a
useful assessment tool for organizing classifiers and
visualizing their performance (Cabral and de Oliveira,
2011). The ROC curve is created by plotting the
True Positive Rate (TPR) vs the False Positive Rate
(FPR). Informally, one point in ROC space is better
than another if it is to the northwest (TPR) is hig-
her, (FPR) is lower. ROC curve depends on rates of
correct and incorrect target detection (TPR and FPR)
(Hanley and McNeil, 1983). It does not depend on the
number of training data points or outlier data points.
Besides, The Area Under the ROC Curve (AUC) (Fa-
wcett, 2004) is thus a good measure of the classifica-
VISAPP 2018 - International Conference on Computer Vision Theory and Applications
32

Table 1: Description of the Optical Recognition of Handwritten Digits Data Sets.
Data set Name Number of Features Number of clusters
mfea fou 216 5
mfeat fac 76 4
mfeat kar 64 5
mfeat pix 240 2
mfeat zer 53 3
mfeat mor 6 1
Figure 2: Example: Handwritten Digits Images from MNIST Database.
Table 2: Description of MNIST Database of Handwritten Digits.
Data set Name Number of Training Number of Testing Number of clusters
Set A 1000 895 4
Set B 900 995 4
Set C 895 1000 3
Set D 500 1000 3
Set E 100 1000 2
Set F 70 1000 2
Set G 200 1500 2
Set H 150 1700 2
Set I 150 800 2
Set J 595 1300 3
Set K 195 1700 2
tion performance. Consequently, the AUC criterion
must be maximized in order to obtain a good separa-
tion between targets and outliers. We performed pai-
red t-tests on the AUC values (Press et al., 2007) by
pairing up the SCOSVM method with each method at
a time. The paired t-test determines whether or not
two sets of measured values are significantly diffe-
rent.
4 EXPERIMENTAL RESULTS
AND ANALYSIS
In this section, we perform a comparative evalua-
tion of SCOSVM to OSVM, Mahalanobis OSVM
(MOSVM) (Tsang et al., 2006) and unimodal
COSVM (SCOSVM). The η for OSVM, COSVM
and SCOSVM was set to 0.2. The radial basis kernel
with width σ was used for kernelization in OSVM,
COSVM and SCOSVM. For a practical application,
A Novel Handwritten Digits Recognition Method based on Subclass Low Variances Guided Support Vector Machine
33

Table 3: Average AUC of each method for the 11 Data Sets of MNIST Database of Handwritten Digits (best method in bold,
second best emphasized). The last row contains the paired t-test confidence intervals.
Data set Name OSVM MOSVM COSVM SCOSVM
Set A 49.60 49.19 49.60 50.10
Set B 48.93 46.80 50.05 51.40
Set C 49.01 50.24 50.50 52.50
Set D 51.58 52.53 53.71 54.30
Set E 55.63 52.36 56.02 57.32
Set F 54.56 51.82 54.58 56.17
Set G 52.38 51.96 52.70 54.19
Set H 47.06 47.25 47.52 50.19
Set I 49.25 48.07 49.62 50.05
Set J 51.04 51.05 51.74 52.12
Set K 50.34 55.43 56.49 57.07
Confidence 94.90 96.63 99.96 -
Table 4: Average AUC of each method for the 6 Data Sets of Optical Recognition of Handwritten Digits (best method in bold,
second best emphasized). The last row contains the paired t-test confidence intervals.
Data set Name OSVM MOSVM COSVM SCOSVM
mfea fou 50 50.27 50.60 50.85
mfeat fac 50.62 49.88 50.62 50.86
mfeat kar 50 50.36 50.32 50.65
mfeat pix 50.18 49.62 50.29 50.54
mfeat zer 50 45.55 50.76 51.75
mfeat mor 50.69 49.75 50.73 50.73
Confidence 98.82 94.14 88.97 -
Table 5: Average training times (per model) in seconds for COSVM and SCOSVM for the experiments on the Handwritten
Digits Data Sets.
Experiment COSVM SCOSVM
Optical Recognition of Handwritten Digits 0.47 1.73
MNIST Database of Handwritten Digits 0.50 0.89
Figure 3: ROC curves for the three classifiers (OSVM, COSVM, SCOSVM) for one model from the data set mfeat zer.
these parameters can be adjusted and the system can
be re-trained time-to-time if necessary. Table (4) and
Table (3) contain the average AUC (Area Under the
Curve) values obtained for the classifiers on the “Op-
tical Recognition of Handwritten Digits” and “The
MNIST Database of Handwritten Digits” datasets, re-
spectively. As we can see, the SCOSVM is superior to
all the other classifiers and provides best results on all
VISAPP 2018 - International Conference on Computer Vision Theory and Applications
34

most data sets, in terms of the obtained unbiased AUC
values by averaging over 10 different models. This
strengthens our claim that by emphasizing each sub-
class low variance directions will allow the best se-
paration between the target class and outliers, which
results in best performance. Also, according to Table
(4) and Table (3), the AUC values average is around
50%, this is expected as both used datasets (“MNIST
Database of Handwritten Digits” and “Optical Recog-
nition of Handwritten Digits”) are highly overlapped.
The last rows of Table (4) and Table (3) provides the
confidence intervals (in %) obtained from the perfor-
med t-tests. This confidence interval quantifies the
probability of the paired distributions being the same.
The higher the confidence interval, the lower is the
probability that the underlying distributions are sta-
tistically indifferent. As we can see, all the confi-
dence intervals are high, which shows that SCOSVM
indeed provides statistically significant accuracy im-
provements.
In terms of training computational complexity, the
COSVM algorithm uses sequential minimal optimi-
zation to solve the quadratic programming problem,
and therefore scales with is O(N
3
). According to the
Equation (7) the SCOSVM scales with same com-
plexity. However, we expect that SCOSVM has hig-
her training time, especially, as target class has several
clusters. Table (5) shows the average training times
per model for the data sets. As we expect, the running
time of the SCOSVM method is reasonably higher
than the unimodal COSVM classifier. We also present
some individual graphical results for the data set mo-
dels by plotting the actual Receiver Operating Cha-
racteristics (ROC) for the data set (mfeat zer). Figure
3 shows the ROC curves for three classifiers (OSVM,
COSVM, SCOSVM) for one out of the 10 models for
this data set. We can clearly see from Figure 3 that
SCOSVM indeed leads to a best ROC curve in terms
of performance (Nallammal and Radha, 2010).
5 CONCLUSION
In this paper, we investigate the effectiveness of a
novel SCOSVM classification approach (SCOSVM)
in Handwritten Digits Recognition. Comparatively
to the unimodal COSVM, the SCOSVM is able to
handle multi-modal target class, and takes advantage
of the target class clusters low variance directions, to
improve classification performance. The evaluation
and comparison are carried out on the relevant Hand-
written Digits datasets, namely, “The Optical Recog-
nition of Handwritten Digits” and “The MNIST Da-
tabase of Handwritten Digits”, where we compared
our method against contemporary one-class classi-
fiers. Results have shown the superiority of the met-
hod. Future work will consist in validating the propo-
sed novel SCOSVM on strong applications, such as,
face recognition, anomaly detection, etc.
REFERENCES
Bache, K. and Lichman, M. (2013). UCI machine learning
repository.
Bouguessa, M., Wang, S., and Sun, H. (2006). An objective
approach to cluster validation. Pattern Recognition
Letters, 27(13):1419–1430.
Cabral, G. G. and de Oliveira, A. L. I. (2011). A novel one-
class classification method based on feature analysis
and prototype reduction. In SMC, pages 983–988.
Cortes, C. and Vapnik, V. (1995). Support vector networks.
Machine Learning, 20:273–297.
Deng, L. (2012). The MNIST database of handwritten digit
images for machine learning research. IEEE Signal
Process. Mag., 29(6):141–142.
Ebrahimzadeh, R. and Jampour, M. (2014). Efficient hand-
written digit recognition based on histogram of orien-
ted gradients and SVM. International Journal of Com-
puter Applications., 104(9):10–13.
Fawcett, T. (2004). ROC graphs: Notes and practical consi-
derations for researchers. Machine learning, 31:1–38.
Gorgevik, D. and Cakmakov, D. (2004). An efficient three-
stage classifier for handwritten digit recognition. In
ICPR (4), pages 507–510.
Hanley, J. A. and McNeil, B. J. (1983). A method of com-
paring the areas under receiver operating characteris-
tic curves derived from the same cases. Radiology,
148(3):839–843.
Jagannathan, J., Sherajdheen, A., Muthu Vijay Deepak, R.,
and Krishnan, N. (2014). License plate character
segmentation using horizontal and vertical projection
with dynamic thresholding. In International Confe-
rence on Emerging Trends in Computing, Communi-
cation and Nanotechnology., pages 700–705.
Khan, N. M., Ksantini, R., Ahmad, I. S., and Guan, L.
(2014). Covariance-guided one-class support vector
machine. Pattern Recognition, 47(6):2165–2177.
Larroza, A., Moratal, D., Paredes-Sanchez, A., Soria-
Olivas, E., Chust, M. L., Arribas, L. A., and Arana,
E. (2015). Support vector machine classification of
brain metastasis and radiation necrosis based on tex-
ture analysis in MRI. Journal of Magnetic Resonance
Imaging., 42(5):1362–1368.
Lauer, F., Suen, C. Y., and Bloch, G. (2007). A trainable fe-
ature extractor for handwritten digit recognition. Pat-
tern Recognition, 40(6):1816–1824.
Mahmoud, S. A. and Al-Khatib, W. G. (2011). Recognition
of arabic (indian) bank check digits using log-gabor
filters. Appl.Intell., 35(3):445–456.
Malon, C., Uchida, S., and Suzuki, M. (2008). Mathemati-
cal symbol recognition with support vector machines.
Pattern Recognition Letters, 29(9):1326–1332.
A Novel Handwritten Digits Recognition Method based on Subclass Low Variances Guided Support Vector Machine
35

Michelli, C. (1986). Interpolation of scattered data:
distance matrices and conditionally positive denite
functions. Constructive Approximation, 2:11–22.
Moya, M., Koch, M., and Hostetler, L. (1993). One-class
classifier networks for target recognition applications.
In Proceedings of World Congress on Neural Net-
works.
Nallammal, N. and Radha, V. (2010). Performance evalua-
tion of face recognition based on PCA, LDA, ICA and
hidden markov model. In ICDEM, pages 96–100.
Niu, X.-X. and Suen, C. Y. (2012). A novel hybrid CNN-
SVM classifier for recognizing handwritten digits.
Pattern Recognition, 45(4):1318–1325.
Press, W. H., Teukolsky, S. A., Vetterling, W. T., and Flan-
nery, B. P. (2007). Numerical Recipes 3rd Edition:
The Art of Scientific Computing. Cambridge Univer-
sity Press.
Rakotomamonjy, A., Grandvalet, Y., Canu, S., and Guigue,
V. (2007). SVM and kernel methods toolbox, version
1.9.1.
Saitoh, S. (1998). Theory of Reproducing Kernels and its
Applications. Longman Scientic and Technical.
Sch
¨
olkopf, B., Platt, J. C., Shawe-Taylor, J., Smola, A. J.,
and Williamson, R. C. (2001). Estimating the support
of a high-dimensional distribution. Neural Computa-
tion, 13(7):1443–1471.
Tax, D. M. J. and Duin, R. P. W. (2001). Uniform object ge-
neration for optimizing one-class classifiers. Journal
of Machine Learning Research, 2:155–173.
Tsang, I. W., Kwok, J. T., and Li, S. (2006). Learning the
kernel in mahalanobis one-class support vector machi-
nes. In IJCNN, pages 1169–1175.
Tuba, E., Tuba, M., and Simian, D. (2016). Handwritten
digit recognition by support vector machine optimized
by bat algorithm. In 24th International Conference in
Central Europe on Computer Graphics, Visualization
and Computer Vision., pages 369–376.
Zhang, Y., Wang, S., Phillips, P., and Ji, G. (2014).
Binary PSO with mutation operator for feature se-
lection using decision tree applied to spam detection.
Knowledge-Based Systems., 64:22–31.
Zi-qiang, W., Xia, S., Dexian, Z., and Xin, L. (2006). An
optimal SVM-based text classification algorithm. In
International Conference on Machine Learning and
Cybernetics, pages 1378 – 1381.
VISAPP 2018 - International Conference on Computer Vision Theory and Applications
36
