
Weather-Tuned Network Perimeter Control
A Network Fundamental Diagram Feedback Controller Approach
Maha Elouni and Hesham Rakha
Center for Sustainable Mobility, Virginia Tech Transportation Institute,
3500 Transportation Research Plaza, Blacksburg, VA 24061, U.S.A.
Keywords: NFD, PI Controller, Gating, Inclement Weather.
Abstract: Inclement weather has been shown to increase congestion, justifying the need for weather-responsive traffic
control. From one side, all existing weather-responsive controllers currently operate on freeways or limited
road segments. From the other side, existing controllers operating on networks do not take into
consideration the weather effect on the network fundamental diagram (NFD). This paper describes the
development of a macroscopic weather-tuned perimeter controller. First, an NFD-based proportional-
integral perimeter controller (PC) is implemented in INTEGRATION, tuned using clear weather data and
then tested for clear and inclement weather conditions. In order to respond to weather changes, new sets of
control parameters were tuned for each weather and given to the controller. This weather-tuned perimeter
controller (WTPC) is compared to the regular PC. Simulation results show that the WTPC reduces
congestion inside the protected sub-network better than PC. Also, it improves the performance of the full
network (inside and outside the protected sub-network) in terms of average speed and total delay. Compared
to the non-perimeter control case, WTPC increases the average speed of the entire network by 28.61% for
rain and 42.64% for snow conditions. Total delay is decreased by 33.26% and 42.02% for rain and snow,
respectively.
1 INTRODUCTION
Traffic managers employ various management
strategies to maintain safety and improve roadway
mobility. This task becomes more challenging with
adverse weather, as weather events may increase
both crash rates and congestion. According to the
Federal Highway Administration (FHWA, 2017),
22% of vehicle crashes are weather-related crashes.
Of these, 46% occurred in rainy conditions and 13%
in snowy or sleety conditions. Average speed, traffic
volumes, saturation flow rates, free-flow speed, and
travel time delays are also negatively affected by
inclement weather on arterials and freeways.
(Romain et al.) found that there is an average
decrease of 15.5% in capacity and 9% in free-flow
speed and (Agarwal et al., 2005, Maze et al., 2006)
reported capacity reductions of 4–30% and speed
reduction rates of 3–15% during rainy conditions.
(Xu et al., 2013), studied the impact of rain in a
network finding that heavy rain and rainstorms
reduced the network critical accumulation and
maximum production by 10.5%, 16.7% and 21%,
18.7% respectively. (Tsapakis et al., 2013),
considered different intensities of rain, snow, and
temperature levels to study the effect of weather on
travel times in an urban network, finding that total
travel time increases due to light, moderate, and
heavy rain by 0.1–2.1%, 1.5–3.8% and 4.0–6.0%,
respectively. They found light snow increases travel
time by 5.5–7.6% and heavy snow increases delays
by 7.4 to 11.4%. (Rakha et al., 2008) demonstrated
that traffic stream jam density is not affected by
weather conditions, and that reductions in free-flow
speed and speed-at-capacity increase as the rain and
snow intensities increase. Precipitation intensity
affects the roadway capacity only during snow. The
authors developed weather adjustment factors to
calculate the free-flow speed, speed-at-capacity, and
capacity as a function of precipitation type, intensity
and visibility level.
(Pisano and Goodwin, 2004) introduced the idea
of weather responsive traffic management, analyzing
the impacts of adverse weather on traffic flow and
presenting three categories of operational strategies
that may improve safety, mobility and productivity.
82
Elouni, M. and Rakha, H.
Weather-Tuned Network Perimeter Control.
DOI: 10.5220/0006679900820090
In Proceedings of the 4th International Conference on Vehicle Technology and Intelligent Transport Systems (VEHITS 2018), pages 82-90
ISBN: 978-989-758-293-6
Copyright
c
2019 by SCITEPRESS – Science and Technology Publications, Lda. All rights reserved

The operational strategies are classified into three
categories: 1) treatment strategies like coordination
with maintenance managers for snow or ice control;
2) control strategies such as signal timing, ramp
metering, and variable speed limits; 3) advisory
strategies like public notification of road closure and
warning systems (Systematics, 2003).
Concerning control strategies, (Goodwin and
Pisano, 2004) introduced some successful methods
to change signal timings in response to weather. The
authors identified the parameters that need to be
modified to simulate weather impacts on arterial
traffic flow using CORSIM. Their studies revealed
that weather-responsive signal timing could improve
mobility by increasing average speed and reducing
delays. (Papageorgiou et al., 2008) found that
variable speed limits decrease the slope of the flow
occupancy diagram at under-critical conditions,
increase the critical occupancy, and enable higher
flows at the same occupancy values in overcritical
conditions. These strategies mitigate localized
weather impacts on relatively short road segments
(Pisano and Goodwin, 2004).
This paper describes the implementation of a
weather-tuned control strategy on a macroscopic
level. The control strategy is based on the
macroscopic fundamental diagram (MFD) also
known at the Network Fundamental Diagram
(NFD), which gives an aggregated view of the
network characteristics: density, flow, and space
mean speed. NFD’s physical model was initially
proposed by (Godfrey, 1900). It was observed with
dynamic features in a congested urban network in
Yokohama by (Geroliminis and Daganzo, 2008).
Their analyses and simulations have shown that
NFDs are curves that can be reproduced under
homogeneous conditions in urban networks. They
have also shown that NFDs are a property of
infrastructure and not of demand, which means that
the average flow in a network is at maximum for the
same density value, regardless of the time-varying
origin-destination (O-D) tables.
Further research has been conducted for the
investigation of NFDs using empirical and simulated
data. (Buisson and Ladier, 2009) were the first to
test how the NFD changes if the congestion is not
homogeneous within the network. (Ji et al., 2010)
recreated inhomogeneous conditions in an urban
freeway traffic simulation with several on-ramps,
finding that inhomogeneous congestion leads to a
reduction in flow. They presented control strategies
to be followed using ramp metering to create
homogeneous traffic states. (Mazloumian et al.,
2010) and (Geroliminis and Sun, 2011) found that
the spatial variability of vehicle flow density affects
the shape, the scatter, and the existence of an NFD.
In fact, heterogeneous networks might not have a
well-defined NFD, especially in the decreasing part
of the NFD, as scatter becomes higher when
accumulation increases, leading to the appearance of
a hysteresis loop. In order to address this issue, (Ji
and Geroliminis, 2012) created clustering algorithms
to create homogeneous sub-networks to obtain small
variance of link densities within a cluster. This
approach is useful for large congested networks with
strong heterogeneity. NFD-based traffic flow might
then be used in single-region cities (Daganzo, 2007)
(Haddad and Shraiber, 2014) or in multi-region
cities, each having a well-defined NFD (Aboudolas
and Geroliminis, 2013, Haddad and Geroliminis,
2012).
The idea of perimeter control (or gating) based
on the NFD consists of attempting to maintain the
accumulation around a set point (which corresponds
to the maximum throughput) in order to avoid the
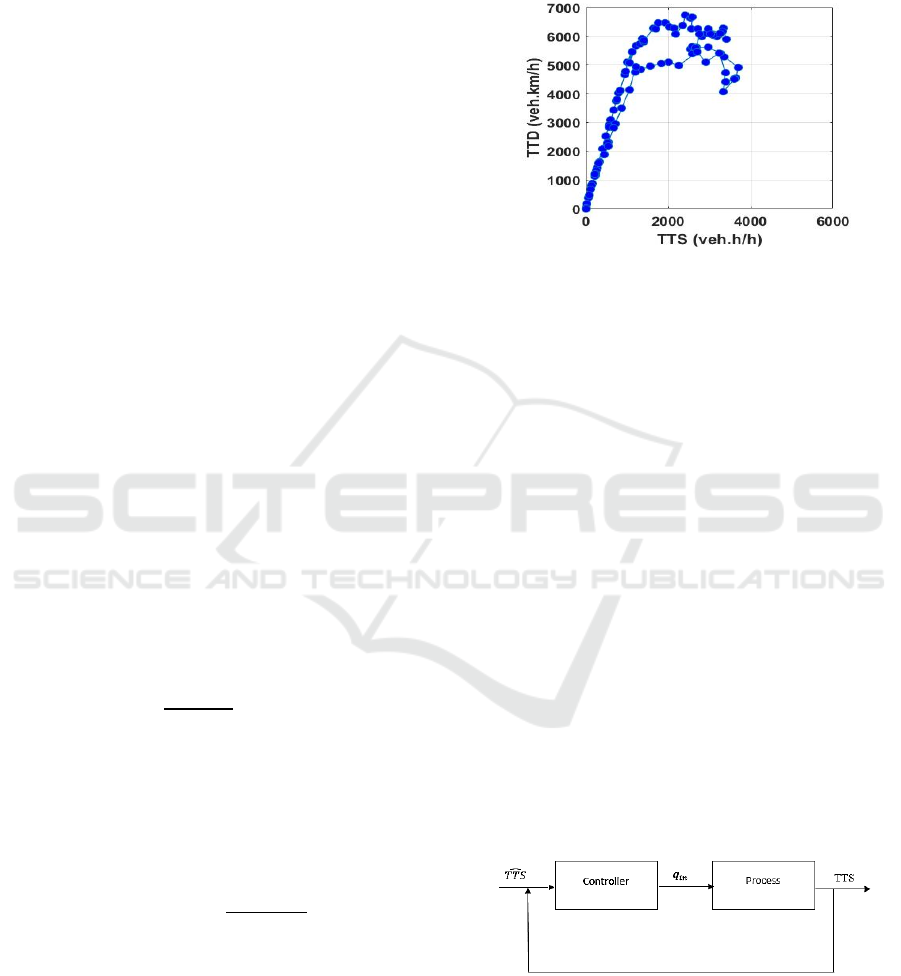
oversaturation or congestion regime (Figure 1).
Figure 1: NFD of a network.
(Li et al., 2012) investigated a perimeter control
strategy of an oversaturated network using the NFD
concept. The optimization goal was to maximize
capacity utilization of the network and prevent
queue spillback. The phase sequence and offset were
optimized by a Genetic Algorithm (GA) to minimize
the network delay. They have implemented the
signal timing outputs in TRANSYT-7F and showed
that their proposed model performs better than
TRANSYT-7F in congested networks. However, the
approach proposed a fixed signal timing method
which is not adapted to the real-time traffic
conditions. There are many works in the literature
that overcome that issue and operate real time
perimeter control. They use different techniques like
the standard proportional integral (PI) controller
(Keyvan-Ekbatani et al., 2012), Robust PI controller
(Haddad and Shraiber, 2014) and Model Predictive
Weather-Tuned Network Perimeter Control
83

controller (Sirmatel and Geroliminis, 2016).
However our focus will be in standard proportional
integral Controller because it is simple and
computationally cheap.
(Keyvan-Ekbatani et al., 2012) described a
simple real-time feedback-based gating concept,
which exploits the urban NFD for smooth and
efficient traffic control operations. They used a
standard proportional-integral (PI) feedback
controller, and applied the method to a network in
Chania, Greece and tested it using the microscopic
traffic simulator AIMSUN. Although simple, the
method has been proven to be very efficient.
Compared to the non-control case, the average
vehicle delay per km was reduced by 35%, the mean
speed increased by 39.2% and the total number of
vehicles that exit the overall network increased.
The method assumed that the real-time
measurements of all links within the protected
network are fed to the regulator which is not
convenient in terms of implementation cost for a
real-time system. (Keyvan-Ekbatani et al., 2013),
demonstrated that feedback-based perimeter control
is possible with much less real-time measurements
than in their previous work.
The aforementioned strategies assume that the
gating is applied directly at the border of the
protected network. However, in reality, this could
not always be satisfied due to some restrictions such
as unavailability of proper links to store the gated
vehicles. For that reason, (Keyvan-Ekbatani et al.,
2015) included a time delay in the feedback-
perimeter control strategy so that it handles the
metering at some junctions further upstream from
the protected network.
All these works assume that the links on which
the perimeter control is applied are long enough to
handle the queues of the gated vehicles. In order to
overcome that limitation and also to obtain a more
homogeneous density distribution in PN, (Keyvan
Ekbatani et al., 2016) combined the feedback
perimeter control strategy with the adaptive traffic
signals control. They applied the gating at the
borders of the PN and traffic-responsive adaptive
signal control strategy inside the PN. The
combination of these two strategies led to higher
overall vehicle throughputs and hence shorter
queues at the boundary of the PN, higher speeds and
lower network delays.
(Keyvan-Ekbatani et al., 2017) proposed
strategies for queue and delay balancing at the gated
links under perimeter control. Their approaches
could be used for flow distribution among the gated
links, especially in multi-region perimeter control as
they reduce the impact of queuing on NFDs of the
regions.
All of the mentioned works are very interesting
and effective. However, they do not consider the
effect of weather on the NFD. Also, they did not test
the efficiency of the control method for different
weather conditions which are the objectives of this
paper. Consequently, the objectives and the
contributions of this work are as follows: (1)
Implement a feedback-based standard proportional
integral perimeter control (PC) strategy in the
INTEGRATION micro-simulator. (2) Study its
impacts on the protected network’s (PN’s) NFD and
on the full network (FN) for different weather
conditions. The full network is the zone inside and
outside the protected network. (3) Develop a
weather-tuned perimeter control (WTPC) strategy
and evaluate its impact on the NFD of the PN and on
the performance of the FN. (4) Compare the WTPC
with the PC and the non-control (NPC) cases. (5)
Validate the obtained results of the WTRC by
testing it for different rain and snow intensities.
2 NETWORK DESCRIPTION
AND MACROSCOPIC
FUNDAMENTAL DIAGRAM
2.1 Network Setup
The modelled network was used for studying the
impact of the implemented PC strategy on the NFD.
For that reason, a PN was identified; this is the sub-
network that needs to be protected from congestion.
The PN corresponds to the zone surrounded by the
green rectangle in the middle of the network in
Figure 2.
Figure 2: Grid network modelled in INTEGRATION.
VEHITS 2018 - 4th International Conference on Vehicle Technology and Intelligent Transport Systems
84
The PN contained 91 links, as shown in Figure 2.
The yellow chevrons represent the four links where
gating was applied. The gated links were long
enough such that they were able to accommodate the
queues caused by gating without spilling back onto
other links. Future work will integrate queue spill
back prevention strategies. All links were one way
and each link had only one lane.
The full network (FN) comprised 36 signalized
intersections running on a fixed-time plan. The
origins and destinations are represented by blue
circles (Figure 2). Loop detectors were placed on
each link in the network to collect the needed
measurements, and those measurements were
collected every cycle (60 s in this study). The traffic
demand was loaded for 75 minutes, with demand
increasing during the first 37.5 minutes, and
decreasing during the second 37.5 minutes,
representing realistic demand behaviour. In order to
ensure that the network was empty at the end of the
simulation, the total simulation time was set to be
176 minutes (approximately 3 hours). A feedback
dynamic traffic assignment was activated to reflect
realistic driver behaviour during congested
conditions.
2.2 NFD Equations Derivation
In this work, the NFD is presented based on the total
time spent (TTS) and the total travelled distance
(TTD), which are calculated from the loop detectors
measurements. The TTS (in veh.h/h) corresponds to
the number of vehicles in all the network links and is
calculated using Equation (1).
(
)
=
.
()
∈
=
(
)
∈
(1)
where z is the link; Z is the set of measurements
links , k = 0, 1, 2, … is an index reflecting the cycle
number; T is the duration of the cycle;
(
)
is the
measured number of vehicles on link z during cycle
k. It is calculated by Equation (2).
(
)
=
.
.
.
( −1)
100
(2)
where
is the length of link z;
is the number
of lanes on link z;
is the jam density;
is the
measured time-occupancy (in %) on link z during
cycle k.
The TTD (in veh.km/h) corresponds to the length
weighted sum of the corresponding network link
flows. It is calculated using Equation (3).
(
)
=
(
)
.
∈
(3)
where
(
)
is the measured flow on link z
during cycle k.
Figure 3: NFD of the protected network (PN).
Running a simulation in INTEGRATION, we
obtain the NFD presented in Figure 3. The
maximum throughput occurs in a TTS range of
[1800, 3000]. Note that the NFD has a decreasing
area corresponding to the congestion regime,
indicating the need for a control strategy to mitigate
congestion in the PN.
3 IMPLEMENTATION OF THE
PERIMETER CONTROLLER
(PC)
3.1 Mathematical Modelling
In order to avoid congestion inside the PN, a PI PC
is applied based on the NFD. The idea of the PC is
to maintain the TTS around a set value
, which
corresponds to the maximum TTD. In our case,
= 2000ℎ.ℎ/ℎ, which is within the range of
the TTS values corresponding to the maximum TTD
[1800, 3000].
Figure 4: System and feedback controller structure.
The system and feedback controller structure is
represented in Figure 4. The process, shown in
Equation (4), is what happens in the PN—its input is
, which corresponds to the PN’s entering flow,
Weather-Tuned Network Perimeter Control
85
and its output is
TTS. Further details about the
derivation of the process of Equation (4) can be found in
(Keyvan-Ekbatani et al., 2015, Keyvan-Ekbatani et al.,
2012).
∆
(
+1
)
= ∆
(
)
+.Δ
()
(4)
where Δ = −̅ and ̅ corresponds to the
steady state variable used in the model linearization.
The desired steady state is common in control
engineering, and in this case, it corresponds to the
region where the TTD is maximal. Note that
=
. and are two model parameters that can be
found using a least squares approximation of the
simulated data (
, TTS) around the maximum TTS
range.
The controller’s inputs are TTS and
, and its
output is the ordered flow that should enter the PN.
Equation (5) corresponds to the proportional-integral
feedback regulator equation.
(
)
=
(
−1
)
−
(
)
−
(
−1
)
+
(
−
(
)
)
(5)
where
and
are the proportional and integral
gains, respectively. These can be found by manual
fine-tuning or using control engineering methods.
More details about finding these gains can be found
in (Keyvan-Ekbatani et al., 2012, Keyvan-Ekbatani
et al., 2015).
The controller ordered flow
is distributed
among the gated links. The flow entering the PN
from each gated link has to be between two bounds:
and
. These bounds can be calculated
based on the minimum and maximum green times,
respectively.
The controller always works in the background
and the fixed signal timings are set for all signals.
Once the TTS is close to (i.e., 85% of) the set value
, the controller is activated and the signal
timings are calculated based on the controller
ordered flow
. When the TTS decreases, to less
than 85% of
, the controller is deactivated and
the signals display the fixed timings again.
3.2 Use of the Perimeter Control (PC)
for Clear Weather Conditions
Since INTEGRATION is a stochastic micro-
simulator, simulations were run for the PC case and
the NPC case using five different random seeds. The
parameters used in these simulations are as follows:
= 0.678, = 0.0973,
=6.96,
=3.31,
= 1826.66ℎ/ℎ, and
= 2000ℎ.ℎ/ℎ.
Table 1: Performance metrics of the PC for the FN using
five different seeds.
Average Max Min
NPC: Speed (km/h) 16.00 16.97 14.182
PC: Speed (km/h) 18.89 19.33 18.23
Difference (%) 18.75 35.34 7.75
NPC: Delay (s) 261.31 340.95 220.65
PC: Delay (s) 187.34 194.45 183.25
Difference (%) -26.25 -12.59 -46.12
Completed trips 9068 9079 9053
Table 1 shows that the PC improved the
performance of the full network FN. On average, it
increased the average speed by 18.75% and
decreased the total delay by 26.25% compared to the
NPC case.
For the performance inside the PN, Figure 5
clearly shows that the control algorithm decreased
the congestion. Note that the decreasing NFD area in
Figure 5(a) no longer exists in Figure 5 (b).
(a)
(b)
Figure 5: (a) NFD using 5 different seeds for NPC; (b)
NFD using 5 different seeds for the PC.
VEHITS 2018 - 4th International Conference on Vehicle Technology and Intelligent Transport Systems
86
4 PC AND WTPC FOR
INCLEMENT WEATHER
4.1 Weather Modelling in
INTEGRATION
Rakha et al. studied the impact of weather on free
flow speed, speed at capacity and capacity. They
developed weather adjustment factors (in Equation
(6)) to compute these three traffic stream parameters
based on precipitation intensity (cm/h) and
visibility level (km) for each of the rain and snow
cases (Rakha et al., 2008, Rakha et al., 2012).
=
+
+
+
+
+
(6)
In this work, the calibrated model parameters
through
are chosen to be the Twin Cities
parameters because it has the highest WAF (Table 1
in (Rakha et al., 2012)). These WAF are multiplied
by the clear conditions speeds and capacity.
The authors also modelled vehicle deceleration
and acceleration behaviour for inclement weather.
They provided rolling and friction coefficients for
different roadway surface conditions (including wet
and snowy surfaces).
In order to model different weather conditions in
INTEGRATION, the set of inputs containing the
free flow speed, speed at capacity, capacity, rolling
coefficient and coefficient of friction are calculated
and given to the software.
The PC uses for inclement weather the same set
of parameters used for clear weather conditions
which is the following: = 0.678, = 0.0973,
=6.96,
=3.31,
= 1826.66ℎ/ℎ, and
= 2000ℎ.ℎ/ℎ.
However, the WTPC uses a specific set of
parameters for each weather condition. For clear
weather, it uses the parameters defined above: =
0.678, = 0.0973,
=6.96,
=3.31,
=
1826.66ℎ/ℎ, and
= 2000ℎ.ℎ/ℎ. The
obtained re-tuned parameters are = 0.755, =
0.214,
=3.17,
=2,
= 1600ℎ/ℎ,
= 2000ℎ.ℎ/ℎ for the rain conditions and
= 0.0864, = 0.758,
= 0.114,
=1.2,
= 1613ℎ/ℎ,
= 2000ℎ.ℎ/ℎ for the
snow conditions.
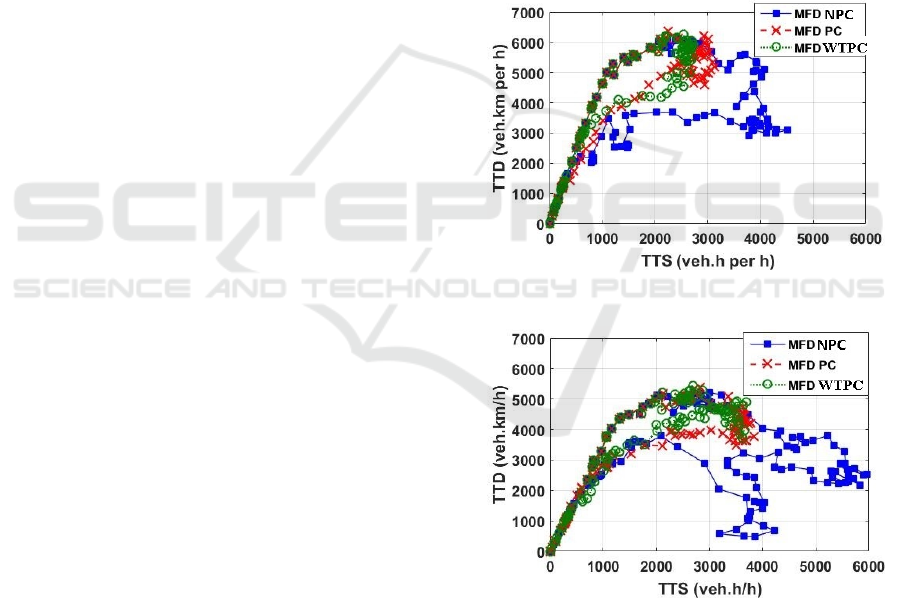
The NFD plots of the PN for both rain and snow
conditions are presented in Figure 6(a) and (b). The
blue curves correspond to the NFDs for the NPC, the
red to the NFDs for the PC, and the green curves to
the NFDs for the WTPC. As the curves show, the
values of TTS for the WTPC case were lower than
those for the PC and NPC cases, indicating that the
WTPC performed better than the PC in decreasing
congestion inside the PN.
The results of Table 2 show that the WTPC
algorithm outperformed the PC algorithm for both
the rain and snow cases in terms of increasing the
average speed and decreasing the total delay of the
FN (not only PN). Compared to the NPC case, the
WTPC increased the speed by 28.61% and the total
delay by 33.26% for the rain conditions. For the
snow conditions, an improvement in the range of
42% is shown for both the average speed and total
delay.
(a)
(b)
Figure 6: (a) NFD for rain; (b) NFD for snow.
In order to further test the efficiency of the
WTPC, simulations for different rain and snow
intensities were performed for the NPC, PC, and
WTPC cases.
Weather-Tuned Network Perimeter Control
87
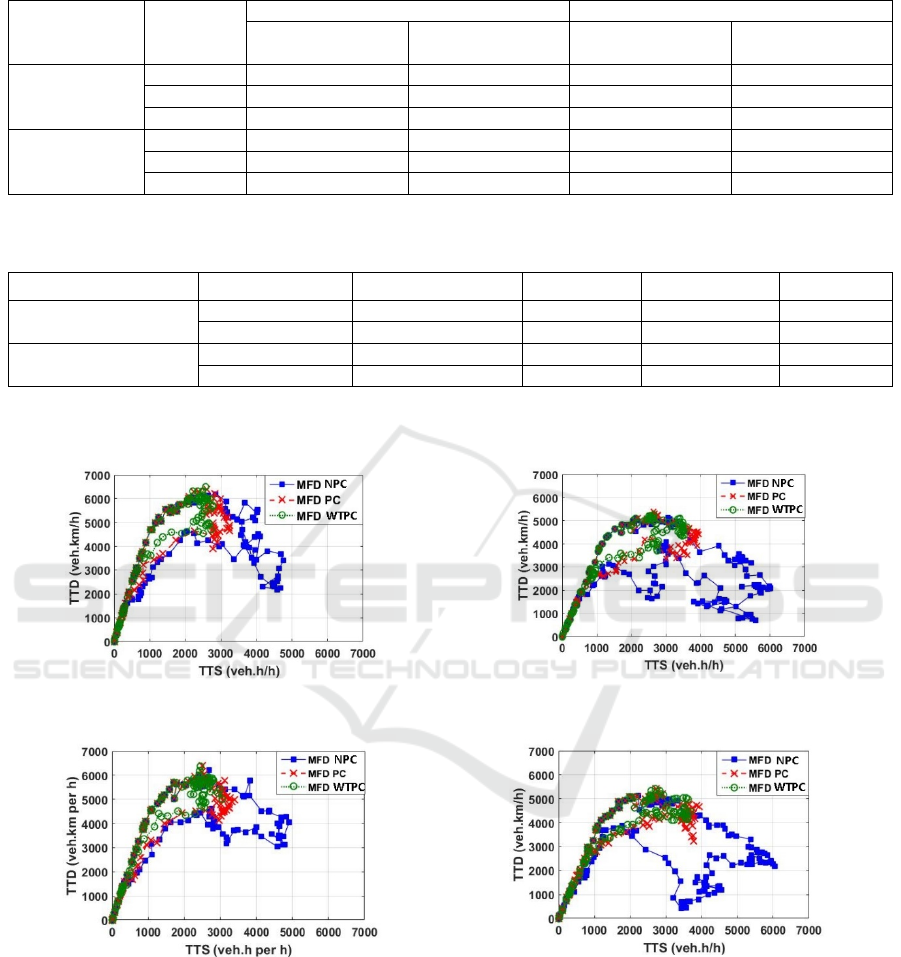
Table 2: Performance Metrics on the FN for the NPC, PC and WTPC Cases.
Performance
metrics
Strategy
Rain Snow
Value
% Difference w.r.t
NPC
Value
% Difference w.r.t
NPC
Avg. Speed
NPC 11.23 - 6.52 -
PC 13.75 22.43 8.85 35.73
WTPC 14.44 28.61 9.30 42.64
Avg. Total
Delay
NPC 402.52 - 803.42 -
PC 283.73 -29.51 478.27 - 40.47
WTPC 268.65 -33.26 465.77 - 42.02
Table 3: Performance metrics of the FN with respect to (w.r.t) NPC for the PC and WTPC cases for different rain and snow
intensities.
Performance Metrics Strategy Moderate Rain High Rain Moderate Snow High Snow
% Difference in Avg.
Speed
PC 21.14 17.95 49.82 48.25
WTPC 30.50 24.68 59.62 53.24
% Difference in Avg.
Delay
PC -33.97 -23.62 -50.3 -46.74
WTPC -39.97 -31.57 -54.87 -49.06
(a) (c)
(b) (d)
Figure 7: (a) moderate rain, (b) high rain, (c) moderate snow, (d) high snow.
5 VALIDATION FOR
DIFFERENT RAIN AND SNOW
INTENSITIES
Two different precipitation intensities were chosen
for each weather conditions. Each weather condition
was run with its corresponding set of parameters as
described above. No further parameter tuning is
done. Depending of the weather (clear, rain or
snow), the corresponding set of control parameters is
loaded to INTEGRATION for the WTPC. For the
PC, the same set of parameters tuned originally for
clear weather conditions is loaded to
INTEGRATION whatever the weather is.
VEHITS 2018 - 4th International Conference on Vehicle Technology and Intelligent Transport Systems
88

Table 3 shows the relative difference of each
performance metric for the PC and WTPC with
respect to NPC for different rain and snow
intensities. All the results show that the WTPC
outperformed the PC in improving the mobility of
the entire transportation system.
The PN NFD plots of each scenario are presented
in Figure 7. In all the plots, the green curves
corresponding to the WTPC have the lowest TTS
values, which means that they were the most
effective in reducing the congestion inside the PN.
6 CONCLUSIONS
A Perimeter Control (PC) strategy based on the NFD
was implemented in the INTEGRATION micro-
simulator. It was tested for different weather
conditions and was proven to be efficient. Because
the method was proven to be efficient, and due to the
need for a macroscopic weather responsive traffic
management strategy, a weather-tuned perimeter
control (WTPC) model was developed and tested for
different precipitation types (rain and snow) and
intensities. The WTPC was shown to outperform
the regular PC in decreasing congestion inside the
protected network (PN), in increasing the average
speed and in decreasing the total delay of the full
network (FN).
An application of this work in a real network will
be a future objective. Another future objective will
be combining this control strategy with a routing
strategy to manage the queues on the gated links. A
generalization of this work will be done so that it
could be applied to any network.
REFERENCES
Aboudolas, K. & Geroliminis, N. 2013. Perimeter and
boundary flow control in multi-reservoir
heterogeneous networks. Transportation Research
Part B: Methodological, 55, 265-281.
Agarwal, M., Maze, T. H. & Souleyrette, R. Impacts of
weather on urban freeway traffic flow characteristics
and facility capacity. Proceedings of the 2005 mid-
continent transportation research symposium, 2005.
18-19.
Buisson, C. & Ladier, C. 2009. Exploring the impact of
homogeneity of traffic measurements on the existence
of macroscopic fundamental diagrams. Transportation
Research Record: Journal of the Transportation
Research Board, 127-136.
Daganzo, C. F. 2007. Urban gridlock: Macroscopic
modeling and mitigation approaches. Transportation
Research Part B: Methodological, 41, 49-62.
FHWA. 2017How Do Weather Events Impact Roads?
[Online].
Geroliminis, N. & Daganzo, C. F. 2008. Existence of
urban-scale macroscopic fundamental diagrams: Some
experimental findings. Transportation Research Part
B: Methodological, 42, 759-770.
Geroliminis, N. & Sun, J. 2011. Properties of a well-
defined macroscopic fundamental diagram for urban
traffic. Transportation Research Part B:
Methodological, 45, 605-617.
Godfrey, J. 1900. The mechanism of a road network.
Traffic Engineering & Control, 8.
Goodwin, L. C. & Pisano, P. A. 2004. Weather-responsive
traffic signal control. Institute of Transportation
Engineers. ITE Journal, 74, 28.
Haddad, J. & Geroliminis, N. 2012. On the stability of
traffic perimeter control in two-region urban cities.
Transportation Research Part B: Methodological, 46,
1159-1176.
Haddad, J. & Shraiber, A. 2014. Robust perimeter control
design for an urban region. Transportation Research
Part B: Methodological, 68, 315-332.
Ji, Y., Daamen, W., Hoogendoorn, S., Hoogendoorn-
Lanser, S. & Qian, X. 2010. Investigating the shape of
the macroscopic fundamental diagram using
simulation data. Transportation Research Record:
Journal of the Transportation Research Board, 40-48.
Ji, Y. & Geroliminis, N. 2012. On the spatial partitioning
of urban transportation networks. Transportation
Research Part B: Methodological, 46, 1639-1656.
Keyvan-Ekbatani, M., Carlson, R. C., Knoop, V. L. &
Papageorgiou, M. 2017. Balancing Delays and
Relative Queues at the Urban Network Periphery
under Perimeter Control.
Keyvan-Ekbatani, M., Kouvelas, A., Papamichail, I. &
Papageorgiou, M. 2012. Exploiting the fundamental
diagram of urban networks for feedback-based gating.
Transportation Research Part B: Methodological, 46,
1393-1403.
Keyvan-Ekbatani, M., Papageorgiou, M. & Knoop, V. L.
2015. Controller design for gating traffic control in
presence of time-delay in urban road networks.
Transportation Research Procedia, 7, 651-668.
Keyvan-Ekbatani, M., Papageorgiou, M. & Papamichail, I.
Feedback Gating Based on Sparse-Measurement
Urban Network Fundamental Diagrams.
Transportation Research Board 92nd Annual Meeting,
2013.
Keyvan Ekbatani, M., Gao, X., Gayah, V. & Knoop, V. L.
Combination of traffic-responsive and gating control
in urban networks: Effective interactions. Proceedings
of the 95th annual meeting of the Transportation
Research Board, Washington (USA), 10-14 Jan. 2016;
Authors version, 2016. TRB.
Li, Y., Xu, J. & Shen, L. 2012. A perimeter control
strategy for oversaturated network preventing queue
spillback. Procedia-Social and Behavioral Sciences,
43, 418-427.
Maze, T., Agarwai, M. & Burchett, G. 2006. Whether
weather matters to traffic demand, traffic safety, and
Weather-Tuned Network Perimeter Control
89

traffic operations and flow. Transportation research
record: Journal of the transportation research board,
170-176.
Mazloumian, A., Geroliminis, N. & Helbing, D. 2010. The
spatial variability of vehicle densities as determinant
of urban network capacity. Philosophical Transactions
of the Royal Society of London A: Mathematical,
Physical and Engineering Sciences, 368, 4627-4647.
Papageorgiou, M., Kosmatopoulos, E. & Papamichail, I.
2008. Effects of variable speed limits on motorway
traffic flow. Transportation Research Record: Journal
of the Transportation Research Board, 37-48.
Pisano, P. & Goodwin, L. 2004. Research needs for
weather-responsive traffic management.
Transportation Research Record: Journal of the
Transportation Research Board, 127-131.
Rakha, H., Arafeh, M. & Park, S. 2012. Modeling
inclement weather impacts on traffic stream behavior.
International Journal of Transportation Science and
Technology, 1, 25-47.
Rakha, H., Farzaneh, M., Arafeh, M. & Sterzin, E. 2008.
Inclement weather impacts on freeway traffic stream
behavior. Transportation Research Record: Journal of
the Transportation Research Board, 8-18.
Romain, B., Nour-Eddin, E. F., Jacques, S. & Florian, D.
V. How does rain affect highway traffic performance
indicators?
Sirmatel, I. I. & Geroliminis, N. Model predictive control
of large-scale urban networks via perimeter control
and route guidance actuation. Decision and Control
(CDC), 2016 IEEE 55th Conference on, 2016. IEEE,
6765-6770.
Systematics, C. 2003. Weather-Responsive Traffic
Management: Concept of Operations (draft). Prepared
for FHWA, US Department of Transportation.
Tsapakis, I., Cheng, T. & Bolbol, A. 2013. Impact of
weather conditions on macroscopic urban travel times.
Journal of Transport Geography, 28, 204-211.
Xu, F., He, Z., Sha, Z., Zhuang, L. & Sun, W. 2013.
Assessing the impact of rainfall on traffic operation of
urban road network. Procedia-Social and Behavioral
Sciences, 96, 82-89.
VEHITS 2018 - 4th International Conference on Vehicle Technology and Intelligent Transport Systems
90
