
Data Analytics for Low Voltage Electrical Grids
Maria Stefan
1
, Jose G. Lopez
1
, Morten H. Andreasen
1
, Ruben Sanchez
2
and Rasmus L. Olsen
1
1
Electronic Systems, Aalborg University, Denmark
2
Energy Technology, Aalborg University, Denmark
Keywords:
Smart Grid, State Estimation, Historical, Near-real-time Analytics, Streaming Data.
Abstract:
At the consumer level in the electrical grid, the increase in distributed power generation from renewable energy
resources creates operational challenges for the DSOs. Nowadays, grid data is only used for billing purposes.
Intelligent management tools can facilitate enhanced control of the power system, where the first step is the
ability to monitor the grid state in near-real-time. Therefore, the concepts of smart grids and Internet of Things
can enable future enhancements via the application of smart analytics. This paper introduces a use case for low
voltage grid observability. The proposal involves a state estimation algorithm (DSSE) that aims to eliminate
errors in the received meter data and provide an estimate of the actual grid state by replacing missing or
insufficient data for the DSSE by pseudo-measurements acquired from historical data. A state of the art of
historical and near-real-time analytics techniques is further presented. Based on the proposed study model
and the survey, the team near-real-time is defined. The proposal concludes with an evaluation of the different
analytical methods and a subsequent set of recommendations best suited for low voltage grid observability.
1 INTRODUCTION
At the beginning of the 21st century, a massive
improvement of Information and Communications
Technology (ICT) gave an opportunity for solving
some existing limitations of the electrical grid, while
also reducing the operational costs (Miceli et al.,
2013). This sparked people involved in the devel-
opment of the future energy market to think of new
concepts. Of these ideas, smart meters and smart grid
were the most popular, by adding ICT intelligence to
the system, wherever useful.
These ideas led many countries to support var-
ious research programs in the smart grid domain.
Denmark, already having a long tradition in the
green electricity market, published a set of recom-
mendations for implementing these concepts in the
report called Smart Grid in Denmark. One Dan-
ish financed research program is ForskEL (Energinet,
2015), meant to support the development and inte-
gration of environmentally friendly power generation
technologies and grid connection.
One goal of ForskEL is to help the Distributed
System Operators (DSOs) in making sensible deci-
sions regarding future power grid planning and fault
diagnosis in near-real-time. This calls for the utiliza-
tion of intelligent methods for grid data visualization,
as presented in (Stefan et al., 2017).
The new challenge for the Danish DSOs arises
as more distributed power generation is introduced
at the low voltage grid level. This affects their abil-
ity to monitor the state of the power grid without en-
countering operational constraints. One of the DSOs’
primary tools are to obtain full observability of the
low voltage grid, by making use of scalable data an-
alytics, as intended with the Danish RemoteGRID
project (Martin-Loeches et al., 2017). Hence, high-
performance data processing and analytical methods
are fundamental for efficiently managing distribution
grid data.
Two relevant data types are considered in relation
to the power grid:
• Geographic data: electrical network structure (ca-
bles, transformers, substations, meters) and their
geographical coordinates;
• Measurement data: three-phased generic grid
measurements from each load or connection point
containing multiple loads (voltage, current, con-
sumption).
This paper introduces a study of analytical meth-
ods suitable for obtaining low voltage grid observ-
ability. The paper is organized as follows: Section
2 presents the flow of data in a smart grid applica-
tion. The proposed study is presented in Section 3 and
Stefan, M., G. Lopez, J., H. Andreasen, M., Sanchez, R. and L. Olsen, R.
Data Analytics for Low Voltage Electrical Grids.
DOI: 10.5220/0006694802210228
In Proceedings of the 3rd International Conference on Internet of Things, Big Data and Security (IoTBDS 2018), pages 221-228
ISBN: 978-989-758-296-7
Copyright
c
2019 by SCITEPRESS – Science and Technology Publications, Lda. All rights reserved
221
it underlines the advantages of pseudo-measurements
and state estimator for the smart grid scenario. In Sec-
tion 4, both generic and state of the art analytic meth-
ods will be presented. Given the chosen case study
and background, the most suitable analytics will be
emphasized in Section 5, along with the definitions
of bulk and stream data types. Section 6 will sum-
marize the aforementioned study requirements with
future action plans for testing the above concepts.
2 STUDY BACKGROUND
The underlying application structure is defined based
on the requirements imposed by the analytical meth-
ods suitable for the state estimation algorithm intro-
duced in Section 3. In this study, the application struc-
ture is proposed as a client-server application, based
on the IEC 61868-100 standard (Commission, 2013).
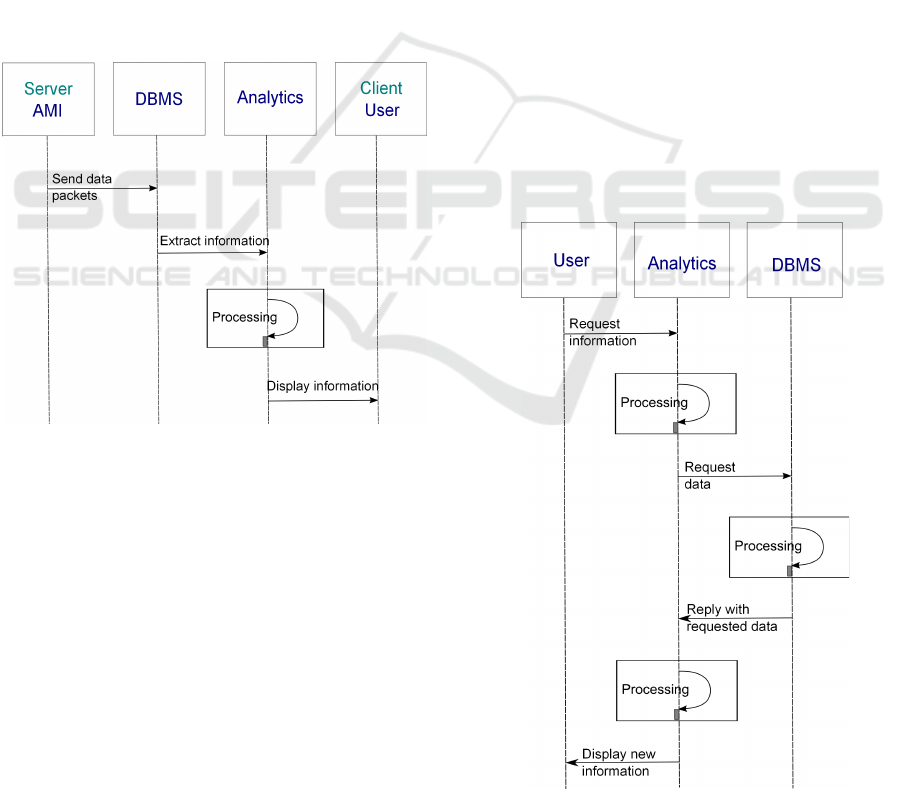
The data flow is depicted in Figure 1.
Client
User
Analytics
DBMS
Server
AMI
Figure 1: Data flow and exchange of automatic events ac-
cording to IEC 61968-100.
The IEC standard is meant to provide guidelines
regarding message exchange and interface specifica-
tions for utility enterprise distribution systems. Con-
sequently, the key terms are clarified as follows:
• Advanced Metering Infrastructure (AMI) (Uribe-
P
´
erez et al., 2016): main data source in a smart
grid, characterized by a large number of nodes
(meters) located at customer premises;
• Meter Data Management (MDM) (IEC/TC,
2013): software entity that involves the storage
and management of the AMI data. This includes
the Database Management System (DBMS);
• Enterprise Service Bus (ESB) (Neumann and
Nielsen, 2010): software-based integration layer
specifying a standardized communication inter-
face facilitating services (routing, mediation,
recording of data etc.) via standard event-driven
messaging. The ESB middelware works as an
adapter between different data formats and pro-
tocols in a Service Oriented Architecture (SOA).
Data is generated at the AMI (server entity) as
an encoded packet, which is then decoded at the
MDM level and sent to a database management sys-
tem (DBMS) for storage via XML messaging (Mc-
Morran, 2007). In this back-end architecture (Up-
work, 2017), the DBMS is defined as an integration
feature, which provides the ESB middleware with raw
data to be sent to the analytics module for processing.
A processing unit in the analytics module extracts the
desired information to be displayed for the user (client
entity). In the smart grid context, the user is usually
located in the DSO control center. The event progres-
sion of data is storing - information extraction - infor-
mation display. These events take place in a cyclic
manner and thus, they are referred to as automatic
events.
The data exchange sequences are not solely one-
way. In case the client (user) detects unusual patterns
or missing information in a certain geographical area,
additional data from that specific area (or specific me-
ters) can be requested for enhanced monitoring pur-
User
Analytics
DBMS
Figure 2: Data exchange of interactive events based on
client request.
IoTBDS 2018 - 3rd International Conference on Internet of Things, Big Data and Security
222
poses. If so, the data flow is based on so-called inter-
active events, as shown in Figure 2. The client’s re-
quest for more detailed information is transmitted to
the DBMS via the ESB, to search if there is a match
for the requested data in the database. If a match is
found, a reply is sent to the client for display and vi-
sualization. If not, the data request may be forwarded
to the AMI, which will configure the meters to send
the required data. Timing is crucial in the DSOs deci-
sion making process and is notably affected by delays
in the transmissions from data collection to data dis-
play. Requesting certain information all the way from
the AMI will result in additional delays due to the in-
creased number of messaging sequences between en-
tities.
As a part of the analytics module, the next section
will introduce the Distributed System State Estimator
(DSSE).
3 STUDY OUTLINE: LOW
VOLTAGE GRID
OBSERVABILITY
Low voltage grids are undergoing a transformation
from a passive to a more active role in the electrical
network. Traditionally, conventional large gas or coal
power plants, among others, are the source of elec-
trical power generation (Trebolle et al., 2013). Af-
ter being transmitted at a high voltage level, the en-
ergy is distributed to supply the loads in the system.
Lately, the penetration of distributed generation, es-
pecially from Renewable Energy Resources (RES), at
the low voltage level has increased. It creates opera-
tional challenges for the DSOs since the low voltage
grid was not designed to operate under such condi-
tions. For example, generation peaks from RES do
not necessarily match peaks of consumption, intro-
ducing power flows from the low to the high voltage
level.
In order to address operational concerns, the
DSOs require advanced management tools. Grid
monitoring is the first step towards a more reliable
operational approach (Abur and Exposito, 2004). In
fact, nowadays, the low voltage grid electrical pa-
rameters are not monitored in the DSOs control cen-
ters. Monitoring the system allows DSOs to deter-
mine whether or not the system is operating under
normal conditions. A system is considered to oper-
ate under normal conditions if all the loads can be
supplied without violating any operational constrains
(Abur and Exposito, 2004).
3.1 Low Voltage Grid State Estimation -
LV DSSE
Grid observability depends on where the measure-
ment points are placed along the electrical grid. In
the case of low voltage grids, these measurements are
provided by the smart meters. However, the informa-
tion extracted from the meter’s data contains errors
due to various factors, such as communication issues
or measurement deviations in the devices. Thus, as a
first step in control centers, efficient data analytics are
required to properly determine the state of the electri-
cal grid. The state is defined as ”known” if the volt-
ages and phase angles with respect to a certain voltage
and angle reference are known at every node (point
where two or more circuit elements meet) (Abur and
Exposito, 2004).The process in charge of eliminat-
ing errors and providing the best estimate of the sys-
tem state in distribution systems is the so-called dis-
tribution system state estimation (DSSE) (Alimardani
et al., 2015).
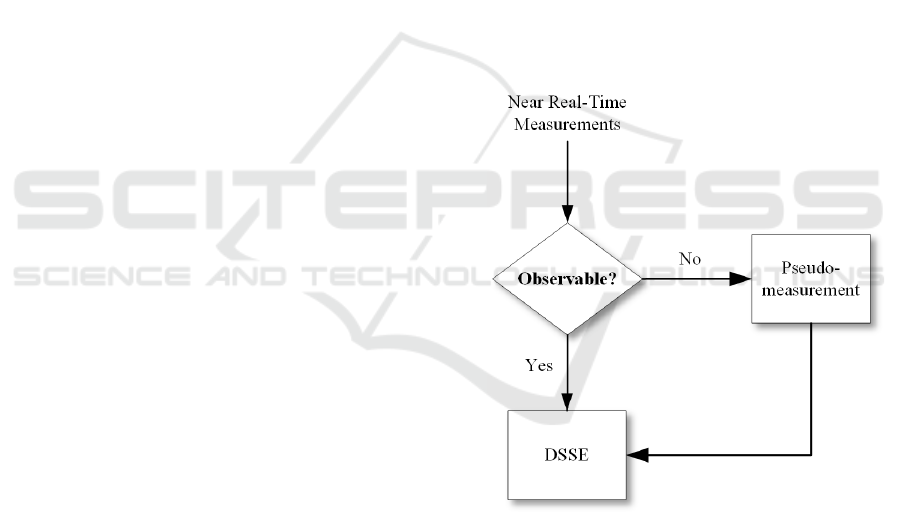
Figure 3: Evaluating observability based on the field near-
real-time measurements.
Figure 3 shows the block diagram of the observ-
ability analysis performed based on the raw measured
data. This analysis determines if the system state can
be estimated based on the set of acquired near-real-
time readings. For example, few or non-existing mea-
surements are sometimes provided from a specific ge-
ographical area of the system. This implies that the
available data is insufficient to successfully estimate
the state of the system. In that case, other data an-
alytics methods are needed, where the unavailable
near-real-time measurements are substituted by the
Data Analytics for Low Voltage Electrical Grids
223

so-called pseudo-measurements obtained from histor-
ical data (Khodabakhshian et al., 2017).
3.2 Pseudo-measurements
Traditionally, pseudo-measurements have been ob-
tained from standardized daily load and generation
profiles (DLP-DGP). Those are created for different
customer classes based on socio-demographic factors
(Krsman et al., 2016). However, other approaches
seeking more precise accuracy have been developed
in the literature. Artificial Neuronal Networks (ANN)
are used in (Do Coutto Filho et al., 1999). Besides,
different clustering techniques were utilized as it is
the case of k-means (Ben
´
ıtez et al., 2014), princi-
ple component analysis (Abreu et al., 2012), spectral
clustering method (Albert and Rajagopal, 2013) or fi-
nite mixture model (Stephen et al., 2014), among oth-
ers.
New solutions are to be studied in order to provide
robust pseudo-measurements for low voltage grid ap-
plications based on the utilization of AMI data. Un-
predictable behavior from RES is a challenge where
efficiency in terms of the amount of stored data needs
to be considered given the large number of nodes at
the low voltage level.
4 ANALYTIC METHODS
AMI data is by definition part of the Internet of
Things (IoT) umbrella, in the sense that smart me-
ters act as sensors in the electrical grid infrastructure.
IoT data analytics is characterized by autonomous
or semi-autonomous examination of data, employing
sophisticated techniques and tools, typically beyond
those of traditional Business Intelligence (BI). These
techniques help to reduce complex data sets into ac-
tionable insights, enhance and empower BI decision
support systems. By this token, some traditional an-
alytics and algorithms include data mining, machine
learning, pattern matching, forecasting, visualization,
semantic analysis, sentiment analysis (Gartner Sum-
mits, 2017).
Analytics are classified by two main categories:
historical and near-real-time analytics.
• Historical analytics: based on the past data values.
Data-at-rest corresponds to batch data processing;
• Near-real-time analytics: based on the present.
Data-in-motion equals stream data processing.
4.1 Historical Analytics
Four traditional types of historical analysis are pre-
sented in the following subsections. They are a trade-
off between the provided information value and the
implementation difficulty. This is illustrated in (CI
and T, 2014).
4.1.1 Descriptive
This type of data analysis is used to provide insight
into past events, by identifying overall themes and
patterns. Descriptive analytics is commonly classified
as BI and is the de facto standard analytics methodol-
ogy. Typical outputs include dashboards, reports and
status emails stating historical observations by sum-
marizing raw data for human interpretation. These are
mainly obtained through methods such as data mining
and data aggregation.
An example of descriptive analytics can be found
in (Liu et al., 2016), where daily profile of consump-
tion trends are obtained by means of data aggrega-
tion. This helps to understand daily habits of con-
sumers and, at the same time, to insure the privacy
of end users through data anonymization (Diaman-
toulakis et al., 2015).
4.1.2 Diagnostic
Diagnostic analysis helps answering questions like
”Why was a certain event triggered”, by providing a
deep understanding of a limited problem space via in-
depth data analysis, discovering the root causes and
characteristics of an event. Advancing from aggre-
gate and summary information to detailed data, based
on specific focus attribute(s), is done via selection and
querying of data sets. Data granularity defines the
limit for the analytic level of detail. The resulting out-
put is typically an analytic dashboard.
Correlation methods are part of obtaining a diag-
nosis analysis. The review in (Raza and Khosravi,
2015) proposes a method for characterizing power
system loads by the correlation between load demand
and weather variables.
4.1.3 Predictive
Predictive analytics is about foreseeing the future
based on historical data patterns. Future predictions
and scenarios come from data mining, machine learn-
ing and statistical modeling of raw data. Thus, action-
able insights are obtained via plausible estimates of
future outcomes. Typical deliverables are in the form
of predictive forecasts based on probabilistic and cor-
relation analysis.
Load forecasting is a common use case of pre-
dictive analysis in smart grids (Diamantoulakis et al.,
2015). The study made in (Abu-El-Magd and Findlay,
IoTBDS 2018 - 3rd International Conference on Internet of Things, Big Data and Security
224
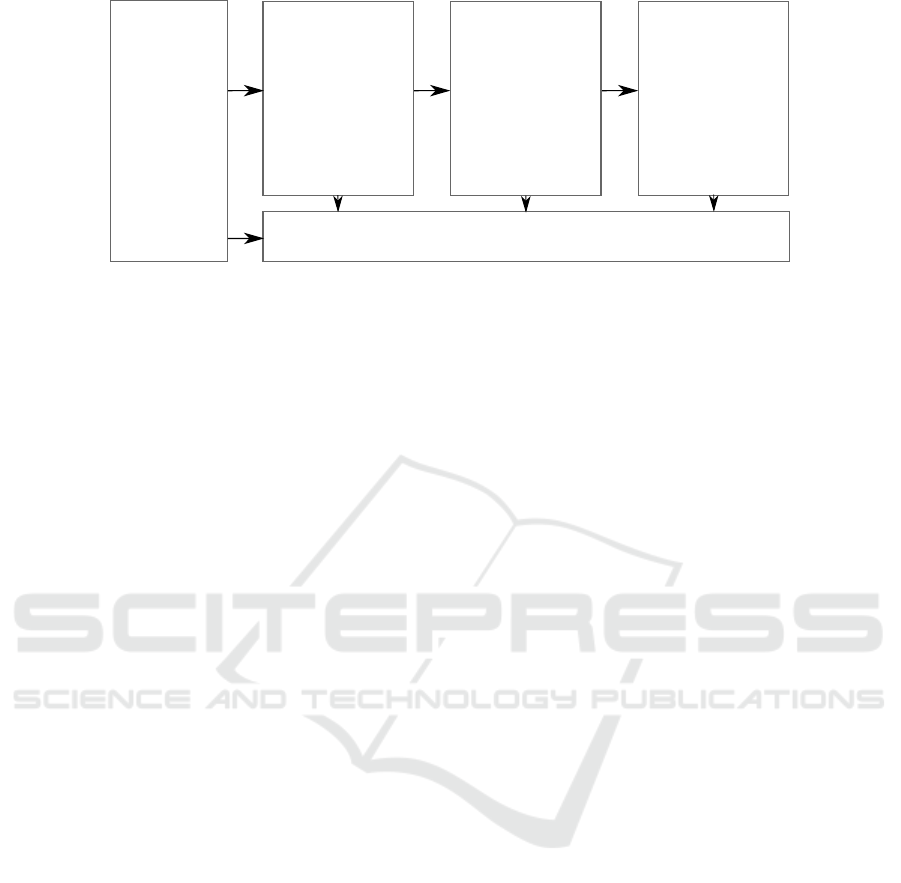
Collect
Advanced
Metering
Infrastructure
Diagnose &
Predict
Querying
Correlating
Statistical modelling
Forecasting
Drill-down/through
Prescribe
Business rules
Optimization
Visualization
Big Data
Describe &
Pre-process
Filtering
Aggregation
Mining
Storage - Database Management System
Figure 4: Proposal of streaming analytics architecture for low-voltage electrical grids (Vitria, 2015).
2003) approaches a forecast method which is based
on a combination of ANNs and time series data mod-
els. Load forecasting can be achieved using not only
correlations, but also through machine learning solu-
tions, such as the MapReduce processing model (Riz-
vandi et al., 2011) (GJSissons, 2014). MapReduce
allows for massive scalability across a cluster of com-
puters, for large data sets (in the range of Terabytes),
which is a suitable solution in case of AMI infrastruc-
tures.
4.1.4 Prescriptive
The primary focus of prescriptive analytics is to pro-
vide real-world recommendations. Datasets are eval-
uated via analytical models and the preferred cause of
action for each specific event is selected. Then the re-
sult, in the form of explicit actionable information, is
presented for human interaction, typically making the
final decision on acceptance or rejection. Hence, pre-
scriptive analytics takes a step further than predictive
analytics by reducing complex data and algorithms to
non-technical descriptors for immediately recogniz-
able advice on predicted future outcomes. The anal-
ysis aids the decision-making process, having the po-
tential to both maximize positive outcomes as well
as prevent undesirable events (Halo Business Intelli-
gence, 2017).
Simultaneous utilization of multi-source datasets
includes historical and real-time data, transactional
and big data analytics, that affect marketing strategies
(Daki et al., 2017). For example, one significant tool
to help utility companies navigate towards a smart
grid platform is the Vitria IoT Analytics Platform, re-
ported in (Vitria, 2015). This white paper states that a
combination of prescriptive analytics and smart deci-
sions provide the highest throughput in the analytics
value chain.
4.2 Near-real-time Analytics
The resilience of the power grid is part of the future
requirements for evolving towards intelligent grids.
The main motivation for near-real-time analytics lies
in the lack of limited grid functionality to timely de-
tect and prevent failures. This extends to the discov-
ery of natural disasters or criminal actions that might
have caused the failures. Therefore, these can be pre-
vented by making use of real-time intelligence (Vitria,
2015).
4.2.1 Streaming Analytics
Near-real-time decision support can be provided via
data-in-motion pre-database processing, inspection,
correlation and analysis. It enables instantaneous
management, monitoring, and continuous statistical
analysis of data. Introducing real-time KPI overview,
immediate access to metrics, and reporting, improves
reaction time and accelerates decision-making.
Streaming analytics provide value from the data
in a similar manner as traditional historical analytics.
The value of streaming data decreases non-linearly
over time, meaning that events should be reacted upon
quickly, in near-real-time. The progression from his-
torical methods comes as analytics are no longer per-
formed ”at-rest”. Instead, data is processed before it
is stored and therefore the decision-making process
becomes timely and more efficient (Gutierrez, 2016)
(Techopedia, 2017). A summary of the modules in-
volved in the data streaming based on the surveyed
analytics types is shown in Figure 4. This figure
shows that the same principles as in historical ana-
lytics can be applied to streaming data.
Data Analytics for Low Voltage Electrical Grids
225

Table 1: Advantages and disadvantages of using historical and near-real-time analytics for providing data to the DSSE.
Analytics Pros Cons
Historical
(context
awareness)
• provide insight by uncovering data
patterns and trends
• accuracy and realiability dependent on
time
• quickly accessible and detailed (available
and verified data)
• most machine learning algorithms do
not deal with temporal effects
• clarity by presentation of reduced
complex data sets - thorough presentation of
large data sets
• reliance on batch processing and
consequently limited by the resulting
update intervals
Near-real-time
(situation
awareness)
• detects gross errors - accuracy • highly dependent on the delays in the
communication network
• avoid latency from filtering disk data • difficult to adapt to platform and
hardware requirements
• detect emerging correlations between
multiple data sets
• risk of incorrect analysis via
implementation dependency
• immediate pre-database data availability
5 MAIN FINDINGS AND
DISCUSSION
The study presented above emphasized the impor-
tance of introducing analytical methods to monitor the
status of low voltage electrical grids and to plan future
grid reinforcements. Historical data is used to cre-
ate pseudo-measurements, aiming to fill in missing or
erroneous data received from a smart grid infrastruc-
ture.
Given the back-end client-server architecture pre-
sented in Section 2, the automatic ingestion of data
can be defined as a ”stream of data”:
Near-real-time measurements are characterized as a
continuous, fast changing and voluminous data flow,
commonly known as stream.
To support the above-mentioned definition, the
notion of near-real-time data can be given in the con-
text of the data flow architecture in Section 2 and the
use case presented in Section 3:
Assuming that the data packets sent from the low volt-
age grid arrive consecutively with a fixed period of
time, then a near-real-time data stream can be defined
as: a data packet characterized by the arrival granu-
larity and received in a timely manner at the user side.
Timing is then relative to the types of events involved
in the data flow: automatic or interactive.
The analytical methods involved in the DSSE al-
gorithm are based on both historical and near-real-
time data. Due to their timely nature, the near-real-
time measurements are more reliable and accurate
than the historical ones. Therefore, the DSSE needs
near-real-time data, that should be pre-processed in
order for the estimator to ”understand” it, equivalently
to the streaming analytics procedures shown in Fig-
ure 4. There are typically not enough near-real-time
measurements available to successfully perform the
DSSE. Therefore, there is not enough data to pro-
vide full grid observability. In order to fill in the gaps
of missing information, pseudo-measurements can be
created by requesting raw data that has been previ-
ously stored in a database. The requested informa-
tion can therefore be extracted by means of filtering,
mining or querying, making it comprehensible for the
DSSE. In this case, the most suitable analytics are de-
scriptive.
A summary of pros and cons of the aforemen-
tioned analytics for the DSSE is presented in Table 1.
The novelty of this study is based on the integration
of traditional analytics into the energy-related field,
which consists of the DSSE algorithm. As historical
based analytics are useful to build periodic reports for
strategic and long-term decisions, they are also lim-
ited by the temporal effects. Historical data may not
give a true pattern of a data trend, if this has changed
with time. While near-real-time analytical tools can
address the temporal dependency, they are also plat-
form sensitive.
IoTBDS 2018 - 3rd International Conference on Internet of Things, Big Data and Security
226

6 CONCLUSION
This study addresses the challenges for choosing suit-
able data analytics methods in the domain of low volt-
age smart grids. DSSE is an analytical method for
providing a reliable source of information related to
the state of the grid, by filtering the raw data and
detecting gross errors. Ideally, DSSE makes use of
near-real-time data to provide a successful estima-
tion. In many cases, this data is insufficient or non-
available, so pseudo-measurements generated from
historical data will fill in for the lack of information.
Traditional historic analytics can build predictive out-
puts useful for the DSSE, but there is a higher error
probability in the pseudo-measurements.
By this token, the data analytics module should
be built on a platform that can accommodate for both
historical and near-real-time analysis. The next step
in this research is to test the functionality of a DSSE
algorithm and analyze the capabilites of processing
large amounts of historical batch data. At the same
time, the test aims to characterize the performance
and bottlenecks of parallel processing of both stream
and batch data types, taking into account parame-
ters such as memory usage, processing time and in-
memory processing behavior.
ACKNOWLEDGEMENTS
This work is financially supported by the Danish
project RemoteGRID, which is a ForskEL program
under Energinet.dk with grant agreement no. 2016-1-
12399.
REFERENCES
Abreu, J. M., Pereira, F. C., and Ferr
˜
ao, P. (2012). Us-
ing pattern recognition to identify habitual behavior in
residential electricity consumption. Energy and build-
ings, 49:479–487.
Abu-El-Magd, M. A. and Findlay, R. D. (2003). A
new approach using artificial neural network and
time series models for short term load forecasting.
3:1723,1724,1725,1726.
Abur, A. and Exposito, A. G. (2004). Power system state
estimation: theory and implementation. CRC press.
Albert, A. and Rajagopal, R. (2013). Smart meter
driven segmentation: What your consumption says
about you. IEEE Transactions on Power Systems,
28(4):4019–4030.
Alimardani, A., Therrien, F., Atanackovic, D., Jatskevich,
J., and Vaahedi, E. (2015). Distribution system state
estimation based on nonsynchronized smart meters.
IEEE Transactions on Smart Grid, 6(6):2919–2928.
Ben
´
ıtez, I., Quijano, A., D
´
ıez, J.-L., and Delgado, I. (2014).
Dynamic clustering segmentation applied to load pro-
files of energy consumption from spanish customers.
International Journal of Electrical Power & Energy
Systems, 55:437–448.
CI and T (2014). The four types of analytics.
Commission, I. E. (2013). Application Integration at Elec-
tric Utilities - System Interfaces for Distribution Man-
agement - Part 100: Implementation Profiles. Techni-
cal Report 61968-100, International Electrotechnical
Commission.
Daki, H., El Hannani, A., Aqqal, A., Haidine, A., and
Dahbi, A. (2017). Big data management in smart grid:
concepts, requirements and implementation. Journal
of Big Data, 4(1):13.
Diamantoulakis, P. D., Kapinas, V. M., and Karagiannidis,
G. K. (2015). Big data analytics for dynamic energy
management in smart grids. 2:94–101.
Do Coutto Filho, M., Souza, J., Matos, R., and Schilling,
M. T. (1999). Preserving data redundancy in state es-
timation through a predictive database. In Electric
Power Engineering, 1999. PowerTech Budapest 99.
International Conference on, page 271. IEEE.
Energinet (2015). The Energinet.dk website.
Gartner Summits (2017). Gartner it glossary - advanced
analytics.
GJSissons (2014). Adaptive mapreduce: Part 1.
Gutierrez, D. D. (2016). InsideBIGDATA - Guide to
Streaming Analytics. Technical report, Impetus
Stream Analytix.
Halo Business Intelligence (2017). Descriptive, predictive,
and prescriptive analytics explained.
IEC/TC (2013). Application Integration at Electric Utili-
ties - System Interfaces for Distribution Management -
Part 9: Interfaces for meter reading and control. Tech-
nical Report 61968-9, International Electrotechnical
Commission.
Khodabakhshian, A., Hooshmand, R., and Raisee-
Gahrooyi, Y. (2017). A new pseudo load profile de-
termination approach in low voltage distribution net-
works. IEEE Transactions on Power Systems.
Krsman, V., Tesanovic, B., and Dojic, J. (2016). Pre-
processing of pseudo measurements based on ami data
for distribution system state estimation.
Liu, X., Golab, L., Golab, W., Ilyas, I. F., and Jin, S. (2016).
Smart meter data analytics. 42:1–39.
Martin-Loeches, R., Iov, F., Kemal, M., Stefan, M., and
Olsen, R. (2017). Observability of low voltage grids:
actual dsos challenges and research questions. In Pro-
ceedings of the 2017 52nd International Universities’
Power Engineering Conference (UPEC). IEEE Press.
McMorran, D. A. W. (2007). An introduction to iec 61970-
301 and 61968-11: The common information model.
Miceli, R., Favuzza, S., and Genduso, F. (2013). A perspec-
tive on the future of distribution: Smart grids, state of
the art, benefits and research plans. 5:36–42.
Neumann, S. A. and Nielsen, T. D. (2010). Cim interoper-
ability challenges. pages 1–5.
Data Analytics for Low Voltage Electrical Grids
227

Raza, M. Q. and Khosravi, A. (2015). A review on artifi-
cial intelligence based load demand forecasting tech-
niques for smart grid and buildings. 50:1352–1372.
Rizvandi, N. B., Taheri, J., and Zomaya, A. Y. (2011).
A study on using uncertain time series match-
ing algorithms in map-reduce applications. CoRR,
abs/1112.5505.
Stefan, M., Lopez, J. G., Andreasen, M. H., and Olsen,
R. L. (2017). Visualization techniques for electrical
grid smart metering data: A survey. In 2017 IEEE
Third International Conference on Big Data Comput-
ing Service and Applications (BigDataService), pages
165–171.
Stephen, B., Mutanen, A. J., Galloway, S., Burt, G., and
J
¨
arventausta, P. (2014). Enhanced load profiling for
residential network customers. IEEE Transactions on
Power Delivery, 29(1):88–96.
Techopedia (2017). Weighing the pros and cons of real-time
big data analytics.
Trebolle, D., Hallberg, P., Lorenz, G., Mandatova, P.,
and Guijarro, J. T. (2013). Active distribution sys-
tem management. In Electricity Distribution (CIRED
2013), 22nd International Conference and Exhibition
on, pages 1–4. IET.
Upwork (2017). A beginners guide to back-end develop-
ment.
Uribe-P
´
erez, N., Hern
´
andez, L., de la Vega, D., and Angulo,
I. (2016). State of the art and trends review of smart
metering in electricity grids. 6:68.
Vitria (2015). Advanced Analytics for Energy Utilities: The
Fast Path to a Smart Grid. Technical report, Vitria
Technology.
IoTBDS 2018 - 3rd International Conference on Internet of Things, Big Data and Security
228
