
How Can Visualization Affect Security?
Joana Muchagata and Ana Ferreira
CINTESIS - Centre for Health Technology and Services Research, Faculty of Medicine, University of Porto, Portugal
Keywords: Human Computer Interaction, Security of Mobile Visualization Design, User-adaptive Visualization,
Electronic Health Records.
Abstract: Technology like computers and especially mobile devices have changed the way people see and interact
with the world. Many of our everyday tasks are only completed using technology supported by different
platforms (desktop computers, laptops, tablets and smartphones) so the visualization of content is presented
differently depending on the used device and type of information requested. However, even with user-
adaptive systems, which can adjust interface content according to individual’s needs and context, data
privacy can be at risk, as these techniques do not aim to protect them or even identify the presence of
vulnerabilities. The main goal of this paper is to analyse what techniques are available to adapt visualization
to users’ needs and context of each interaction with different devices and analyse which can be applied to
improve security and privacy of visualized data. Two use-cases are presented to compare traditional access
and access using visualization techniques to improve security and mitigate privacy vulnerabilities of
healthcare data. More research is needed to define and validate security visualization techniques integrated
into human mobile interactions, to better provide for the security and privacy of sensitive data.
1 INTRODUCTION
Today we live in a technological society where our
everyday tasks are completed efficiently and
effectively using computers and communication
devices (Moon and Chang, 2014). Although
technologies like desktops are still very common,
mobile devices like smartphones or tablets are very
useful to support user needs on the move (Burigat,
Chittaro and Gabrielli, 2008). These devices are
changing many industries and have transformed the
way we live and perform everyday activities.
Due to advanced operating systems, computing
and memory capability, Internet access, GPS
systems and intuitive and tactile graphical user
interfaces, the latest generation of smartphones are
progressively viewed as handheld computers
(Boulos, Wheeler, Tavares and Jones, 2011). These
improvements have made possible to include
advanced visualization techniques in most
computing application areas, such as medicine,
engineering and science. Also, the adaptation of
these techniques to mobile devices increases the
power of visualization to anytime, anywhere
(Chittaro, 2006). Visualization can make a wide
range of mobile applications more intuitive and
productive by highlighting important aspects and
hiding irrelevant details (Lapin, 2014) but to find the
best solutions and techniques is a constant challenge
(Burigat, Chittaro and Gabrielli, 2008) (Chittaro,
2006). There are various limitations, the most
obvious one being the small screen size.
But visualization is not only a matter of
information type and content. The way people
interact with interfaces can affect information
security and privacy. How can a user be searching
for information in a mobile device, within a specific
place and context, while having the guarantee that
the way that information is displayed is the most
secure and private? One very common example is
when users access personal or sensitive data (e.g.,
home banking or personal medical records) on
public busy places such as trains, airports or coffee
shops. Anyone standing behind or beside that user
can easily eavesdrop some or all information.
Further, if all required and non-required data at a
specific moment is travelling via an unsecure wire,
those can be eavesdropped by attackers listening to
public non secure Wi-Fi hotspots.
The main goal of this paper is to review and
analyse the way information is visualized depending
on a user’s context and type of device and how this
can affect security. The authors could not find
similar research work within the literature.
Muchagata, J. and Ferreira, A.
How Can Visualization Affect Security?.
DOI: 10.5220/0006695505030510
In Proceedings of the 20th International Conference on Enterprise Information Systems (ICEIS 2018), pages 503-510
ISBN: 978-989-758-298-1
Copyright
c
2019 by SCITEPRESS – Science and Technology Publications, Lda. All rights reserved
503

The next section presents the state of the art
while section 3 describes the methods used to
analyse existing visual techniques and related
security. Section 4 presents the recommendation list
of visual techniques for improved security and
section 5 describes two use-cases to validate the
obtained list. Section 6 discusses the obtained results
while section 7 concludes the paper.
2 STATE OF THE ART
A Google study on devices (Google, 2016) revealed
how, when and where people use them throughout
the day. The study took place in U.S. with a sample
of users from 18 to 49 years old and reveals that in a
regular day more than 1/4 of all users only use a
smartphone, which is almost two times as many as
those who only use a computer, and over half of
users prefer to use more than one type of device. It is
estimated that users spend 3 hours per day on
smartphones, about 2 hours on a computer and a
little more than 1 hour on a tablet. Most people use
multiple types of devices on the same day, and even
when they are using the computer they are also using
another device. The study also shows that the
preferred places to use a smartphone are at home,
work, stores, restaurants and bars, and the most used
resource is the web and after that, apps.
2.1 Choosing a Device
Content is presented to users differently depending if
the visualization is made on a desktop computer or
on a handheld device. This situation raises some
questions related with user options and visualization
results. Does the user perform the same actions on
both desktop and mobile? What type of content do
they explore, download, buy and avoid on those
devices? Is one more trusted than the other?
The majority of tasks are supported by both
platforms (desktop and mobile) but the results are
visualized differently as they may have a different
presentation and layout. Usually, in a mobile
version, information is displayed in small pieces and
interactive elements are larger for touch interactions.
In the desktop version there is also the opportunity
to access additional information (Paterno, 2014).
The reasons to choose one device over another
are related with the context of use, user
characteristics (personal preferences, goals and tasks
and emotional state), technology (device features,
type of connection, screen resolution and type of
browser), environment (location, light, noise) and
social aspects (privacy or collaboration) (Paterno,
2014). When users are on the move or when they are
looking for specific information and need a quick
answer, they prefer to use a mobile device.
Meanwhile, time consuming activities and specific
types of software are reserved to a computer. And in
some cases, users choose multiple devices because
this makes it easier to accomplish a task (Chittaro,
2006) (Paterno, 2014).
2.2 Security and Visualization
Studies in the field of security visualization are
relatively new and need more awareness. Many
times people access public Wi-Fi hotspots, often
located in populated areas such as coffee shops,
restaurants, hotels and airports, that offer little or no
security (Simmons, 2014) (Joshi, Aref, Ghafoor and
Spafford, 2001).
Several approaches have been made to help users
make the best decision possible about their security
choices. And although users can be presented with
information about the risk associated to a specific
wireless network, many times users still do not take
secure behaviours into account (Jeske, Coventry and
Briggs, 2014). One of the most common methods to
alert users about a possible event that can
compromise their protection are the security
warnings, and users may deal with them in different
situations (Bravo-Lillo, Cranor, Downs, Komanduri
and Sleeper, 2011) (Zaaba, Furnell and Dowland,
2014). However, in many times, users have
difficulties understanding the warnings as these can
have different representations depending on the
contexts and the level of severity (e.g. dialogue box,
balloons, banners and notifications). Several studies
(Bravo-Lillo, Cranor, Downs, Komanduri and
Sleeper, 2011) have concluded that many users
ignore the warnings such as when the content looks
legitimate, when they do not read or understand the
warning content/meaning (because of the technical
terminology used) or the displayed warning does not
provide enough or accurate information.
Beyond warning messages and taking the new
paradigm of accessing and sharing data
anytime/everywhere, security visualization must
adapt to all the human, technical and
physical/contextual characteristics relating to a
user’s specific request. Visualization must be
securely adapted to different scenarios such as when
a user is accessing (a) a medical record via an open
pharmacy Wi-Fi network to check for allergies to a
specific medication or (b) is at a coffee shop with
the smartphone analysing an x-ray exam.
ICEIS 2018 - 20th International Conference on Enterprise Information Systems
504
3 METHODS
To begin, the authors synthesize a recommendation
list of visualization techniques that were found in the
literature due to an extensive literature search. With
the description of each feature in detail, there is then
the analysis of the implications these can have on
security, both negatively and positively. This will
provide an objective recommendation list to help
users decide on which is the best visualization
technique to use at a specific request scenario and
context, providing this way the most secure
interaction with their device.
Further, this paper focuses on identifying the
importance of a user-adaptive system where
graphical interface and information visualization can
be adapted to support users showing detailed results
for a specific situation according to their individual
needs. Although the concept of user-adaptive system
could be applied in many different fields, this
investigation focus on healthcare where two use-
cases are described.
To validate the obtained list, the goal is to
compare two different scenarios of health data
request and visualization. This includes an analysis
on how the user characteristics and access context
can influence the adaptation of a graphical layout
interface, the way information is visualized and the
level of security of that action, in a specific moment.
The differences between scenarios and how
visualization would be done before and after
applying the identified visualization techniques are
shown with the help of mock-up visual interfaces.
4 SECURITY VISUALIZATION
4.1 Mobile Visualization Design
Due to mobile screen limited space, it is a challenge
to identify how much and what information should
be displayed, what the user really needs to see and
find a convenient way to present it. A significant
effort has been made to study different
representations and navigation techniques, especially
for large documents which are used in desktop
systems (Lapin, 2014). A few studies (Burigat,
Chittaro and Gabrielli, 2008) (Chittaro, 2006)
(Lapin, 2014) have shown that there are several
techniques and visualization methods suggesting an
adaptation of solutions originally designed only for
desktop. These are described next.
Restructuring of the Information Space
This technique consists in manually designing
specific web pages for each device. Automatically
reformatting is also an option. The method
transforms a multi-column layout into a one-column
layout. However, after this transformation, the
navigation structure may change significantly and it
may be difficult for users to take full advantage of
their experience.
Scrolling and Panning Techniques
With scrolling and panning the space is scrolled
horizontally and vertically and also part of the space
is panned out in any direction. The screen contains
part of the information space.
Zooming
Zooming is an effective method to scale the
information space and can be used to get several
perspectives. Objects can change size and shape or
they can appear and disappear from the visualization
space when zoomed.
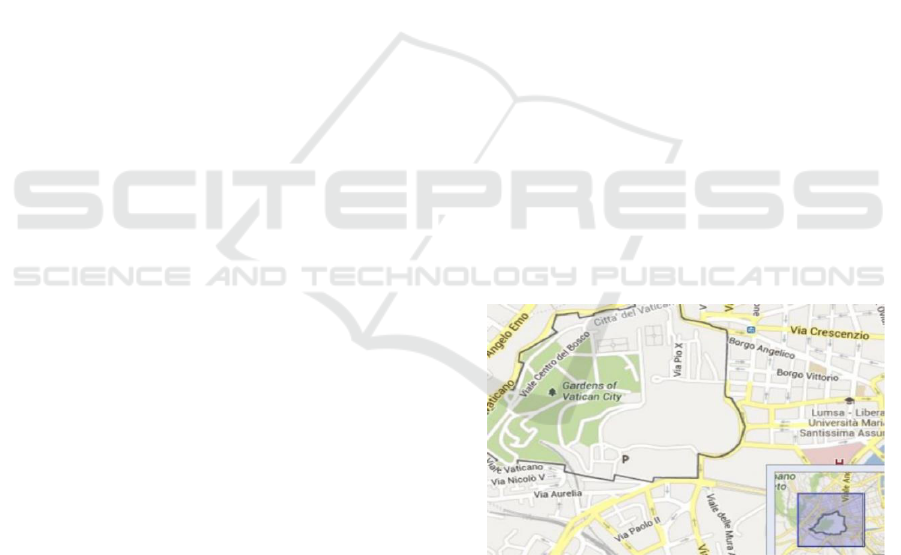
Overview and Detail Approaches
This method (Figure 1) provides two simultaneous
views, one for context and one for detail. The
context view highlights part of the displayed space
in the detail, with a rectangular viewfinder.
Figure 1: An overview and detail map (Lapin, 2014).
Focus and Context Approaches
This technique displays context and detail
information simultaneously without separating the
two views and allows users to explore areas by
stretching or squeezing rectilinear focus areas. The
best example is the fish-eye view which increases
objects of the user’s focal attention and gradually
decreases the size of more distant objects (Figure 2).
How Can Visualization Affect Security?
505
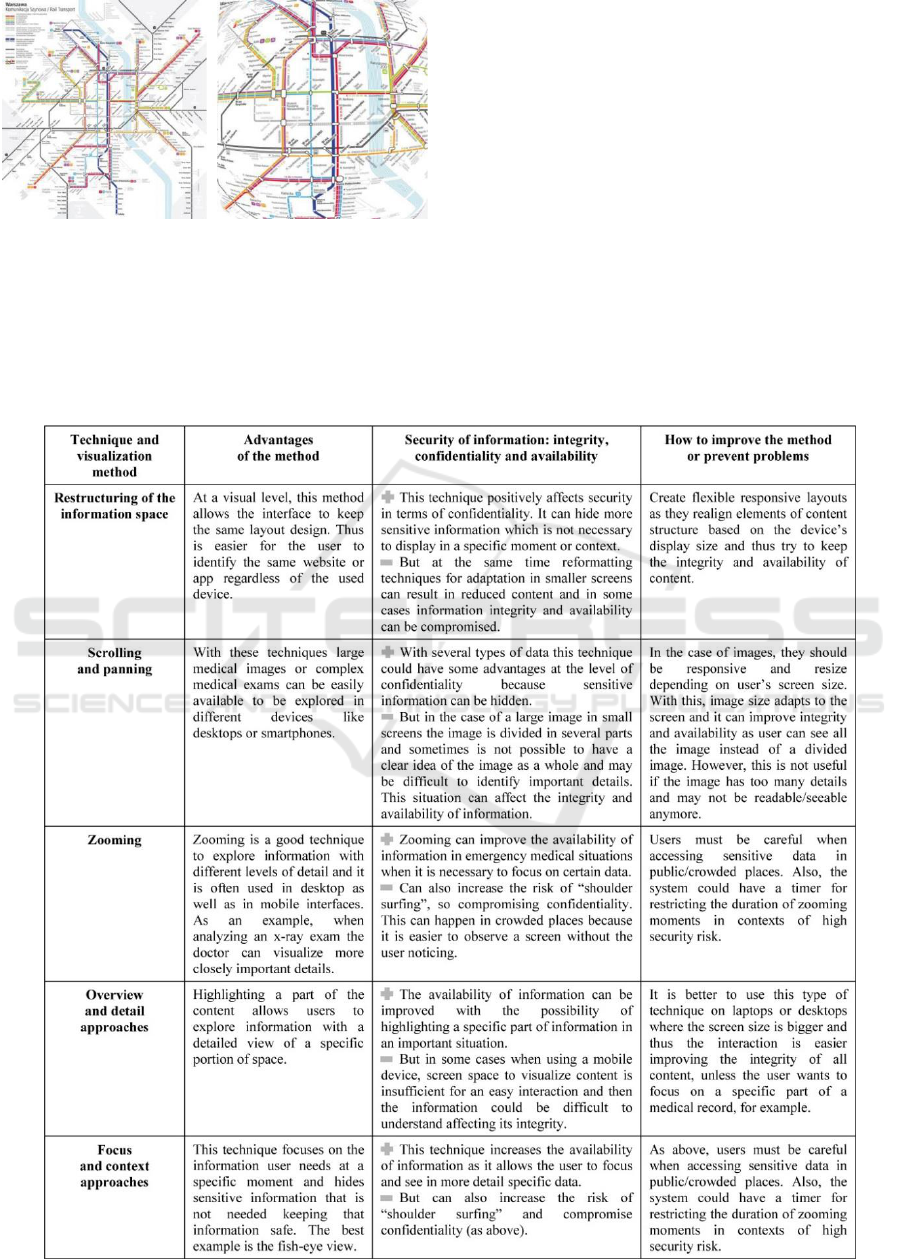
Figure 2: Example of a fish-eye view (Lapin, 2014).
4.2 Security Analysis
With the previous study of different techniques and
visualization methods (subsection 4.1), in this
section we analyse the security of information taking
in consideration the characteristics of each method.
Many websites and apps are adapted and
visualized differently, with a specific design,
interface and layout characteristics, depending on
which device is used. Each of the methods has
advantages but at the same time has security
problems. The three main security characteristics:
Confidentiality, Integrity, Availability (CIA) can be
compromised in some situations.
Based on a few studies mentioned above
(Burigat, Chittaro and Gabrielli, 2008) (Chittaro,
2006) (Lapin, 2014) about techniques and
visualization methods, in Table 1 we reflect about:
(a) the advantages of using these methods for
visualization; (b) how integrity, confidentiality and
Table 1: Security analysis of visualization techniques described in (Lapin, 2014).
ICEIS 2018 - 20th International Conference on Enterprise Information Systems
506
availability can be compromised; and (c) how it is
possible to improve or prevent security problems.
4.3 User-adaptive Visualization
Interface and Content
User-adaptive visualization interface can be
understood as being an interface made by graphical
components (images, text and buttons) that change
and adapt its structure, behaviour and function based
on each individual’s information (Yelizarov and
Gamayunov, 2014) (Schwartze, Blumendorf and
Albayrak, 2010). Traditionally, information
visualization systems ignored user needs, abilities
and preferences and followed a one-size-fits-all
model (Steichen, Carenini and Conati, 2013). In
order to have an effectively adaptation, visualization
techniques must take into account users’
characteristics such as type of device, location,
connection, time and other security and privacy
aspects. The layout and information content must
change and adapt to those characteristics.
Schwartze et al., (Schwartze, Blumendorf and
Albayrak, 2010) also defend that the layout model
defines the spatial relationship between elements
(such as images, text and buttons) and set its width
and height depending on platform, environment and
user characteristics. In their opinion, a layout model
should be dynamic, where context sensitivity, user
preferences, device capabilities and characteristics,
environment conditions, and also unexpected
situations, require an automatic context adaptation of
graphical user interfaces at runtime.
Some examples of user-adaptive systems are
described next. Baus et al. (Baus, Kruger and
Wahlster, 2002) present a project named REAL.
This mobile pedestrian navigation system adapts the
presentation of route description according to the
actual user position, the limited technical resources
of the device and the cognitive resources of the user.
Another study about a visit to a museum described
in (Rocchi, Stock, Zancanaro, Kruppa and Kruger,
2004), focuses on an interaction with a mobile
device with the adaptation of the style and content
presentation to the context and interests of the
visitors in order to provide a coherent presentation
throughout the visit. A similar study (Graziola,
Pianesi, Zancanaro and Goren-Bar, 2005) regards
the adaptation between a mobile museum guide and
the personality and attitudes of each participant. In
this case the authors used adaptive video
presentations, in which the system dynamically
composes video presentations by adding or
removing shots to provide detailed description,
depending on actual user interests, interaction
history as well as current and previous locations.
5 USE-CASES
In order to demonstrate the application of Adaptive
Graphical Visualization Interface (AGVI)
application, two use-cases are presented where we
can compare two different situations and analyse
how the user and context characteristics can
influence the way information is visualized and the
level of security in a specific moment. The
visual/graphical interface will be dynamically
adapted to the specific needs, characteristics and
context of the user during visualization in real-time.
In addition to the visual part, the information content
available is also dependent on the characteristics
mentioned above. We will also analyse if the
techniques presented in Table 1 can be used to
improve security visualization.
The use-cases are based on two fictional EHR
apps. In Use-Case A, the user is a patient who needs
to visualize his health records at a pharmacy using a
mobile device and the app MyHealth. Use-Case B
describes a mobile app called iMedicine used by a
doctor when searching for her patients’ records.
Use-Case A
Paulo is a patient and he is at a pharmacy during
lunch time but there is a very long queue. While he
is waiting he is using his smartphone and trying to
sign in through the app where he has the information
about all his medical records, including
appointments, prescriptions, tests, lab results and
medical notes. He needs to see the last medical
prescription in the system by his doctor to check for
allergies to a specific medication (Figures 3 and 4).
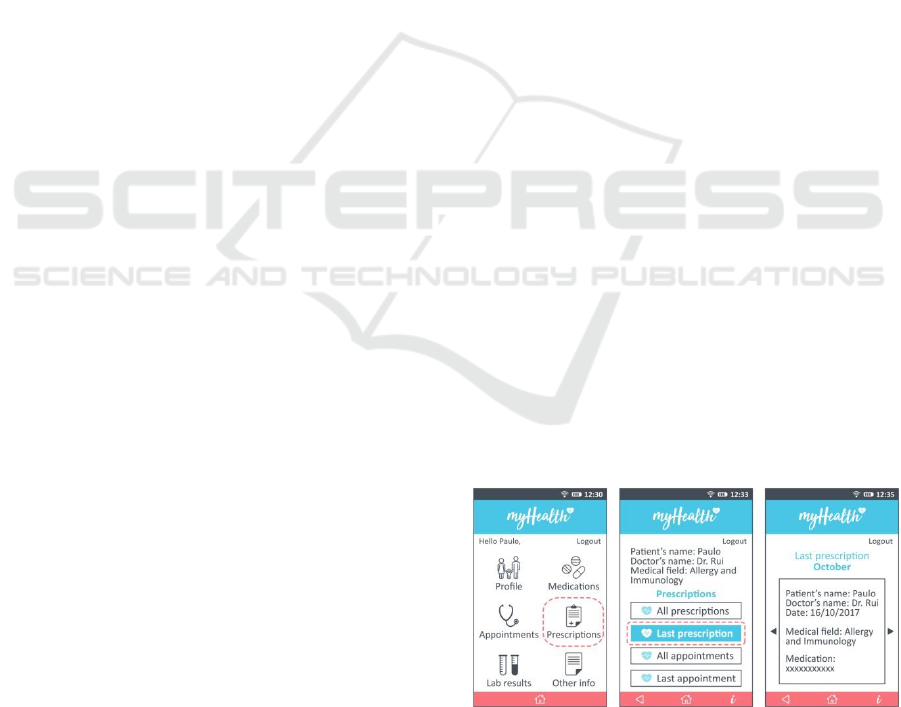
Figure 3: Before using the AGVI, Paulo, the patient, is
able to see everything available about his medical records
without considering all the involved risks.
How Can Visualization Affect Security?
507
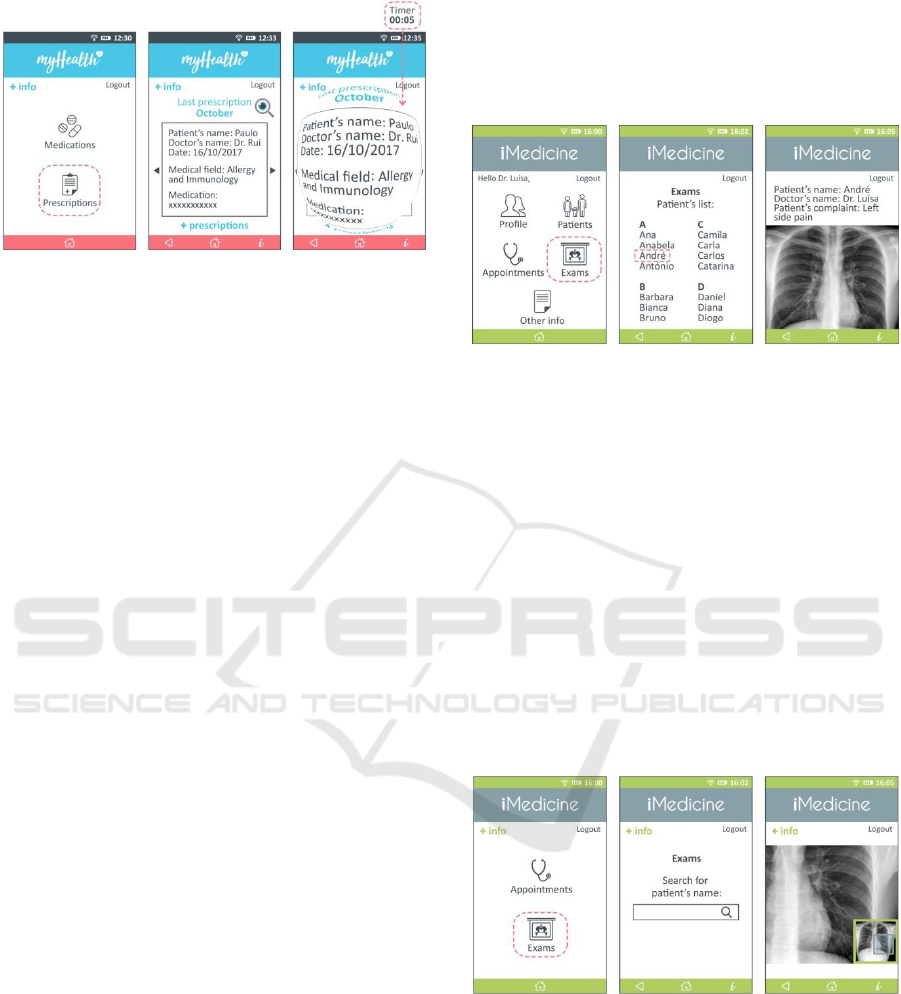
Figure 4: After using the AGVI the app shows information
according with user’s context and needs with improved
visual security.
Ideally, the AGVI in place analyses Paulo’s
characteristics: device (smartphone), location
(pharmacy/public place), connection (public open
Wi-Fi) and time (lunch time). Paulo connects to the
pharmacy free Wi-Fi network so he does not need to
authenticate. This is considered as a high security
risk connection. As Paulo is in a pharmacy the
system only provides the items related with
“Medications” and “Prescriptions” (Figure 4).
If for some reason Paulo needs more information
he can access it through the icon on the upper left
corner “+info”. When he chooses the option
“Prescriptions” the system shows him the most
recent ones. At this stage, visualization techniques
from Table 1 are applied. The technique
“restructuring of the information space” (line 1 in
Table 1) can be used to adjust the information
content to the smartphone’s screen space. Also
“focus & context approaches”, more precisely the
fish-eye technique, is available (line 5 in Table 1).
This is useful if Paulo needs to see part of the
information in more detail. When using the fish-eye
technique the system uses a timer for restricting the
duration of zooming moments in contexts of high
security risk (in this case 5 seconds).
Use-Case B
Dr. Luísa is a medical doctor at Hospital de São João
in Porto. After her shift she goes to a coffee shop to
meet a friend around 4pm. Already in the place she
receives a call from a co-worker with some doubts
about a patient. Her colleague needs help to confirm
some diagnostic in an x-ray exam. Dr. Luísa has her
smartphone with her so she accesses the app with
her doctor credentials. She is using the free Wi-Fi
network from the coffee shop so it is a high security
risk connection. She signs into the app and she
searches for the patient’s exam result. Again,
without the AGVI she is able to see everything: her
profile, her patients, appointments, exams and other
info. After choosing the exams icon she can see the
list of all her patients and select the patient she needs
to see the exam (Figure 5).
Figure 5: Before using the AGVI Dr. Luísa is able to see
everything about her profile, patient’s information and
exam details.
On the other hand, with AGVI, the visualization and
related security are different. In this case Dr. Luísa
just sees two menu icons and if she chooses “exams”
option (and for security reasons) she needs to type
the patient’s name. Then it is possible to see the
exam with no other identifiable patient information
to protect their privacy (Figure 6). In this case a
visualization technique from Table 1 is also applied.
She can use the technique “overview and detail
approaches” (line 4 in Table 1) to highlight a
specific part of the exam that was mentioned by her
colleague (third image in Figure 6). At all times she
can access more detailed information by selecting
the “+info” icon.
Figure 6: After using the AGVI, the app shows
information according with user’s most common accessed
contents (e.g. appointments and exams), user’s context and
needs, together with improved visual security.
6 DISCUSSION
In this study we focus on techniques and
visualization methods and their implications on
security to help users control and decide on the best
ICEIS 2018 - 20th International Conference on Enterprise Information Systems
508

ways to securely interact with their device. The
authors could not find research work that provides
an analysis of visualization techniques and their
impact on security. There are some techniques
available that focus on adapting views to types of
devices, mainly screen size (section 4).
Nevertheless, these techniques can indirectly
influence the three main characteristics of security
(e.g., CIA). Table 1 presents this analysis and,
although it focuses on only five visualization
techniques, it is easy to see that each technique can
influence positively or negatively CIA. This
influence is not clear when we look at the definition
of each technique and their goals separately. As
such, the table helps to get this understanding clearer
and more obvious. It helps to reason that using a
specific technique may have other implications to
information security that, once known, can be either
avoided or used for improved security at certain
contexts. This is certainly crucial in more sensitive
environments such as healthcare and with the use of
mobile devices that allow access to information
anytime/anywhere. Still, the provided analysis is
generic and needs to be more detailed,
complemented and validated in future work.
Adaptive Graphical Visualization Interface
(AGVI) to user and content is a technique that is
more focused on context and user requirements than
the type of device used and so can be a relevant
solution to complement existing techniques. Despite
encountering a few examples of its use, the authors
could not find a clear and detailed methodology and
procedures that could help with their implementation
in practice. Still, that concept can be applied in the
healthcare domain because its heterogeneous
characteristics require versatile and adaptable
solutions to visualize sensitive data with the new
mobile paradigm. This is why the authors decided to
analyse two use-cases (one for the patient and one
for the healthcare professional) to verify how the
studied techniques together with AGVI can impact
security visualization.
In use-case A, the app can filter search options
according to the collected contextual data. Only
these options are displayed, with the possibility to
access others, if necessary. In a busy environment
with high risk security connections, this type of
technique can be adequate in preventing
confidentiality breaches. Further, applying a timer to
restrict access duration to fish-eye views (or other
zoom techniques) can be an appropriate mean to
improve both availability and confidentiality. This
type of adaptable visualization system can be used
for many similar contexts and situations. However,
other issues need to be studied and solved for this
scenario as patient sensitive information still travels
in clear over unsecure wireless networks and can be
easily eavesdropped.
Use-case B presents a similar scenario but now
with the perspective of a healthcare professional.
Different contextual, type of access, technical means
and user characteristics apply and so different visual
techniques are used to adapt to these. Again, the
differences between using and not using the AGVI
are notorious. A lot of information that is not
required for a specific context can be hidden and
requested information can be made more available
and with better quality (especially important when
viewing imaging exams).
Both use-cases show that although not many
visualization techniques are available these can still
be used to improve visualization security and be
adapted to different types of scenarios. This paper
contributes with a list of visualization techniques
and their appliance in healthcare scenarios for
improved privacy and security. However, this is just
the starting point as altering information
visualization can also affect usability. There is the
need to further test and analyse different scenarios
and thoroughly validate security as well as usability
issues involved.
Limitations. There is not much research data
available or guidelines that help in analysing
existing visualization techniques and show how
these can affect security and privacy of the
visualized data. We worked with existing techniques
we encountered in our searches. Also, due to space
and time constraints we could only show and test
these techniques in two use-cases on the healthcare
domain. It was not possible to test in real scenarios
with real users to see if the proposed adaptations
really improve privacy and security of health data.
This first step can however foment needed research
in this area as mobile secure visual studies can
comprise various multidisciplinary challenges.
7 CONCLUSIONS
Despite all the security mechanisms that can be in
place to protect applications, the way people interact
with interfaces is a crucial issue to take into
consideration as this can affect information security
and privacy. The vision of user interfaces that adapt
to individuals’ needs and preferences is not new.
However, their realization and impact on security
and, specifically, in the healthcare domain is a great
How Can Visualization Affect Security?
509

challenge, both to define and validate. This paper
presents a first step in that direction but much needs
to be done. As future work, we intend to explore and
test users’ different visualization needs and abilities
and how the system can adapt and show detailed
results for a specific situation. We also aim to
identify the importance of having a system where
visualizations can be customized and support users
according to their individual needs and roles in the
healthcare practice.
ACKNOWLEDGEMENTS
Project “NORTE-01-0145-FEDER-000016”
(NanoSTIMA) is financed by the North Portugal
Regional Operational Programme (NORTE2020),
under the PORTUGAL 2020 Partnership
Agreement, and through the European Regional
Development Fund (ERDF).
REFERENCES
Baus, J., Kruger, A. and Wahlster, W. A resource-adaptive
mobile navigation system. Proceedings of the 7th
international conference on Intelligent user interfaces,
2002 San Francisco, California, USA. 502723: ACM,
15-22.
Boulos, M. N. K., Wheeler, S., Tavares, C. and Jones, R.
2011. How smartphones are changing the face of
mobile and participatory healthcare: an overview, with
example from eCAALYX. BioMedical Engineering
OnLine, 10, 24-24.
Bravo-Lillo, C., Cranor, L. F., Downs, J., Komanduri, S.
and Sleeper, M. Improving Computer Security Dialogs.
In: Campos, P., Graham, N., Jorge, J., Nunes, N.,
Palanque, P. & Winckler, M., eds. Human-Computer
Interaction - INTERACT 2011: 13th IFIP TC 13
International Conference, Lisbon, Portugal, September
5-9, 2011, Proceedings, Part IV, 2011 Berlin,
Heidelberg. Springer Berlin Heidelberg, 18-35.
Burigat, S., Chittaro, L. and Gabrielli, S. 2008. Navigation
techniques for small-screen devices: An evaluation on
maps and web pages. International Journal of Human-
Computer Studies, 66, 78-97.
Chittaro, L. 2006. Visualizing information on mobile
devices. Computer, 39, 40-45.
Google. 2016. How People Use Their Devices - What
Marketers Need to Know [Online]. Available: https://
www.thinkwithgoogle.com/advertising-channels/
mobile/device-use-marketer-tips/ [Accessed
21/08/2017].
Graziola, I., Pianesi, F., Zancanaro, M. and Goren-Bar, D.
Dimensions of adaptivity in mobile systems:
personality and people's attitudes. Proceedings of the
10th international conference on Intelligent user
interfaces, 2005 San Diego, California, USA. 1040879:
ACM, 223-230.
Jeske, D., Coventry, L. and Briggs, P. 2014. Decision
Justifications for Wireless Network Selection. 2014
Workshop on Socio-Technical Aspects in Security and
Trust.
Joshi, J. B. D., Aref, W. G., Ghafoor, A. and Spafford, E.
H. 2001. Security models for web-based applications.
Commun. ACM, 44, 38-44.
Lapin, K. Visualization Approaches for Mobile Devices.
In: PRESS, T., ed. In Proceedings of the 11th
International Baltic Conference, 2014 Baltic.
Databases and information systems.
Moon, B. C. and Chang, H. 2014. Technology Acceptance
and Adoption of Innovative Smartphone Uses among
Hospital Employees. Healthcare Informatics Research,
20, 304-312.
Paterno, F. 2014. User Interface Design Adaptation
[Online]. Interaction Design Foundation. Available:
https://www.interaction-design.org/literature/book/the-
encyclopedia-of-human-computer-interaction-2nd-
ed/user-interface-design-adaptation [Accessed
29/08/2017].
Rocchi, C., Stock, O., Zancanaro, M., Kruppa, M. and
KRUGER, A. 2004. The museum visit: generating
seamless personalized presentations on multiple
devices. Proceedings of the 9th international
conference on Intelligent user interfaces. Funchal,
Madeira, Portugal: ACM.
Schwartze, V., Blumendorf, M. and Albayrak, S.
Adjustable context adaptations for user interfaces at
runtime. Proceedings of the International Conference
on Advanced Visual Interfaces, 2010 Roma, Italy.
1843051: ACM, 321-324.
Simmons, D. 2014. Free wi-fi hotspots pose data risk,
Europol warns [Online]. BBC News. Available: http://
www.bbc.com/news/technology-26469598 [Accessed
07/08/2017].
Steichen, B., Carenini, G. and Conati, C. User-adaptive
information visualization: using eye gaze data to infer
visualization tasks and user cognitive abilities.
Proceedings of the 2013 international conference on
Intelligent user interfaces, 2013 Santa Monica,
California, USA. 2449439: ACM, 317-328.
Yelizarov, A. and Gamayunov, D. Adaptive Visualization
Interface That Manages User's Cognitive Load Based
on Interaction Characteristics. Proceedings of the 7th
International Symposium on Visual Information
Communication and Interaction, 2014 Sydney NSW,
Australia. 2636844: ACM, 1-8.
Zaaba, Z. F., Furnell, S. M. and Dowland, P. S. 2014. A
study on improving security warnings. The 5th
International Conference on Information and
Communication Technology for The Muslim World
(ICT4M).
ICEIS 2018 - 20th International Conference on Enterprise Information Systems
510
