
Facial Temperature Markers for Mental Stress Assessment in
Human-Machine Interface (HMI) Control System
Changjiang He
1
, M. Mahfouf
1
and L. A. Torres-Salomao
2
1
Automatic Control and Systems Engineering Department, University of Sheffield, Sheffield, U.K.
2
Digital Systems and Solutions, General Electric Infraestructure Queretaro, Queretaro, Mexico
Keywords:
Human-Machine Interfaces, Psychophysiology, Human Factors, Stress Detection, Facial Temperature.
Abstract:
Mental state prediction is of great importance to human-machine interface (HMI) as far as both safety and
reliability are concerned. In this paper, the use of facial temperature changes for predicting mental stress has
been investigated. A carefully designed experiment of HMI has been performed on seven (7) healthy subjects,
and the statistical analysis of the results has been provided, and the effectiveness of using facial temperature
with the thermal camera to estimate the human mental stress has been established. The biomarkers developed
from the data of facial temperature have exhibited a similar or even better ability to differentiate between the
mental stress levels in comparison with the traditional biomarkers (e.g. heart rate variability (HRV), task load
index (TLI) and pupil size). The mean nasal temperature has been shown to be sensitive to changes in the
mental state, and the maximum facial temperature and the mean forehead temperature have also shown clear
correlations with mental stress and task performance.
1 INTRODUCTION
The combination of an automatic system with a hu-
man operator has been widely implemented in many
human-centered environments, including manufac-
turing, transportation and clinical medicine. How-
ever, the performance of such a combination has usu-
ally been compromised by increasing operational de-
mands on the human operator, which can also threaten
the safety and reliability of the whole system (Walter
et al., 2014). Therefore, it is of paramount importance
to introduce an effective interface between the human
operator and the automatic system. The main aim of
this interface is to help the automatic system to assign
suitable tasks for the human operator depending on
his or her mental stress level and to achieve the best
overall task performance.
The human operator’s performance in a certain
task is dependent on his or her attention span, cog-
nition, perception and execution, which all develop
from the basic conditional reflex (Barrett, 2006; Bar-
rett et al., 2007). Therefore, monitoring the activities
of some specific neurons and subsystems they regu-
late has proved to be a valid approach to assess one’s
mental stress (Barrett, 2006; Barrett et al., 2007; In-
zlicht et al., 2015). In the area of human-machine
interface research, the assessment of the human op-
erator’s mental stress level usually combines periph-
eral physiology, startle response, central physiology
and behaviour. The frequently used measurements
cover electrocardiography (ECG), electroencephalog-
raphy (EEG), pupil size, blood pressure, blood vol-
ume, blood volume pulse, respiration, muscle tension,
electrodermal activity, galvanic skin and temperature
signals (Mahfouf et al., 2007; Nassef et al., 2010;
El-Samahy et al., 2015; Ting et al., 2010; Torres-
Salomao et al., 2015; Torres-Salomao et al., 2017;
Zhai and Barreto, 2006).
Heart rate variable (HRV) from ECG and task
load index (TLI) from EEG are the most common
and recommended mental stress biomarkers. HRV is
consistently corresponding to cardio-respiratory sys-
tem, which is susceptible to the changes of men-
tal stress (Bernardi et al., 2000; Kuriyagawa and
Kageyama, 1999). The aim of TLI is to calcu-
late one’s working memory (WM), which constitutes
one’s ability to maintain the focus on one specific task
regardless of the surrounding interference (Gevins
and Smith, 2003; Smith et al., 2001). However,
EEG and ECG measurements are normally involved
with using the electrodes to record voltage differ-
ences across the skin. Such a requirement has lim-
ited the movement and the range of movement of the
human operator and disturbed his or her mental state
He, C., Mahfouf, M. and Torres-Salomao, L.
Facial Temperature Mar kers for Mental Stress Assessment in Human-Machine Interface (HMI) Control System.
DOI: 10.5220/0006820700210028
In Proceedings of the 15th International Conference on Informatics in Control, Automation and Robotics (ICINCO 2018) - Volume 2, pages 21-28
ISBN: 978-989-758-321-6
Copyright © 2018 by SCITEPRESS – Science and Technology Publications, Lda. All rights reserved
21

as well. Meanwhile, the measurements here remain
sensitive to the noise introduced by defective skin-
electrode connections and surrounding electromag-
netic fields. The high complexity of EEG and ECG
measurements has limited the efficiency and safety of
applying HRV and TLI in the real world situations.
Therefore, it is important to design and integrate new
mental stress biomarkers with the existing system to
overcome these constraints.
Facial temperature recorded by infrared cameras
has been recongised as a potential valid reflection
of the human mental state nowadays. Infrared cam-
eras have hitherto provided a reliable means of doc-
umenting the facial temperature in real time with-
out body contact, and they usually have fewer re-
quirements about the work environment compared
with EEG and ECG. State-of-the-art research has
demonstrated that both the hypothalamus and the
parasympathetic-sympathetic nervous system have
significant emotion induced influence on the human
thermoregulation (Clay-Warner and Robinson, 2015;
Hong and Hong, 2016). Such impact usually leads to
changes in skin temperature and forms different pe-
riodic temperature cycles from seconds to minutes,
which are observable with infrared cameras (Brengel-
mann, 2000; Charkoudian, 2003; Houdas and Ring,
2013). Previous studies have also proved that temper-
ature readings from the forehead, the periorbital and
the nasal regions are closely correlated with mental
stress (Hong and Hong, 2016; Nhan and Chau, 2009;
Nhan and Chau, 2010; Nozawa and Tacano, 2009).
Thus, the biomarkers based on the facial tempera-
ture readings from the camera have great potential
to provide accurate mental stress estimation instan-
taneously, and also retain adequate distance from the
subject comparing to the HRV and TLI.
While the ultimate of this researchis to control the
human-machine interface, the specific objectives are
(1) to validate the effectiveness of using facial temper-
ature for assessing mental stress in HMI, (2) to com-
pare the efficiency of using facial temperature as a
mental stress biomarker with other existing biomark-
ers, (3) to outline the limitation of current research
and discuss the future development of the tempera-
ture biomarker within the human machine interface
framework.
2 EXPERIMENTAL SETUP
2.1 Participants
Ten (10) healthy research students from the Auto-
matic Control and Systems Engineering Department
at the University of Sheffield (UK) were selected as
suitable participants for the experiment. The volun-
teers included both genders, from 22 to 30 years old
with an average age of 25.
2.2 Simulation of Human Machine
Interaction
Mental arithmetic was selected as the simulation of
HMI in this experiment. Mental arithmetic proved
to be a simple efficient intuitive way of introduc-
ing physio-psychological stress (Garde et al., 2002;
Hjortskov et al., 2004). The mental arithmetic assess-
ment applied in this experiment was based on a Mat-
lab GUI application, which was similar to the one im-
plemented in previous HMI studies (Torres-Salomao
et al., 2015; Torres-Salomao et al., 2017). The men-
tal arithmetic task required the participant to complete
the multiplication of two numbers within a certain
amount of time.
2.3 Data Acquisition
EEG and ECG data were continuously monitored via
the Biosemi Active Two System. EEG signals were
collected with a 32+2 electrodes layout from a stan-
dard Biosemi 10/20 system. ECG signals were ac-
quired from the 3-lead system that formed a trian-
gle area covering the chest. Data was recorded with
Biosemi ActiView software with a sampling rate at
2048 Hz. Pupil size was measured by a Gazepoint
eye-tracking camera, and the acquisition was done
by Gazepoint software during the experiment. Facial
Temperature was captured with a FLIR P640 24 de-
gree thermal imaging camera, which was placed hor-
izontally to the subject’s face with the emissivity of
0.98. The thermal imaging sequences were captured
with a sampling frequency of 10 Hz by FLIR Re-
searchIR.
2.4 Data Analysis
The thermal imaging sequences were analysed in
MATLAB
®
to extract the temperature changes in the
regions of interest (ROI), which were the maximum
facial temperature (around periorbital), the mean
nasal temperature and the mean forehead temperature,
see Figure 1.
The maximum facial temperature was calculated
as follows:
MaximumFacialTemperature =
max(Temp
(i, j)
)|∀i ∈ L, ∀ j ∈ W
, (1)
ICINCO 2018 - 15th International Conference on Informatics in Control, Automation and Robotics
22
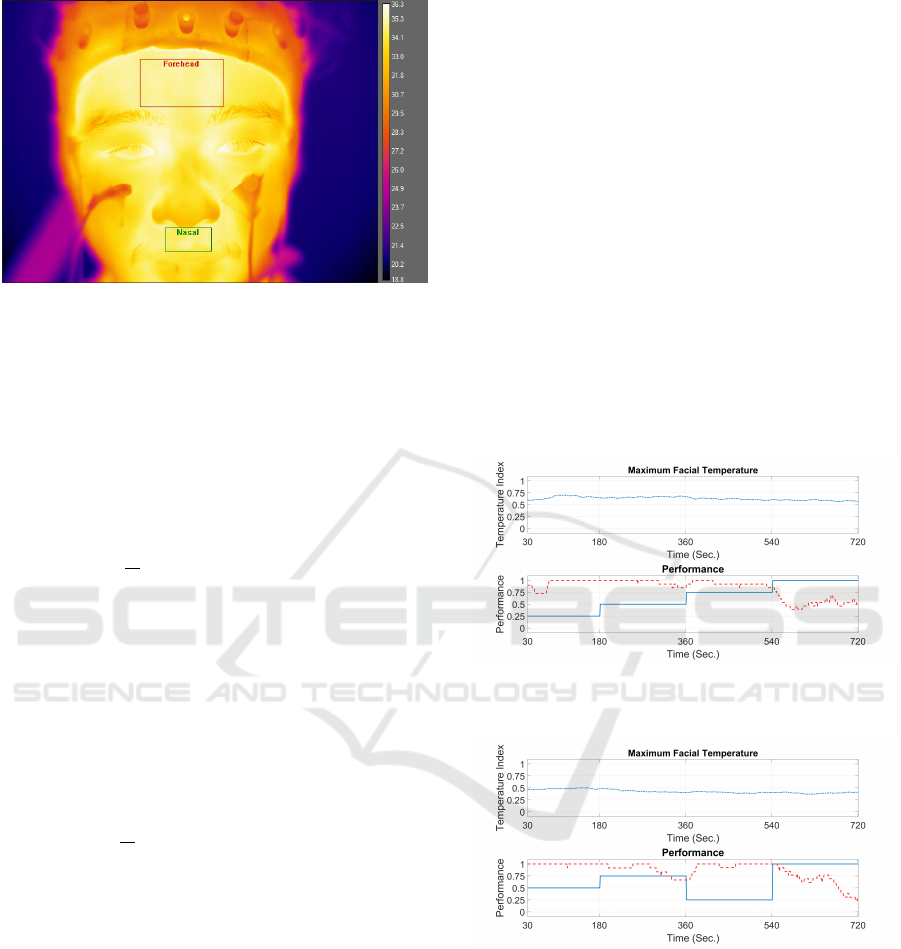
Figure 1: Regions of interest: periorbital, nasal and fore-
head.
where Temp
(i, j)
represents the average temperature
recorded at pixel (i, j) for a period of 15 seconds, and
L and W were the numbers of the columns and rows
of pixels in a frame.
The mean nasal temperature was calculated as fol-
lows:
MeanNasalTemperature =
1
N
∑
Temp
(i, j)
|∀i ∈ X, ∀ j ∈ Y
, (2)
where Temp
(i, j)
represents for the average tempera-
ture recorded at pixel (i, j) from the selected region
for a period of 15 seconds, and X and Y were the num-
bers of the columns and rows of pixels in the selected
region.
The mean forehead temperature was calculated as
follows:
MeanForeheadTemperature =
1
N
∑
Temp
(i, j)
|∀i ∈ M, ∀ j ∈ N
, (3)
where Temp
(i, j)
represents for the average tempera-
ture recorded at pixel (i, j) from the selected region
for a period of 15 seconds, and M and N were the
numbers of the columns and rows of pixels in the se-
lected region.
2.5 Procedure
The whole experiment for one subject lasted approxi-
mately 40 minutes, including two 12-minute mental
arithmetic Sessions and one 12-minute comparison
Session in the interval, with 2-minute breaks in be-
tween Sessions. Within each mental arithmetic Ses-
sion, there were four 3-minute sub-sessions of varying
difficulty levels. The difficulty level was determined
by the digit of the numbers and the time allocated for
answering the questions, and the order of them was al-
tered after the first arithmetic Session to separate the
physiological changes introduced by the mental state
from the normal daily activities.
3 RESULTS
3.1 Maximum Facial Temperature
The overall average value of the maximum facial
temperature for all the volunteers was 36.0334
◦
C.
Changes in temperature for different Sessions were
mostly around 0.10
◦
C, and below 0.10
◦
C for any
two adjacent sub-sessions. However, compared to the
period of the control Sessions, the maximum temper-
ature of the experimental Sessions has demonstrated
a certain degree of deviation from the initial values
recorded at rest.
(a) Normalised maximum facial temperature (-.-), accuracy
(- -) and difficulty level (-) plots for participant 1. Session 1
with elevated difficulty levels
(b) Normalised maximum facial temperature (-.-), accuracy
(- -) and difficulty level (-) plots for participant 1. Session 3
with randomised difficulty levels
Figure 2: Maximum Facial Temperature.
In the primary experiment with ten participants,
the maximum facial temperatures of six subjects were
consistently correlated with their task performance
for both increasing and random difficulty order, see
Figure 2. Among the six participants, four of these
showed negative correlations between the tempera-
ture and the accuracy, while the other two demon-
strated positive correlations. Thus, the mental state
Facial Temperature Markers for Mental Stress Assessment in Human-Machine Interface (HMI) Control System
23
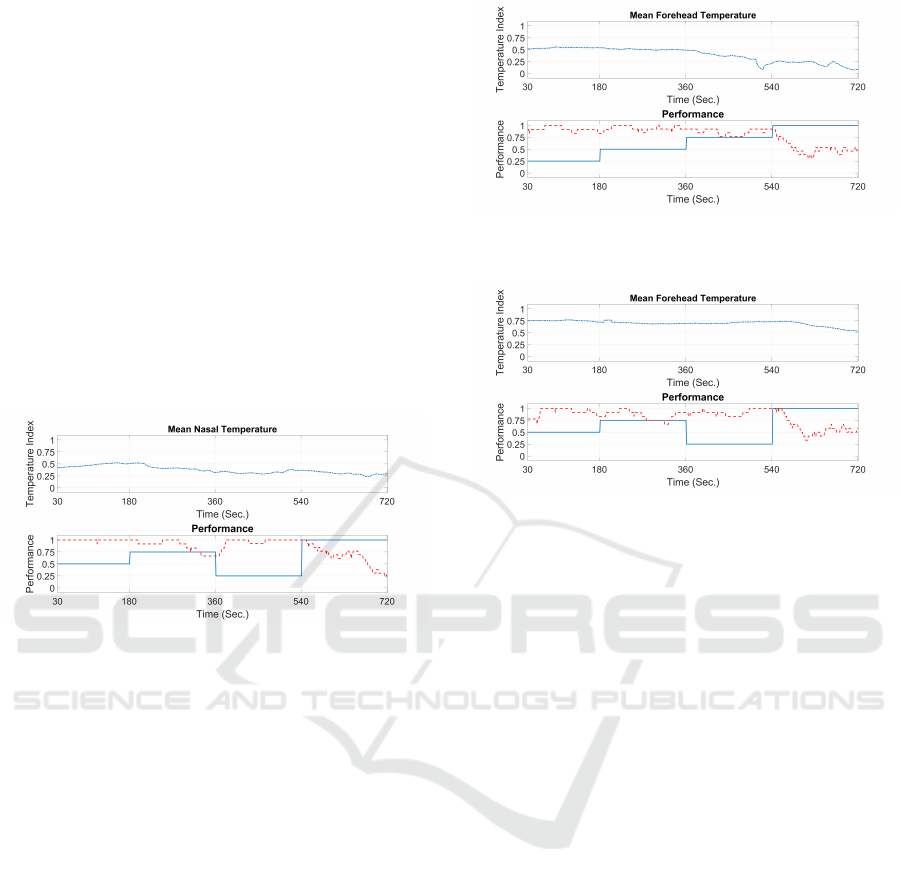
induced change of the maximum facial temperature
was predominantly affected by the individual.
3.2 Mean Nasal Temperature
The general mean value of the mean nasal tempera-
ture for all test subjects was 33.6021
◦
C. The change
of temperature over the different Sessions ranged
from 0.30 up to 2.20
◦
C, and from 0.02 to 0.54
◦
C for
any two nearby sub-sessions. Apart from the temper-
ature difference within the control Sessions and the
experimental Sessions, the increases and decreases
of the mean nasal temperature were also closely re-
lated to the rise and fall of the subjects’ accuracy,
which supports the findings from previous research
mentioned in the literature review, see Figure 3 for
example.
Figure 3: Normalised mean nasal temperature (-.-), accu-
racy (- -) and difficulty level (-) plots for participant 1. Ses-
sion 3 with randomised difficulty levels.
3.3 Mean Forehead Temperature
The overall mean value of the forehead temperatures
across all volunteers was 33.9252
◦
C. The mean tem-
perature difference between the Sessions ranged from
0.01 to 1.50
◦
C, and were mostly around or below
0.10
◦
C between any two neighbouring sub-sessions.
Compared to the maximum facial temperature, the
forehead temperatures of the experimental Sessions
have shown a similar degree of deviation from the
value of the control Sessions. Also, six out of the
seven participates have demonstrated consistent cor-
relations between their task performance and their
mean forehead temperature, for the experiment Ses-
sions with both ordered and randomised difficulty lev-
els. An example is provided in Figure 4.
In the previous six volunteers, the mean forehead
results of five subjects showed positive correlations
with their accuracy, and remaining subject showed a
negative correlation. Therefore, it can be concluded
that, similarly to the maximum facial temperature,
this change of mean forehead temperature was influ-
enced by the individual variation as well.
(a) Normalised mean forehead temperature (-.-), accuracy
(- -) and difficulty level (-) plots for participant 7. Session 1
with elevated difficulty levels
(b) Normalised mean forehead temperature (-.-), accuracy
(- -) and difficulty level (-) plots for participant 7. Session 3
with randomised difficulty levels
Figure 4: Mean Forehead Temperature.
3.4 Comparison with Other Biomarker
Heart rate variability (HRV) and task load index (TLI)
were previously recommended as the biomarkers for
the mental state estimation for years, and the pupil di-
ameter marker (PDM) has been validated as an effec-
tive biomarker for the mental stress (Bernardi et al.,
2000; Kuriyagawa and Kageyama, 1999; Gevins and
Smith, 2003; Smith et al., 2001; Torres-Salomao
et al., 2015; Torres-Salomao et al., 2017). There-
fore, the two-sample T-test was introduced to com-
pare the efficiency of using facial temperature as a
suitable stress biomarker with HRV, TLI and PDM.
According to the two-sample T-test, each biomarker
was tested for its ability to distinguish different men-
tal stress levels. For H = 0, then there were no signifi-
cant differences observed with a 5% confidence level.
For H = 1, there were significant differences between
the data from two sub-sessions. The details about the
test results were provided in the Appendix, and a sum-
mary presented in Table 1.
The distribution of a valid biomarker’s readings
must demonstrate a certain amount variation cor-
responding to the varying mental stress that intro-
duced by the different task difficulty levels. The two-
sample T-test has provided a quantitative measure-
ment for this type of the variation, and the higher H
value represents the better differentiation ability of the
ICINCO 2018 - 15th International Conference on Informatics in Control, Automation and Robotics
24

Table 1: Mean H Values for T-test Summary.
Biomarkers Session 1 Session 2
Facial 1.0000 1.0000
Nasal 0.9762 1.0000
Forehead 0.9762 0.9762
HRV1 0.9722 0.9444
HRV2 1.0000 1.0000
TLI1 0.7619 0.8571
TLI2 0.9167 0.9524
PDM 0.8690 0.8571
biomarker towards the mental stress. The biomarkers
developed from the data for facial temperature have
exhibited similar or even better ability to differentiate
the mental stress level in comparison to the traditional
biomarkers. This mainly contributes to the higher
sensitivity of the facial temperature towards the minor
mental stress changes in low pressure state comparing
to the other biomarkers. In general, the biomarkers
based on the facial temperature were more suscepti-
ble to the minor alteration of the mental state between
two close sub-sessions, especially for the maximum
facial temperature and the mean nasal temperature.
4 DISCUSSIONS
The experiments have studied the relationship be-
tween the facial temperature and the human mental
stress. It has been identified that the facial tempera-
ture recorded by the infrared cameras is correspond-
ingly correlated with the mental stress. Furthermore,
it can provide an accountable indication for the hu-
man mental stress estimation. This promises the fa-
cial temperature great potential without the limita-
tions that HRV and TLI suffer from. The effective-
ness and efficiency of using the facial temperature to
estimate the mental stress level have been validated
with the experiments, yet in practice, these biomark-
ers were still limited by two major problems: auto-
calibration of the camera and subjects’ head move-
ment.
Auto-calibration was designed to deal with the
problem of thermal drift in the data recording. The
thermal drift was related mainly to the abnormal tem-
perature shifts in the recordings, and it was intro-
duced by the changing temperature of the camera it-
self. The process was automatically programmed to
calibrate the camera depending on the temperature
change of the camera. During the one or two seconds
of auto-calibration, the camera measured the temper-
ature within itself rather than the outside target. As
a consequence, the recording was disturbed by the
sudden fluctuations that needed to be manually re-
moved during data processing. The lack of actual
data in those periods of time affected the ability of
biomarkers to reflect the mental state at those pre-
cise moments. The effect of the calibration was lim-
ited by switching on the camera at least ten minutes
before each experiment. However, this method only
reduced the number of calibration for a 12-minute
recording instead of eliminating calibration. Better
cameras may well provide more effective solutions to
this problem in the future.
Both FLIR ResearchIR and MATLAB
®
were only
able to support fixed windows for data extraction.
However, the subject’s head movement was unavoid-
able for such a long experiment. Therefore, windows
with fixed positions and fixed shapes were not capable
of handling the displacement and distortion caused by
this movement. Therefore, due to the failure of track-
ing regions of interest, the biomarkers based on the
data were not able to faithfully represent the actual
temperature changes in those areas, and thus their ef-
ficiency was constrained. Unfortunately, and in con-
trast to the object tracking in the normal RGB im-
ages, the thermal image lacked enough contrast of
shape for the normal tracking algorithm to follow.
Since there was little research on thermal image track-
ing and barely any actual algorithm, the participants
were advised to be conservative with their head move-
ments, which in this case caused distortions of the re-
sults.
The tracking of the region of interest seems to
represent the toughest challenge among all the other
above challenges. However, a new tracking algorithm
based on particle-filter may be a useful solution to this
problem (Dowdall et al., 2007; Driessen and Boers,
2008; Levin et al., 2008; Wu et al., 2012; Zhou et al.,
2009; Zhou et al., 2013). The algorithm, built on
the Matte algorithm that is based on the pixel de-
pendence, can deal with nonlinear motion within the
predict-update cycle in a simple way. Despite the lim-
itations of the current thermal imaging technique, the
facial temperature has proved to be a reliable tool for
mental stress measurement in HMI. Therefore, Fig-
ure 5 shows the proposed scheme that integrates the
facial temperature within the HMI system for opti-
mising monitoring/control performances.
5 CONCLUSIONS
In conclusion, the experimental results of the facial
temperature have validated the effectiveness and the
efficiency of using thermal imaging for mental state
estimation. Such a method proposes a more reliable
Facial Temperature Markers for Mental Stress Assessment in Human-Machine Interface (HMI) Control System
25
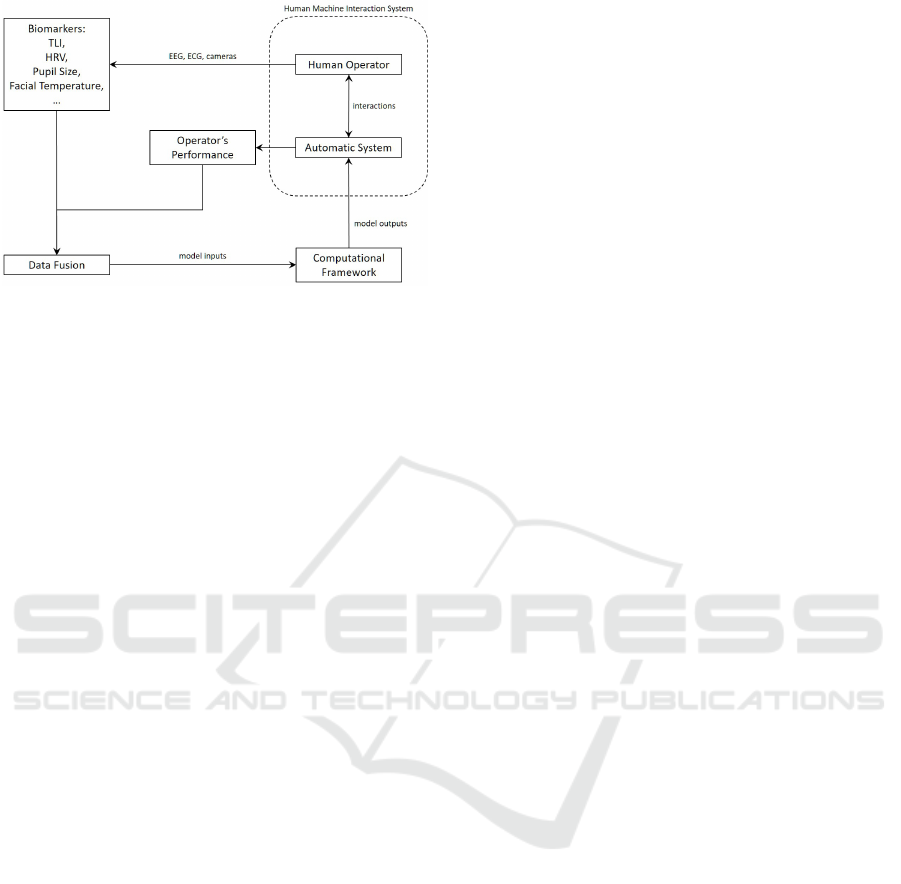
Figure 5: The Proposed Human Machine Interaction Sys-
tem.
marker for assessing the psychophysiological state of
the operator. Furthermore, the combination of the
facial temperature and other well-known biomarkers
can significantly increase the robustness of the system
and the precision of the prediction, as the facial tem-
perature measurement requires no body contact and
is more sensitive to the changes within the low men-
tal stress states.
REFERENCES
Barrett, L. F. (2006). Solving the emotion paradox: Cate-
gorization and the experience of emotion. Personality
and social psychology review, 10(1):20–46.
Barrett, L. F., Mesquita, B., Ochsner, K. N., and Gross, J. J.
(2007). The experience of emotion. Annu. Rev. Psy-
chol., 58:373–403.
Bernardi, L., Wdowczyk-Szulc, J., Valenti, C., Castoldi, S.,
Passino, C., Spadacini, G., and Sleight, P. (2000). Ef-
fects of controlled breathing, mental activity and men-
tal stress with or without verbalization on heart rate
variability. Journal of the American College of Cardi-
ology, 35(6):1462–1469.
Brengelmann, G. L. (2000). Body surface temperature:
Manifestation of complex anatomy and physiology of
the cutaneous vasculature. In Engineering in Medicine
and Biology Society, 2000. Proceedings of the 22nd
Annual International Conference of the IEEE, vol-
ume 3, pages 1927–1930. IEEE.
Charkoudian, N. (2003). Skin blood flow in adult human
thermoregulation: how it works, when it does not, and
why. In Mayo Clinic Proceedings, volume 78, pages
603–612. Elsevier.
Clay-Warner, J. and Robinson, D. T. (2015). Infrared ther-
mography as a measure of emotion response. Emotion
Review, 7(2):157–162.
Dowdall, J., Pavlidis, I. T., and Tsiamyrtzis, P. (2007).
Coalitional tracking. Computer Vision and Image Un-
derstanding, 106(2):205–219.
Driessen, H. and Boers, Y. (2008). Map estimation in parti-
cle filter tracking.
El-Samahy, E., Mahfouf, M., Torres-Salomao, L., and
Anzurez-Marin, J. (2015). A new computer con-
trol system for mental stress management using fuzzy
logic. In Evolving and Adaptive Intelligent Sys-
tems (EAIS), 2015 IEEE International Conference on,
pages 1–7. IEEE.
Garde, A., Laursen, B., Jørgensen, A., and Jensen, B.
(2002). Effects of mental and physical demands on
heart rate variability during computer work. European
journal of applied physiology, 87(4-5):456–461.
Gevins, A. and Smith, M. E. (2003). Neurophysiologi-
cal measures of cognitive workload during human-
computer interaction. Theoretical Issues in Er-
gonomics Science, 4(1-2):113–131.
Hjortskov, N., Riss
´
en, D., Blangsted, A. K., Fallentin, N.,
Lundberg, U., and Søgaard, K. (2004). The effect of
mental stress on heart rate variability and blood pres-
sure during computer work. European journal of ap-
plied physiology, 92(1-2):84–89.
Hong, K. and Hong, S. (2016). Real-time stress assess-
ment using thermal imaging. The Visual Computer,
32(11):1369–1377.
Houdas, Y. and Ring, E. (2013). Human body temperature:
its measurement and regulation. Springer Science &
Business Media.
Inzlicht, M., Bartholow, B. D., and Hirsh, J. B. (2015).
Emotional foundations of cognitive control. Trends
in cognitive sciences, 19(3):126–132.
Kuriyagawa, Y. and Kageyama, I. (1999). A model-
ing of heart rate variability to estimate mental work
load. In Systems, Man, and Cybernetics, 1999. IEEE
SMC’99 Conference Proceedings. 1999 IEEE Inter-
national Conference on, volume 2, pages 294–299.
IEEE.
Levin, A., Lischinski, D., and Weiss, Y. (2008). A closed-
form solution to natural image matting. IEEE Trans-
actions on Pattern Analysis and Machine Intelligence,
30(2):228–242.
Mahfouf, M., Zhang, J., Linkens, D. A., Nassef, A., Nickel,
P., Hockey, G. R. J., and Roberts, A. C. (2007). Adap-
tive fuzzy approaches to modelling operator func-
tional states in a human-machine process control sys-
tem. In Fuzzy Systems Conference, 2007. FUZZ-IEEE
2007. IEEE International, pages 1–6. IEEE.
Nassef, A., Mahfouf, M., Ting, C.-H., El-Samahy, E.,
Linkens, D. A., and Dena
¨
ı, M. A. (2010). Hybrid
physiological modeling of subjects undergoing cyclic
physical loading. In Biosignals, pages 252–257.
Nhan, B. and Chau, T. (2009). Infrared thermal imaging as a
physiological access pathway: a study of the baseline
characteristics of facial skin temperatures. Physiolog-
ical measurement, 30(4):N23.
Nhan, B. R. and Chau, T. (2010). Classifying affective
states using thermal infrared imaging of the human
face. IEEE Transactions on Biomedical Engineering,
57(4):979–987.
Nozawa, A. and Tacano, M. (2009). Correlation analysis on
alpha attenuation and nasal skin temperature. Jour-
nal of Statistical Mechanics: Theory and Experiment,
2009(01):P01007.
Smith, M. E., Gevins, A., Brown, H., Karnik, A., and Du, R.
(2001). Monitoring task loading with multivariate eeg
ICINCO 2018 - 15th International Conference on Informatics in Control, Automation and Robotics
26

measures during complex forms of human-computer
interaction. Human Factors, 43(3):366–380.
Ting, C.-H., Mahfouf, M., Nassef, A., Linkens, D. A.,
Panoutsos, G., Nickel, P., Roberts, A. C., and Hockey,
G. R. J. (2010). Real-time adaptive automation system
based on identification of operator functional state in
simulated process control operations. IEEE Transac-
tions on Systems, Man, and Cybernetics-Part A: Sys-
tems and Humans, 40(2):251–262.
Torres-Salomao, L., Mahfouf, M., and El-Samahy, E.
(2015). Pupil diameter size marker for incremental
mental stress detection. In E-health Networking, Ap-
plication & Services (HealthCom), 2015 17th Interna-
tional Conference on, pages 286–291. IEEE.
Torres-Salomao, L. A., Mahfouf, M., El-Samahy, E., and
Ting, C.-H. (2017). Psychophysiologically based real-
time adaptive general type 2 fuzzy modeling and self-
organizing control of operator’s performance under-
taking a cognitive task. IEEE Trans. Fuzzy Systems,
25(1):43–57.
Walter, S., Wendt, C., B
¨
ohnke, J., Crawcour, S., Tan, J.-
W., Chan, A., Limbrecht, K., Gruss, S., and Traue,
H. C. (2014). Similarities and differences of emo-
tions in human–machine and human–human interac-
tions: what kind of emotions are relevant for future
companion systems? Ergonomics, 57(3):374–386.
Wu, H.-Y., Rubinstein, M., Shih, E., Guttag, J., Durand, F.,
and Freeman, W. (2012). Eulerian video magnifica-
tion for revealing subtle changes in the world.
Zhai, J. and Barreto, A. (2006). Stress detection in com-
puter users based on digital signal processing of non-
invasive physiological variables. In Engineering in
Medicine and Biology Society, 2006. EMBS’06. 28th
Annual International Conference of the IEEE, pages
1355–1358. IEEE.
Zhou, Y., Tsiamyrtzis, P., Lindner, P., Timofeyev, I., and
Pavlidis, I. (2013). Spatiotemporal smoothing as
a basis for facial tissue tracking in thermal imag-
ing. IEEE Transactions on Biomedical Engineering,
60(5):1280–1289.
Zhou, Y., Tsiamyrtzis, P., and Pavlidis, I. T. (2009). Tis-
sue tracking in thermo-physiological imagery through
spatio-temporal smoothing. In International Confer-
ence on Medical Image Computing and Computer-
Assisted Intervention, pages 1092–1099. Springer.
APPENDIX
Summary of two sample T test
Table 2: Overall Maximum Facial Temperature T-test Re-
sults for Experimental Session 1.
H value Phase 1 Phase 2 Phase 3 Phase 4
Phase 1 0.0000
Phase 2 1.0000 0.0000
Phase 3 1.0000 1.0000 0.0000
Phase 4 1.0000 1.0000 1.0000 0.0000
Table 3: Overall Maximum Facial Temperature T-test Re-
sults for Experimental Session 2.
H value Phase 1 Phase 2 Phase 3 Phase 4
Phase 1 0.0000
Phase 2 1.0000 0.0000
Phase 3 1.0000 1.0000 0.0000
Phase 4 1.0000 1.0000 1.0000 0.0000
Table 4: Overall Mean Nasal Temperature T-test Results for
Experimental Session 1.
H value Phase 1 Phase 2 Phase 3 Phase 4
Phase 1 0.0000
Phase 2 1.0000 0.0000
Phase 3 1.0000 1.0000 0.0000
Phase 4 0.8571 1.0000 1.0000 0.0000
Table 5: Overall Mean Nasal Temperature T-test Results for
Experimental Session 2.
H value Phase 1 Phase 2 Phase 3 Phase 4
Phase 1 0.0000
Phase 2 1.0000 0.0000
Phase 3 1.0000 1.0000 0.0000
Phase 4 1.0000 1.0000 1.0000 0.0000
Table 6: Overall Mean Forehead Temperature T-test Results
for Experimental Session 1.
H value Phase 1 Phase 2 Phase 3 Phase 4
Phase 1 0.0000
Phase 2 1.0000 0.0000
Phase 3 1.0000 1.0000 0.0000
Phase 4 1.0000 1.0000 0.8571 0.0000
Table 7: Overall Mean Forehead Temperature T-test Results
for Experimental Session 2.
H value Phase 1 Phase 2 Phase 3 Phase 4
Phase 1 0.0000
Phase 2 1.0000 0.0000
Phase 3 0.8571 1.0000 0.0000
Phase 4 1.0000 1.0000 1.0000 0.0000
Table 8: Overall DEFP T-test Results for Experimental Ses-
sion 1.
H value Phase 1 Phase 2 Phase 3 Phase 4
Phase 1 0.0000
Phase 2 0.8571 0.0000
Phase 3 0.7143 0.5714 0.0000
Phase 4 1.0000 1.0000 1.0000 0.0000
Facial Temperature Markers for Mental Stress Assessment in Human-Machine Interface (HMI) Control System
27

Table 9: Overall DEFP T-test Results for Experimental Ses-
sion 2.
H value Phase 1 Phase 2 Phase 3 Phase 4
Phase 1 0.0000
Phase 2 0.8571 0.0000
Phase 3 1.0000 1.0000 0.0000
Phase 4 0.8571 0.8571 0.8571 0.0000
Table 10: Overall HRV1 T-test Results for Experimental
Session 1.
H value Phase 1 Phase 2 Phase 3 Phase 4
Phase 1 0.0000
Phase 2 0.8333 0.0000
Phase 3 1.0000 1.0000 0.0000
Phase 4 1.0000 1.0000 1.0000 0.0000
Table 11: Overall HRV1 T-test Results for Experimental
Session 2.
H value Phase 1 Phase 2 Phase 3 Phase 4
Phase 1 0.0000
Phase 2 0.8333 0.0000
Phase 3 1.0000 0.8333 0.0000
Phase 4 1.0000 1.0000 1.0000 0.0000
Table 12: Overall HRV2 T-test Results for Experimental
Session 1.
H value Phase 1 Phase 2 Phase 3 Phase 4
Phase 1 0.0000
Phase 2 1.0000 0.0000
Phase 3 1.0000 1.0000 0.0000
Phase 4 1.0000 1.0000 1.0000 0.0000
Table 13: Overall HRV2 T-test Results for Experimental
Session 2.
H value Phase 1 Phase 2 Phase 3 Phase 4
Phase 1 0.0000
Phase 2 1.0000 0.0000
Phase 3 1.0000 1.0000 0.0000
Phase 4 1.0000 1.0000 1.0000 0.0000
Table 14: Overall TLI1 T-test Results for Experimental Ses-
sion 1.
H value Phase 1 Phase 2 Phase 3 Phase 4
Phase 1 0.0000
Phase 2 0.7143 0.0000
Phase 3 0.8571 0.8571 0.0000
Phase 4 0.8571 0.8571 0.4286 0.0000
Table 15: Overall TLI1 T-test Results for Experimental Ses-
sion 2.
H value Phase 1 Phase 2 Phase 3 Phase 4
Phase 1 0.0000
Phase 2 1.0000 0.0000
Phase 3 0.5714 0.8571 0.0000
Phase 4 1.0000 0.8571 0.8571 0.0000
Table 16: Overall TLI2 T-test Results for Experimental Ses-
sion 1.
H value Phase 1 Phase 2 Phase 3 Phase 4
Phase 1 0.0000
Phase 2 1.0000 0.0000
Phase 3 1.0000 1.0000 0.0000
Phase 4 1.0000 0.8333 0.6667 0.0000
Table 17: Overall TLI2 T-test Results for Experimental Ses-
sion 2.
H value Phase 1 Phase 2 Phase 3 Phase 4
Phase 1 0.0000
Phase 2 1.0000 0.0000
Phase 3 0.8571 1.0000 0.0000
Phase 4 1.0000 1.0000 0.8571 0.0000
Table 18: Overall PDM T-test Results for Experimental Ses-
sion 1.
H value Phase 1 Phase 2 Phase 3 Phase 4
Phase 1 0.0000
Phase 2 0.8571 0.0000
Phase 3 0.8571 1.0000 0.0000
Phase 4 1.0000 0.8333 0.6667 0.0000
Table 19: Overall PDM T-test Results for Experimental Ses-
sion 2.
H value Phase 1 Phase 2 Phase 3 Phase 4
Phase 1 0.0000
Phase 2 0.8571 0.0000
Phase 3 1.0000 0.7143 0.0000
Phase 4 0.8571 0.8571 0.8571 0.0000
ICINCO 2018 - 15th International Conference on Informatics in Control, Automation and Robotics
28
