
Clustering Big Data
Michele Ianni
1
, Elio Masciari
2
, Giuseppe M. Mazzeo
3
and Carlo Zaniolo
4
1
DIMES, University of Calabria, Rende (CS), Italy
2
ICAR-CNR, Rende (CS), Italy
3
Facebook, Menlo Park, U.S.A.
4
UCLA, Los Angeles, U.S.A.
Keywords:
Clustering, Big Data, Spark.
Abstract:
The need to support advanced analytics on Big Data is driving data scientist’ interest toward massively parallel
distributed systems and software platforms, such as Map-Reduce and Spark, that make possible their scalable
utilization. However, when complex data mining algorithms are required, their fully scalable deployment
on such platforms faces a number of technical challenges that grow with the complexity of the algorithms
involved. Thus algorithms, that were originally designed for a sequential nature, must often be redesigned in
order to effectively use the distributed computational resources. In this paper, we explore these problems, and
then propose a solution which has proven to be very effective on the complex hierarchical clustering algorithm
CLUBS+. By using four stages of successive refinements, CLUBS+ delivers high-quality clusters of data
grouped around their centroids, working in a totally unsupervised fashion. Experimental results confirm the
accuracy and scalability of CLUBS+ on Map-Reduce platforms.
1 INTRODUCTION
The current era of Big Data (Nature, 2008) has forced
both researchers and industries to rethink the compu-
tational solutions for analyzing massive data. In fact,
a great deal of attention has been devoted to the design
of new algorithms for analyzing information available
from Twitter, Google, Facebook, and Wikipedia, just
to cite a few of the main big data producers. Although
this massive volume of data can be quite useful for
people and companies, it makes analytical and re-
trieval operations really time consuming due to their
high computational cost. A possible solution relies
upon the opportunity to cluster big data in a com-
pact but still informative version of the entire data set.
Obviously, such clustering techniques should produce
clusters (or summaries) having high accuracy. Clus-
tering algorithms could be beneficial in several appli-
cation scenarios such as cybersecurity, user profiling
and recommendation systems, to cite a few. Although
all textbooks describe clustering as the quintessential
“unsupervised learning task” all the major algorithms
proposed so far require significant guidance from the
user, such as the number of clusters to be derived for
k-means++ and the termination condition for hier-
archical clustering. In (Mazzeo et al., 2017) the au-
thors proposed CLUBS
+
, a clustering algorithm that
manages to be very effective without any user guid-
ance by (i) operating in multiple stages whereby the
techniques used at one stage compensate for the short-
comings of the previous stages, and by (ii) applying
carefully selected and well-tuned criteria to assure the
quality of the results produced at each stage. In par-
ticular, the benefit of (i), is illustrated by the fact that
while over-splitting represents a very difficult issue
for most divisive algorithms, it is much less of con-
cern here, because a certain degree of over-splitting
can be tolerated since it will be undone in the succes-
sive stages that include an agglomerative step.
In this paper we present a parallel version of
CLUBS
+
, which we call CLUBS-P. Like CLUBS
+
,
CLUBS-P, scales linearly w.r.t. the size of the data
set. Furthermore, experiments show that the speed-up
increases almost linearly as more machines for run-
ning the algorithm are available. These two features
make CLUBS-P a very effective algorithm for cluster-
ing large amount of data. Finally, a nice feature of
CLUBS-P is that once the data set to be clustered has
been distributed across the available machines, there
is no need to move data, as CLUBS-P requires the ma-
chines to exchange only summary information.
We provided a new implementation of our parallel
276
Ianni, M., Masciari, E., Mazzeo, G. and Zaniolo, C.
Clustering Big Data.
DOI: 10.5220/0006858702760282
In Proceedings of the 7th International Conference on Data Science, Technology and Applications (DATA 2018), pages 276-282
ISBN: 978-989-758-318-6
Copyright © 2018 by SCITEPRESS – Science and Technology Publications, Lda. All rights reserved

clustering algorithm, based on the widely used Big
Data framework Apache Spark (Zaharia et al., 2010).
The implementation of a distributed algorithm
calls for suitable solution to some crucial problem in
a distributed programming environment such as: load
balancing and fault tolerance. A very popular solution
proposed in recent years for implementing parallel al-
gorithms tailored for Big Data is Apache Spark
1
. In-
deed, it offers very useful functions which relieves the
programmers from the explicit management of pro-
cess assignment and memory management. In this re-
spect, we implemented our CLUBS-P algorithm based
on Spark. This paper is organized as follows. In
Section 2 we provide an overview of CLUBS
+
, while
in Section 3 we first discuss the crucial points of
CLUBS
+
with a view to its parallelization, that lead
to devising CLUBS-P, for which we present a new im-
plementation based on Apache Spark (Section 4). In
Section 5 we present the experimental results and, fi-
nally, in Section 6 we draw our conclusions.
2 AN OVERVIEW OF CLUBS
+
In (Mazzeo et al., 2017) the authors introduced
CLUBS
+
. It is a parameter-free around-centroid clus-
tering algorithm based on a fast hierarchical ap-
proach, that combines the benefits of the divisive and
agglomerative approaches. The first operation per-
formed by CLUBS
+
is the definition of a binary space
partition of the domain of the dataset D, which yields
set of coarse clusters that are then refined. The next
operation is an agglomerative procedure performed
over the previously refined clusters, which is followed
by a final refinement phase. In the refinement phases,
outliers are identified and the remaining points are
assigned to the nearest cluster. In our running ex-
ample of Fig. 1, we show how the successive steps
of CLUBS
+
applied to the two-dimensional data dis-
tribution of Fig. 1(a), produce the results shown in
Fig. 1(b–e). In order to make this paper-self con-
tained, in the following we provide some details about
the four steps of CLUBS
+
allowing a full comprehen-
sion of the parallel algorithm implemented in this pa-
per, while a more exhaustive description of the algo-
rithm phases can be found in (Mazzeo et al., 2017).
The divisive step of CLUBS
+
performs a top-down
binary partitioning of the data set to isolate hyper-
rectangular blocks whose points are as much as pos-
sible close to each other: this is equivalent to mini-
mizing the within clusters sum of squares (WCSS) of
the blocks, an objective also pursued by k-means and
1
http://spark.apache.org/
many other algorithms.
Since finding the partitioning which minimizes
a measure such as the WCSS is NP-hard even for
two-dimensional points (Muthukrishnan et al., 1999),
CLUBS
+
uses a greedy approach where the splitting
hyperplanes are orthogonal to the dimension axes,
and the blocks are recursively split into pairs of clus-
ters that optimize specific clustering criteria that will
be discussed later. Given a input dataset, the algo-
rithm begins with a single cluster S corresponding to
the whole data set. S is entered into a priority queue,
Q. Q contains blocks of the partition that is iteratively
build over the dataset. While Q is not empty, a block
B is removed and split into a pair of blocks. If the
split is effective, the pairs of blocks replace B in Q,
otherwise B becomes a ‘final’ block for this phase.
In order to efficiently find the best split for a block,
the marginal distributions of the block must be com-
puted. In particular, for each dimension i of a d-
dimensional block B we must compute the functions
C
i
B
: R → N and LS
i
B
: R → R
d
, defined as follows
C
i
B
(x) =
|
p ∈ B ∧ p[i] = x
|
(1)
LS
i
B
(x) =
∑
p∈B∧p[i]=x
p (2)
where p[i] is the i-th coordinate of the point p.
These functions can be represented as maps, or, as-
suming that the coordinates of the points are integers,
as arrays. In (Mazzeo et al., 2017) the authors showed
that the split that minimizes the WCSS can be found
through a linear scan of these maps/arrays. The au-
thors conducted an extensive evaluation of the effec-
tiveness of criteria proposed in the literature for esti-
mating the quality and naturalness of a cluster set (Ar-
belaitz et al., 2013), and they concluded that the
Calinski-Harabasz index, CH-index for short, is the
most suitable to their needs (Calinski and Harabasz,
1974). Briefly, after each step, we compute the new
CH-index, and if it is increased by the split, then we
consider the split effective and continue the divisive
phase. Otherwise, we check a “local” criterion, based
on the presence of a ‘valley’ in the marginal distribu-
tion. In fact, even though a split could not decrease
the overall CH-index, a very large local discontinuity
could justify the split of a block anyway.
When the divisive phase is completed, the overall
space is partitioned into (a) blocks containing clus-
ters, and (b) blocks that only contain noise points. In
this intermediate refinement phase CLUBS
+
seeks to
achieve the objectives of (I) separating the blocks that
contain clusters from those that do not, and (II) gener-
ating well-rounded clusters for the blocks in the pre-
vious group.
Clustering Big Data
277
G
H
F
E
D
C
B
A
1
2
3
4
5
6
7
8
9
10
11
12
G
I
F
E
D
C
B
A
J
K
L
M
H
G
H
F
E
D
C
B
A
I
(a) (b) (c)
G
H
F
E
D
C
B
A
G
H
F
E
D
C
B
A
(d) (e)
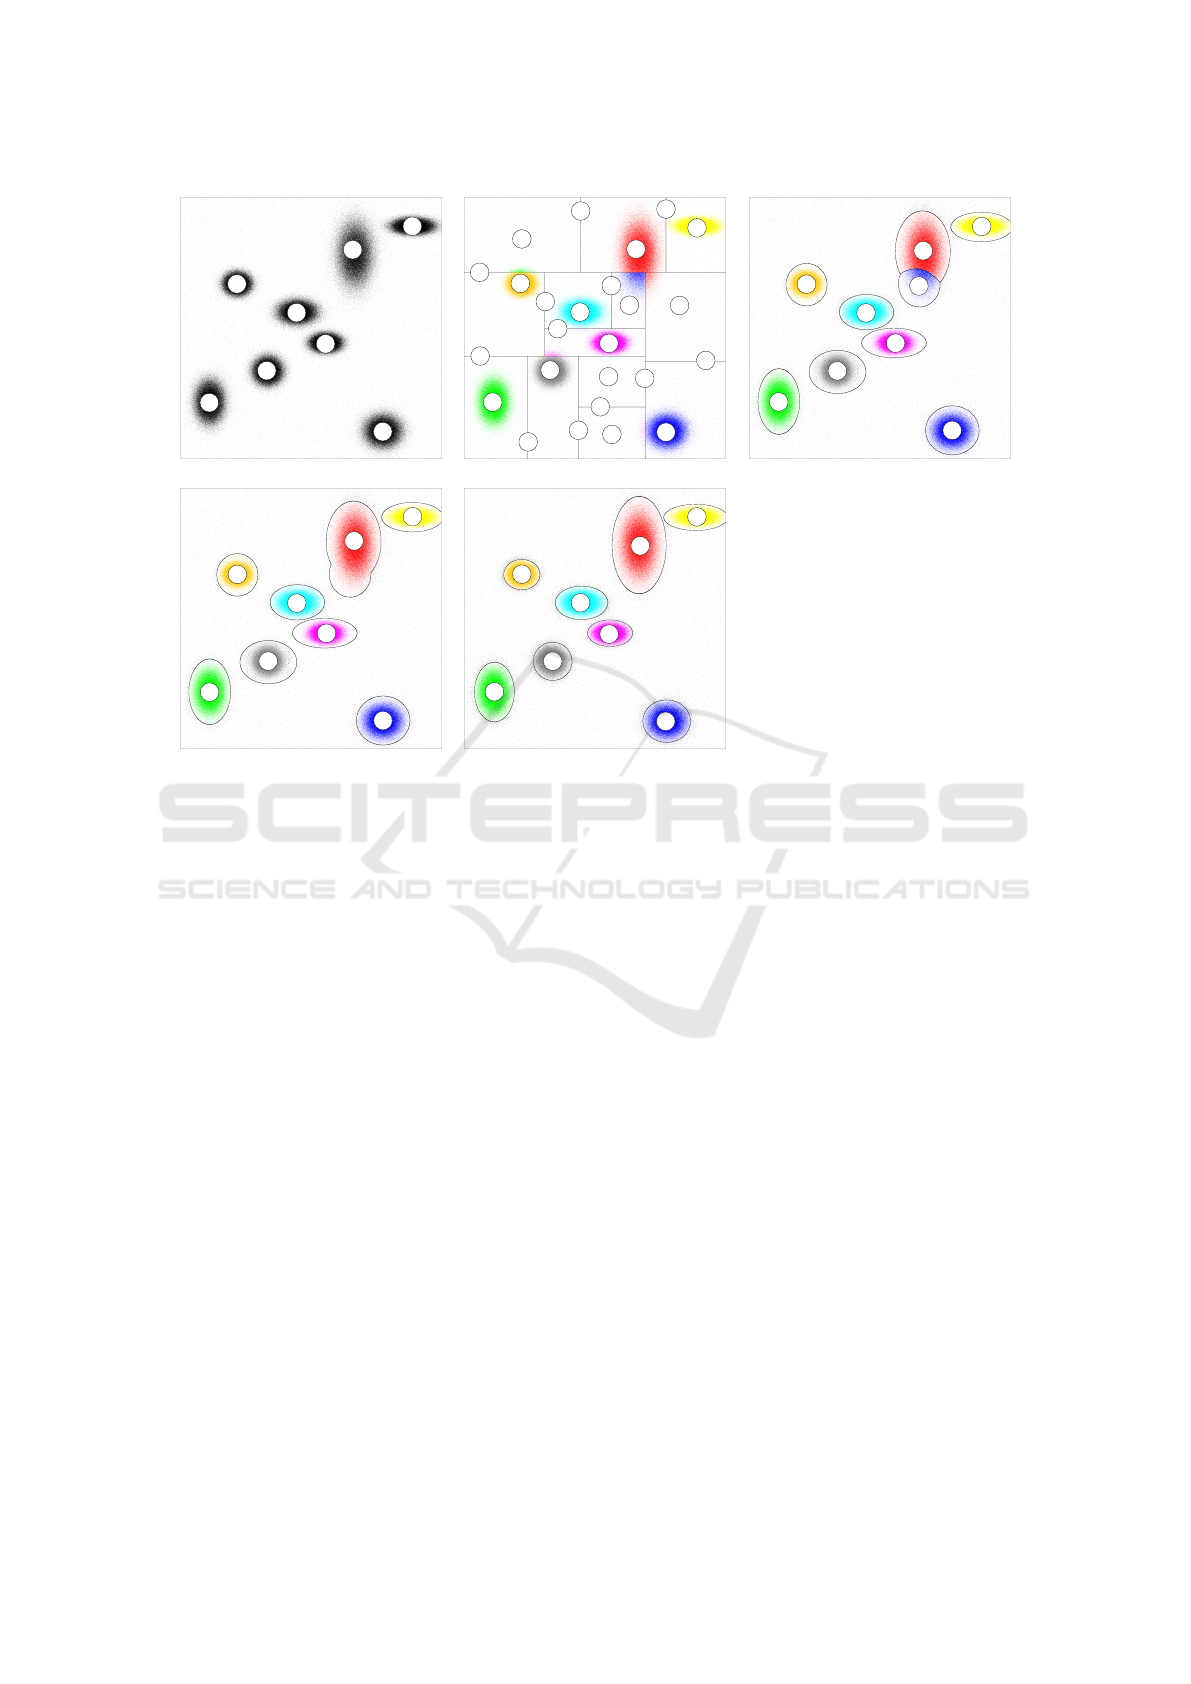
Figure 1: A two-dimensional data set with 8 clusters (a), its partitioning after the divisive step (b), the intermediate refinement
(c), the agglomerative step (d), and the final refinement (e).
Task (I) is performed by using the observation that
(a) the density of blocks containing only noise is low,
and (b) the density of such blocks is rather uniform
because of the random nature of noise.
For instance, these tests applied to our running ex-
ample in Fig. 1(b) have classified blocks “J”, “K”, “L”
and “M” as outlier-blocks.
Once, the cluster-blocks have been found, we can
now proceed with task (II).
This step produces well-rounded clusters that re-
store the natural clusters that might have been shaved-
off by rigid partitioning scheme leveraged in the
divisive step. For instance, the block of data in
Fig. 1(b), which contains the points of the cluster “E”
in Fig. 1(a), contains also some points of the original
cluster “F” which is now reassembled about its cen-
troid.
In the agglomerative step, the clusters produced
by the previous step are merged whenever this im-
proves the overall clustering quality. The process of
merging is symmetric to that of splitting: at each step
we find the pair of clusters whose merge produces
the least increase of WCSS and, if CH-index resulting
from their merge increases, the merge is actually per-
formed by replacing the two clusters by their union. If
we determine that merging these two clusters will de-
crease the CH-index, the merge is not performed and
the whole agglomerative phase ends, since no merg-
ing of other cluster pair can improve CH-index.
Fig. 1(d) shows that the the cluster “B” is obtained
as the merge of the clusters “B” and “I” of Fig. 1(c).
The agglomerative step is a very fast step, as does
not require to access data, since it is based only on
previously computed summary information.
The agglomerative step often produces clusters of
slightly irregular shapes due to the approximate and
greedy criteria used in the previous steps. For in-
stance, Fig. 1(d) shows that cluster “B” has been ob-
tained by merging clusters “B” and “I” of Fig. 1(c).
The evident asymmetry is due to the fact that the
block “K” of Fig. 1(b) has been considered an outlier-
block during the intermediate refinement, and the
points at its upper-left corner have been asymmetri-
cally adsorbed (due to their different position and ra-
dius) by blocks “B” and “I”.
The final refinement step improves the quality of
clusters and also identifies the final outlier points.
The algorithm used to perform final refinement is
basically the same as the one used for task (II) of the
intermediate refinement (see (Mazzeo et al., 2017)
for further details).
DATA 2018 - 7th International Conference on Data Science, Technology and Applications
278

3 CLUBS-P: THE
PARALLELIZATION OF CLUBS
+
We now analyze the steps of CLUBS
+
with the aim of
pointing out the issues to be tackled in order to paral-
lelize its execution.
We assume that n workers (i.e., different ma-
chines) with equivalent hardware features are avail-
able. The workers are coordinated by a master ma-
chine. The dataset is distributed over the worker
nodes that store locally a portion of the dataset, which
can be, for instance stored, in a distributed file system,
or even previously split over the local file systems of
the machines.
It is quite intuitive that the critical operations that
can benefit from the availability of multiple workers
are those requiring to access the original data: 1) com-
putation of the marginal distributions during the divi-
sive phase; 2) computation of the local density of out-
lier blocks candidates during the intermediate refine-
ment; 3) assignment of points to the closest centroid
during the refinement phases;
The parallelization of the operations above is dis-
cussed in the following. The other operations, which
involves computations on summary information, in-
stead, can be handled by the master, using the same
approach as in the original version of CLUBS
+
.
3.1 Parallel Computation of the
Marginal Distributions
As remarked in previous section, the computation of
the marginal distributions, more specifically of the
vectors C and LS, is the only operation that requires
to access the data during the divisive step. This opera-
tion can be efficiently performed in parallel thanks to
the associativity and commutativity of the sum and
count operations, which are the only mathematical
operations involved in the computation. Therefore,
given a block partition of the data B, {B
1
,...B
k
},
those vectors can be independently computed on each
B
i
(thus in parallel) and the vector for the whole block
B can be obtained by simply summing the vectors ob-
tained on all the B
i
. According to the Map-Reduce
paradigm, each block B
i
is mapped to a set of pairs
of vectors, representing its C and LS for each dimen-
sion, and these vectors are subsequently reduced by
summing vectors of the same dimension.
3.2 Parallel Computation of the Local
Density of the Blocks
The local density of blocks has to be computed in or-
der to evaluate the criterion used for Task II of the
intermediate refinement. After the master has the list
of the blocks resulting from the divisive phase, it also
has their ranges and their global density. In order to
check if the local density around the centroid of each
block is significantly higher than the global density, it
computes the boundaries of a small range around the
centroid (i.e., a range of size 1/10 of the whole block
range), and then coordinates the parallel computation
of the count of the points falling in each of these ‘re-
stricted’ ranges. Even in this case, the only mathe-
matical operation involved in the computation is sum,
thus the operation is perfectly parallelizable. In fact,
for each portion of data of a block, it is possible to in-
dependently compute the count of points laying in the
restricted range, and then the overall count is simply
given by the sum of the partial counts. This count al-
lows the master to compute the local density, and thus
apply the criterion described above.
3.3 Parallel Assignment of the Points to
the Clusters
The assigment of the points to the clusters, or their
classification as outliers, is an operation performed
in both the refinement steps. Each worker can per-
form this operation independently on the others. The
master, which has the summary information about the
clusters, needs to send to every worker the informa-
tion needed to compute the distance between points
and clusters. After the computation, the same infor-
mation must be updated by the master, since the clus-
ter assignment of some points is likely to change. To
this end, each node can compute the summary infor-
mation for its data, and then, again, the master can
simply obtain the global values of the new centroids,
number of points per cluster, and cluster radius, after
summing up all the values obtained from the workers.
We presented the general ideas on which our ‘ab-
stract’ algorithm CLUBS-P is based for the paral-
lelization of CLUBS. In the following, we propose
a new implementation of this algorithm, using the
Apache Spark. The implementation is available as
open source software
2
.
4 CLUBS-P MEETS SPARK: CLUBS
?
The implementation of a distributed algorithm re-
quires a lot of effort for solving specific issues related
to the problem, but also general issues for distributed
computing, such as load balancing and fault toler-
ance. Nowadays, a very popular framework for im-
2
https://github.com/gmmazzeo/clubspark
Clustering Big Data
279

plementing parallel algorithms tailored for Big Data
is Apache Spark
3
. As a matter of fact, it offers
very useful functions which relieves the programmers
from the burden of handling the general issues of dis-
tributed computing.
For sake of brevity, we will mention here only the
Spark’s features that are relevant to our scope. The
main data structure used by Spark is Resilient Dis-
tributed Dataset (RDD). An RDD is a read-only, par-
titioned collection of records. Spark’s API allows the
definition of custom functions in order to manipulate
RDD when implementing our algorithm.
Two of the core Spark’s functions, working on an
RDD according to the the map-reduce paradigm, are
the following: a) mapPartitions: RDD returned by
mapPartitions is obtained by transforming each parti-
tion of the source RDD as specified by a user-defined
function; b) reduce: RDDs are aggregated in pairs by
using a user-defined function that must be commuta-
tive and associative in order to perform the reduction
step in parallel.
As described in Section 3, the operations that
CLUBS-P performs on data are commutative and as-
sociative, therefore we can safely adopt Spark for im-
plementing our algorithm, that we call CLUBS
?
.
Since the computation of marginal distributions is
the most expensive operation and the most interest-
ing, from a technical point of view, in the following
we provide in Algorithm 1 the details of its imple-
mentation using Spark.
Algorithm 1: Marginal Distribution Computation.
Input: D: RDDhPointi representing points in a block B.
Output: Marginal distribution for B.
1: RDDhMaphDouble, Integeri[]i mc ←
D.mapPartitions(new CMapper());
2: MaphDouble, Integeri[] C ← ms. reduce(new
CReducer());
3: RDDhMaphDouble, Double[]i[]i mls ←
data.mapPartitions(new LSMapper());
4: MaphDouble, Double[]i[] LS ← mls. reduce(new
LSReducer());
5: return C, LS;
Lines 1–2 compute the C function over the in-
put data, for every dimension. More specifically,
line 1, computes this function for the data of each
worker, through our object CMapper, which simply
scans the data of the worker, updating a counter for
each possible coordinate of each dimension. Then,
line 2 aggregates the partial counts, using the object
CReducer. The computation of LS functions is per-
formed by lines 3–4. The object LSMapper is similar
3
http://spark.apache.org/
to CMapper, but instead of updating counters, it up-
dates arrays representing the sum of points. The same
holds for the object LSReducer.
In the following, we report a simple example that
clarifies how map-reduce paradigm is applied by the
algorithm.
Example 1. Consider a toy dataset consisting of 9
points partitioned over 2 nodes as follows::
part
1
= {(4,4),(5,7),(5, 8),(5, 4),(6,4)}
and
part
2
= {(2,7),(2,5),(3, 6),(5, 7)}
The results of the mapping operations (lines 1 and
3) for each node and each dimension are reported in
Table 1.
Table 1: Results of the map operations.
part
1
dim 1
coord 4 5 6
mc 1 3 1
mls (4, 4) (15, 19) (6, 4)
dim 2
coord 4 7 8
mc 3 1 1
mls (15, 12) (5, 7) (5, 8)
part
2
dim 1
coord 2 3 5
mc 2 1 1
mls (4, 12) (3, 6) (5, 7)
dim 2
coord 5 6 7
mc 1 1 2
mls (2, 5) (3, 6) (7, 14)
For instance, the points in partition 1 that have
coordinate of dimension 2 equal to 4 are the fol-
lowing: (4,4), (5,4), and (6, 4). Therefore, for the
dimension 2 and coordinate 4 mc is 3, and mls is
(4,4)+(5,4) + (6,4) = (15,12).
The results of the reducing operations (lines 2 and
4) for each dimension are reported in Table 2.
Table 2: Results of the reduce operations.
dim 1
coord 2 3 4 5 6
C 2 1 1 4 1
LS (4, 12) (3, 6) (4, 4) (20, 26) (6, 4)
dim 2
coord 4 5 6 7 8
C 3 1 1 3 1
LS (15, 12) (5, 2) (3, 6) (12, 21) (5, 8)
For instance, consider the coordinate 5 of dimen-
sion 1. C is obtained as 3 + 1 = 4, and LS as
(15,19)+(5,7) = (20, 26).
5 EXPERIMENTAL RESULTS
As mentioned above, CLUBS-P shares the ideas of
CLUBS
+
. Since the clustering obtained by CLUBS-
P for a given data set is the same that obtained by
DATA 2018 - 7th International Conference on Data Science, Technology and Applications
280
40
400
1 2 4 8 16
Execution time (s)
N. of workers
CLUBS* Sensitivity to dataset size
10
7
10
8
10
9
40
400
1 2 4 8 16
Execution time (s)
N. of workers
CLUBS* Sensitivity to dimensionality
2
4
8
16
(a) (b)
40
400
1 2 4 8 16
Execution time (s)
N. of workers
CLUBS* Senstivity to number of clusters
2
8
32
80
400
1 2 4 8 16
Execution time (s)
N. of workers
CLUBS* Sensitivity to noise
0.01
0.05
0.1
(c) (d)
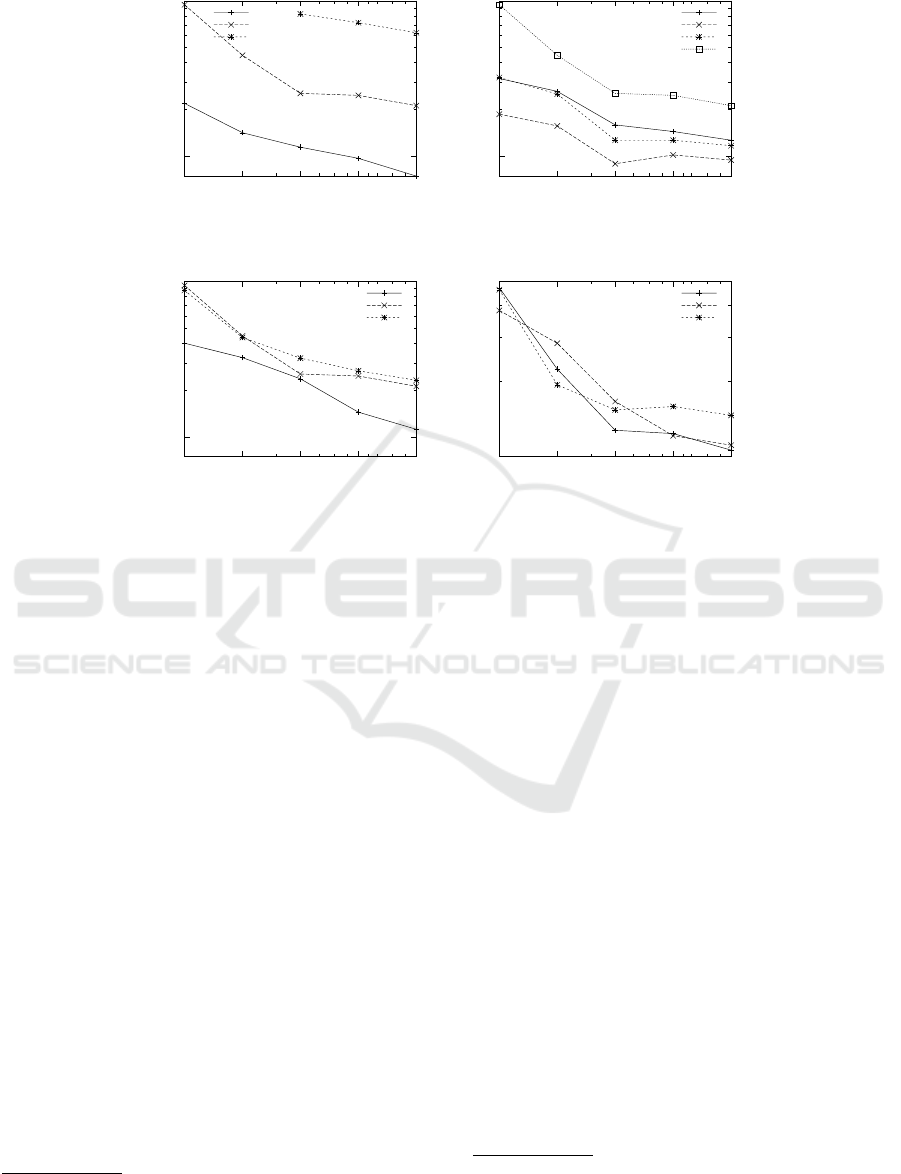
Figure 2: CLUBS
?
Execution Times vs number of workers varying dataset size (a), data dimensionality (b), number of
clusters (c), and noise ratio (d).
CLUBS, we can say that the accuracy of CLUBS-P is
the same as that of CLUBS. The latter has been proven
to be better than that of existing algorithms (CLUBS,
), and, thus, we do not report accuracy results here,
for space limitation and because our goal is rather
to prove the effectiveness of the parallelization of
CLUBS
+
in order to apply it in the Big Data scenario.
We tested our parallel implementation on several syn-
thetic datasets obtained by means of an open source
synthetic data generator
4
, which generates data distri-
butions where each cluster follows a possibly differ-
ent gaussian distribution, while noise points are ran-
domly added. We generated datasets with 10
7
, 10
8
and 10
9
points. For each dataset size, we varied the
dimensionality in the range [2..16] and the number of
clusters in the range [2..32]. Finally, in order to test
the robustness of our algorithm w.r.t. noise, we added
a number of randomly distributed points ranging be-
tween 0 and 0.1 times the total number of points. Ex-
periments were executed on a cluster having 16 com-
puting machines (100GB RAM available each). As
previously said, our implementations, according to
Reproducible Research (RR) policy are publicly avail-
able
5
. We studied the running times obtained using 1,
4
https://github.com/gmmazzeo/clugen
5
https://github.com/gmmazzeo/clubspark
2, 4, 8, or 16 workers
6
, varying one data parameter
at a time, while maintaining constant the other ones.
The non-varying parameters, in each experiment were
set as 10
8
points, 16 dimensions, 32 clusters, and 0.1
noise ratio.
In the following, we report the results obtained us-
ing CLUBS
?
.
5.1 Evaluating CLUBS
?
In this section, we report the performances obtained
using CLUBS
?
in the same experimental setting,
which are depicted in Figure 2. We found that the per-
formances obtained by using the Spark-based imple-
mentation are less stable than expected, this is proba-
bly due to the fact that Spark uses some random shuf-
fling of data which we can not control. Furthermore,
with Spark assigning a given portion of the data set to
each node is not achievable as the actual physical dis-
tribution of data among workers can not be controlled.
In general, we found a good speedup for 2 and 4 work-
ers, while the speedup is reduced when the number of
workers is further increased. This is probably due to
6
We ran one worker per different machine of the cluster,
thus, the number of workers and machines here are the
same.
Clustering Big Data
281

the overhead introduced by the Spark framework. In
terms of sensitivity to the data parameters, from the
experimental results we can observe that the speedup
of CLUBS
?
is not affected by the data dimensional-
ity and noise ratio (the absolute running time, instead,
is affected by dimensionality, as expected). For the
sensitivity to the number of clusters, the speedup is re-
duced when the number of clusters increases, because
the divisive phase is the phase requiring the most net-
work communication, and its duration increases with
the number of clusters.
6 CONCLUSIONS
In this paper we discussed CLUBS-P, an algorithm for
around-centroid clustering for Big Data. We evalu-
ated a new implementation of CLUBS-P, in order to
perform a kind of feasibility analysis w.r.t. the big
data setting. The results obtained show a very good
scalability of the algorithm.
REFERENCES
Arbelaitz, O., Gurrutxaga, I., Muguerza, J., P
´
eRez, J. M.,
and Perona, I. n. (2013). An extensive comparative
study of cluster validity indices. Pattern Recognition,
46(1):243–256.
Calinski, T. and Harabasz, J. (1974). A dendrite method
for cluster analysis. Communications in Statistics -
Theory and Methods, 3(1):1–27.
CLUBS. Clubs+ website. http://yellowstone.cs.ucla.edu/
clubs/. Accessed: 2016-03-25.
Mazzeo, G. M., Masciari, E., and Zaniolo, C. (2017). A
fast and accurate algorithm for unsupervisedclustering
around centroids. Information Sciences, 400.
Muthukrishnan, S., Poosala, V., and Suel, T. (1999). On
rectangular partitionings in two dimensions: Algo-
rithms, complexity, and applications. In ICDT, pages
236–256.
Nature (2008). Big data. Nature.
Zaharia, M., Chowdhury, M., Franklin, M. J., Shenker,
S., and Stoica, I. (2010). Spark: Cluster comput-
ing with working sets. In Proceedings of the 2Nd
USENIX Conference on Hot Topics in Cloud Comput-
ing, HotCloud’10, pages 10–10, Berkeley, CA, USA.
USENIX Association.
DATA 2018 - 7th International Conference on Data Science, Technology and Applications
282
