
Multimodal Classification of Sexist Advertisements
Francesca Gasparini, Ilaria Erba, Elisabetta Fersini and Silvia Corchs
Department of Informatics, Systems and Communication, University of Milano-Bicocca, Milan, Italy
Keywords:
Image Classification, Multimodal Classification, Sexist Advertising, Text Analysis.
Abstract:
Advertisements, especially in online social media, are often based on visual and/or textual persuasive mes-
sages, frequently showing women as subjects. Some of these advertisements create a biased portrays of
women, finally resulting as sexist and in some cases misogynist. In this paper we give a first insight in
the field of automatic detection of sexist multimedia contents, by proposing both a unimodal and a multi-
modal approach. In the unimodal approach we propose binary classifiers based on different visual features
to automatically detect sexist visual content. In the multimodal approach both visual and textual features are
considered. We created a manually labeled database of sexist and non sexist advertisements, composed of
two main datasets: a first one containing 423 advertisements with images that have been considered sexist (or
non sexist) with respect to their visual content, and a second dataset comprising 192 advertisements labeled
as sexist and non sexist according to visual and/or textual cues. We adopted the first dataset to train a visual
classifier. Finally we proved that a multimodal approach that considers the trained visual classifier and a tex-
tual one permits good classification performance on the second dataset, reaching 87% of recall and 75% of
accuracy, which are significantly higher than the performance obtained by each of the corresponding unimodal
approaches.
1 INTRODUCTION
Advertisements nowadays are more and more heavily
based on surrounding messages of persuasion, espe-
cially making use of women as subjects. It is highly
probable, especially in online social media, to look at
an advertising with a female subject involved where
the woman is portrayed in a highly sexualized man-
ner with little connection to the brand being adver-
tised (Zimmerman and Dahlberg, 2008). This type
of communication, together with even more aggres-
sive contents, can ultimately end up in misogynistic
advertising.
Among the communication methods related to the
advertising domain, both the image and the accom-
panying text, can encode several forms of sexism.
Among them, we can highlight the most prevalent
ones (Plakoyiannaki et al., 2008; Poland, 2016):
• Stereotype: women are typically portrayed as a
good wives mainly concerned with tasks of house-
keeping (see Figure 1(a));
• Objectification: women are presented as sex ob-
jects, even if sex is unrelated to the promoted
product (see Figure 1(b));
• Dominance: the advertisement depicts women as
(a) Stereotype (b) Objectification (c) Dominance
Figure 1: Graphical examples Stereotype, Objectification
and Dominance in advertisements.
physically or mentally dominated by men (see
Figure 1(c)).
These communication tools are detrimental to so-
ciety because of the creation of biased portrays of
women, resulting in unhealthy social and physical
habits. Detecting, and taking actions against these
forms of sexism, would demonstrate to women that
they are valued in society. However, to the best of our
knowledge, no research has been conducted in the lit-
erature to automatically detect sexist advertisements,
neither analyzing the visual components nor the tex-
tual cues.
The problem of identifying misogynist language
in online social media has recently attracted signifi-
Gasparini, F., Erba, I., Fersini, E. and Corchs, S.
Multimodal Classification of Sexist Advertisements.
DOI: 10.5220/0006859403990406
In Proceedings of the 15th International Joint Conference on e-Business and Telecommunications (ICETE 2018) - Volume 1: DCNET, ICE-B, OPTICS, SIGMAP and WINSYS, pages 399-406
ISBN: 978-989-758-319-3
Copyright © 2018 by SCITEPRESS – Science and Technology Publications, Lda. All rights reserved
399
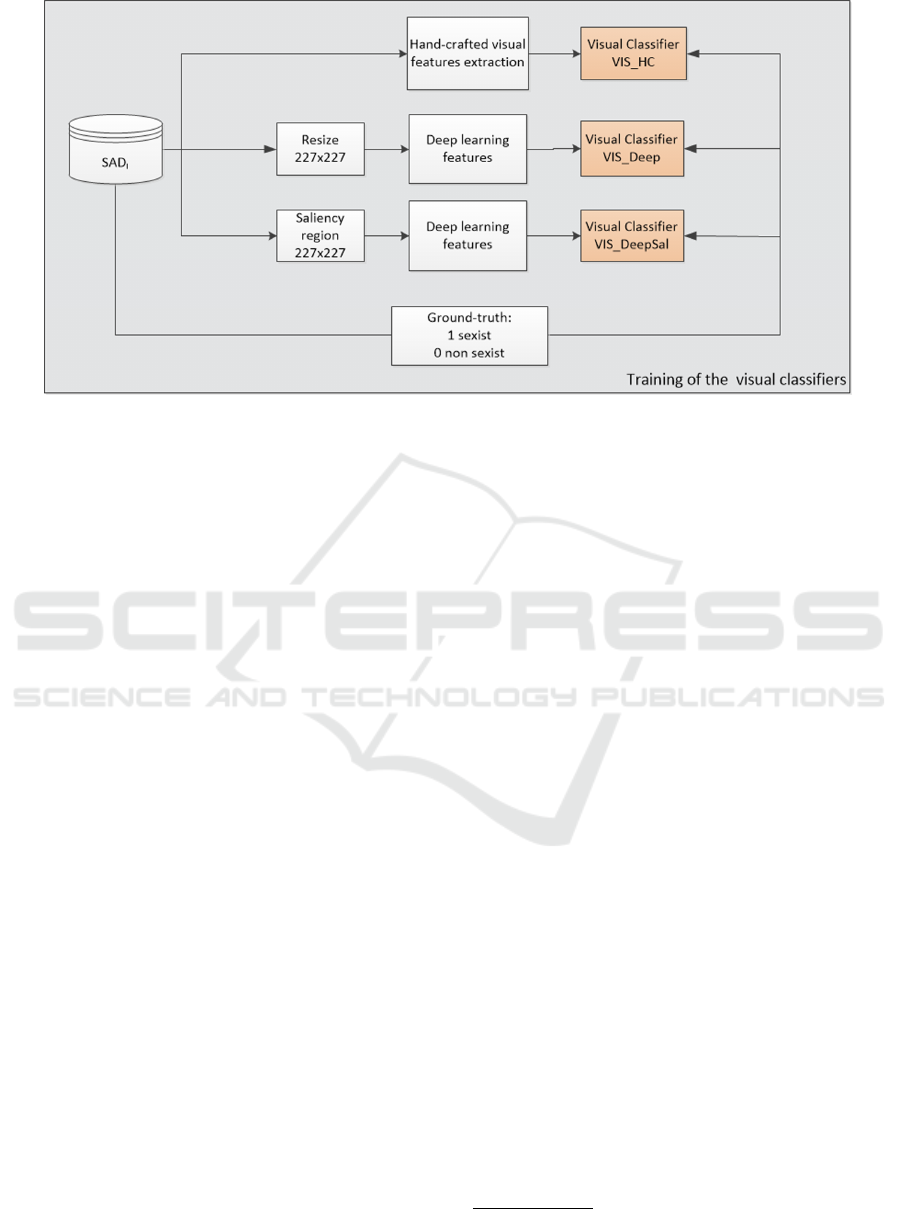
Figure 2: The three unimodal (visual) classifiers trained on the SAD
I
database.
cant attention. Social networks need to update their
policy to address this issue and due to the high vol-
ume of texts shared daily, the automatic detection of
misogynist and sexist text content is required. How-
ever, the problem of automatic misogyny identifica-
tion from a linguistic point of view is still in its early
stage. In particular, trivial statistics about the usage of
misogynystic language in Twitter have been provided
in (Hewitt et al., 2016), while in (Anzovino et al.,
2018) a first tentative of defining linguistic features
and machine learning models for automatically rec-
ognizing this phenomenon has been presented.
From the visual point of view, great efforts in
the literature were devoted in defining appropriate fil-
ters to automatically detect digital pornographic im-
ages from non-pornographic ones. These filters are
mainly based on color features and geometric rela-
tions of different body parts in naked skin regions
(Ries and Lienhart, 2014; Zaidan et al., 2013). Auto-
matic recognition of pornographic Web pages has also
been considered. In particular classification strate-
gies that consider text and image features have been
proposed (Hu et al., 2007), showing that a fusion of
text and image classification results outperforms uni-
modal classifiers. The improvement in classification
performance adopting multimodal features has also
been demonstrated recently by Corchs et al.(Corchs
et al., 2017). In their work, integrating visual and tex-
tual information permits to increase the performance
of emotion classification of social images.
In order to give a first insight in the field of auto-
matic detection of sexist multimedia content, and tak-
ing into account the promising classification results
of multimodal approaches, several contributions are
proposed in this work:
• A unimodal classifier based only on visual fea-
tures to automatically detect sexist visual content;
• A multimodal approach where both visual and
texture features are analyzed to classify sexist ad-
vertisements;
• SAD
I
: An image dataset of 423 advertisements
1
,
which have been considered sexist (or non sex-
ist) with respect to the visual content. Up to our
knowledge, this dataset is the first resource avail-
able in the literature concerned with sexist adver-
tisements;
• SAD
IT
: A dataset of 192 advertisements1] with
sexist (and non sexist) contents labeled consider-
ing the visual and/or textual aspects. This dataset
includes both images and related texts.
The paper is organized as follows. In section 2, the
proposed unimodal and multimodal approaches for
recognizing sexist advertisements are introduced. In
section 3, the feature space derived for characterizing
both visual and linguistic features associated to ad-
vertisements is described. In section 4, the proposed
database of sexist advertisements is presented. In sec-
tion 5 experimental results are reported. Finally, in
section 6 conclusions and future work are discussed.
2 CLASSIFICATION APPROACH
Staring from the SAD
I
dataset we first tackle the task
of classifying sexist contents from the visual point of
view. The visual features considered for this issue
1
The proposed dataset will be made available at publi-
cation time.
SIGMAP 2018 - International Conference on Signal Processing and Multimedia Applications
400
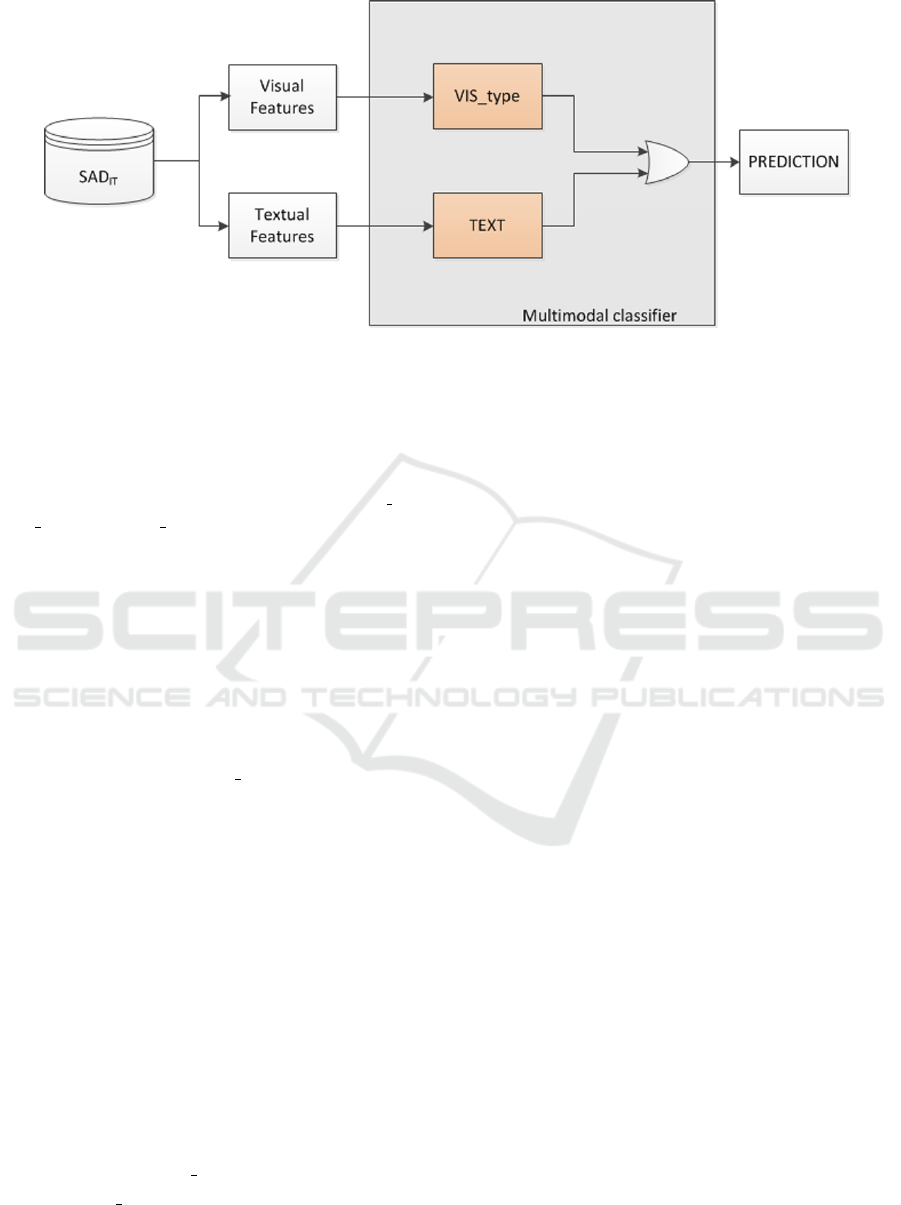
Figure 3: Multimodal classifier defined for the SAD
IT
database.
are both hand-crafted and deep ones. We extract the
deep features with two different strategies: from a re-
sized version of the input images and from the most
salient region of them. In this way we train three dif-
ferent visual classifiers, labeled respectively V IS HD,
V IS Deep, and V IS DeepSal, as reported in Figure 2.
As unimodal classification models, we here consider
and compare three state of the art models of classi-
fier: Nearest Neighbor (NN), Decision Tree (DT), and
Support Vector Machine (SVM).
Concerning the advertisements of the SAD
IT
dataset, they are classified from both the visual and
textual point of view combining a visual classifier and
a textual one, following a late fusion approach. In this
case, as visual classifier, we consider and compare
each of the three ones obtained in the training phase,
as depicted in Figure 2, (VIS type, where type={HC,
Deep, DeepSal}). For what concerns the textual con-
tents, we adopt a classifier trained not on advertise-
ments, but using social network misogynist contents
(Anzovino et al., 2018). In particular, we exploited
a model trained on Twitter messages collected ac-
cording to three main strategies: (1) using a set of
representative keywords that are likely associated to
sexist contents, (2) monitoring potential victims and
(3) downloading the timeline tweets given by selected
misogynist users. The model was trained by using
both misogynistic and non-misogynistic texts (manu-
ally labeled), and exploiting the feature set presented
in section 3.2. For the SAD
IT
dataset, we employed
a late fusion approach, depicted in Figure 3, where
the final classification C
j
of the j
th
advertisement is
obtained as follows:
C
j
= V IS type
j
∨ T EX T
j
(1)
where VIS type
j
is the class assigned by the visual
classifier considered, and T EX T
j
is the class assigned
by the textual classifier.
3 FEATURE SPACE
3.1 Visual Features
To define our visual classifier we adopt both hand-
crafted visual features, as well as a deep learning rep-
resentation.
3.1.1 Hand-crafted Visual Features
We consider several hand-crafted visual features try-
ing to take into account from low level to high level
properties of visual content.
• Low level, grayscale features: Coarseness, Con-
trast, Directionality, Linelikeness, Roughness,
(Tamura et al., 1978), Edge density (Mack and
Oliva, 2004), Entropy (Schettini et al., 2010),
Measure of Enhancement (Schettini et al., 2010),
Local Binary Pattern (LBP) (Ojala et al., 1996),
and Histogram of Oriented Gradients (HoG), de-
veloped by Ludwig et al. (Junior et al., 2009).
All these features are 1-Dimensional (1-D), ex-
cept LBP (2891-D) and HoG (1296-D).
• Low level colored Features: Chroma Variance (1-
D) (Ciocca et al., 2016), Number of Regions (1-
D) (Comaniciu and Meer, 2002), Colorfullness
(1-D) (Hasler and Suesstrunk, 2003), Color His-
togram in the HSV color space (32-D), color sim-
ple statistics (mean and standard deviation) in the
RGB color space, (6-D), Auto-correlogram ob-
tained quantizing the RGB color space in 64 col-
ors, (64-D).
• Photographic, and aestetic features, and features
related to visual perception: Feature Congestion
and Subband Entropy (Rosenholtz et al., 2007),
image complexity (Corchs et al., 2016), a measure
Multimodal Classification of Sexist Advertisements
401

of the degree of focus (Minhas et al., 2009), all
of them 1-D and a 113-D aesthetic feature vector
(Bhattacharya et al., 2013).
• Features related to semantic concepts: a percent-
age of skin measure (Gasparini et al., 2008) and
the number of faces (Viola and Jones, 2001).
The size of the hand-crafted feature vector is 4418.
3.1.2 Deep Visual Features
We extract a 4096-D feature vector from the last fully-
connected layer, L7 of the pre-trained CNN AlexNet
(Krizhevsky et al., 2012), without any fine tuning. We
used the open-source deep learning library MatCon-
vNet (Vedaldi and Lenc, 2015). This net requires in-
put images of 227x227 pixels. In this work we con-
sider two strategies to get this input size: a direct re-
size on the input image, and a strategy that resized the
most salient region. The salient regions are obtained
binarizing the saliency map (Itti and Koch, 2001).
3.2 Textual Features
A sexist language can be represented by several fea-
tures that can be extracted from the text enclosed into
the advertisements. In particular, the following subset
of features, initially introduced in (Anzovino et al.,
2018), have been considered:
• N-grams: we considered both character n-grams
and token n-grams, according to their forms as un-
igrams, bigrams and trigrams.
• Syntactic: we considered Bag Of Part Of Speech,
i.e. unigrams, bigrams and trigrams of Part of
Speech tags extracted from the text contained in
the advertisement;
• Metadata: such as the number of adjectives, per-
sonal pronouns, adverbs and possessive pronouns;
• Embedding: we created a high level representa-
tion of words contained into the advertisements
using a model pre-trained on short text
2
. The
purpose of this type of feature is to represent the
text of an advertisement as the average representa-
tion of all its words derived through the word2vec
model (Mikolov et al., 2013).
The size of the textual feature vector is 142371.
2
https://www.fredericgodin.com/software/
(a) (b)
Figure 4: Sexist advertisements belonging to the SAD
IT
database, where the sexist aspect is mainly related to one
of the two contents: visual (a), or text (b).
4 SAD: THE SEXIST
ADVERTISEMENT DATABASE
Our SAD database is composed of two different
datasets:
• SAD
I
: a dataset of 423 images of advertisements,
215 labeled as sexist images and the remaining
208 labeled as non-sexist ones. The sexist images
have been downloaded from an Italian Facebook
group: La pubblicit
´
a sessista offende tutti (Sexist
advertisement hurts everybody)
3
. The images la-
beled as sexist were chosen among those validated
by the members of this group. The non-sexist im-
ages were downloaded from another Italian Face-
book group: Pubblicit
´
a creative e bizzarre (Cre-
ative and bizarre advertisements)
4
.
• SAD
IT
: a dataset of 192 advertisements where
both images and related texts have been down-
loaded. Within this dataset there are 107 sexist
advertisements, and 85 non sexist ones. The 107
images are considered sexist either from the vi-
sual or textual point of view. Some of them are
considered sexist from both these points of view
together. The sexist advertisements were down-
loaded from the web using as keywords: “sexist
ads”, “woman objectification”, “misogynyst ads”.
The non-sexists ones were also downloaded from
the web and were chosen and validated by the au-
thors of the paper.
Some example of sexist advertisements are re-
ported in Figure 5. It is important to highlight that
there are advertisements where the visual content
can be considered sexist (see Figure 4(a)), while
the related text is neutral, while other show a neu-
tral visual content, but contains a related sexist
text (see Figure 4(b)). Examples of non sexist ad-
vertisements are depicted in Figure 6.
3
https://www.facebook.com/groups/
pubblicitasessistaoffende/about/
4
https://www.facebook.com/pubblicitacreativebizzarre
SIGMAP 2018 - International Conference on Signal Processing and Multimedia Applications
402
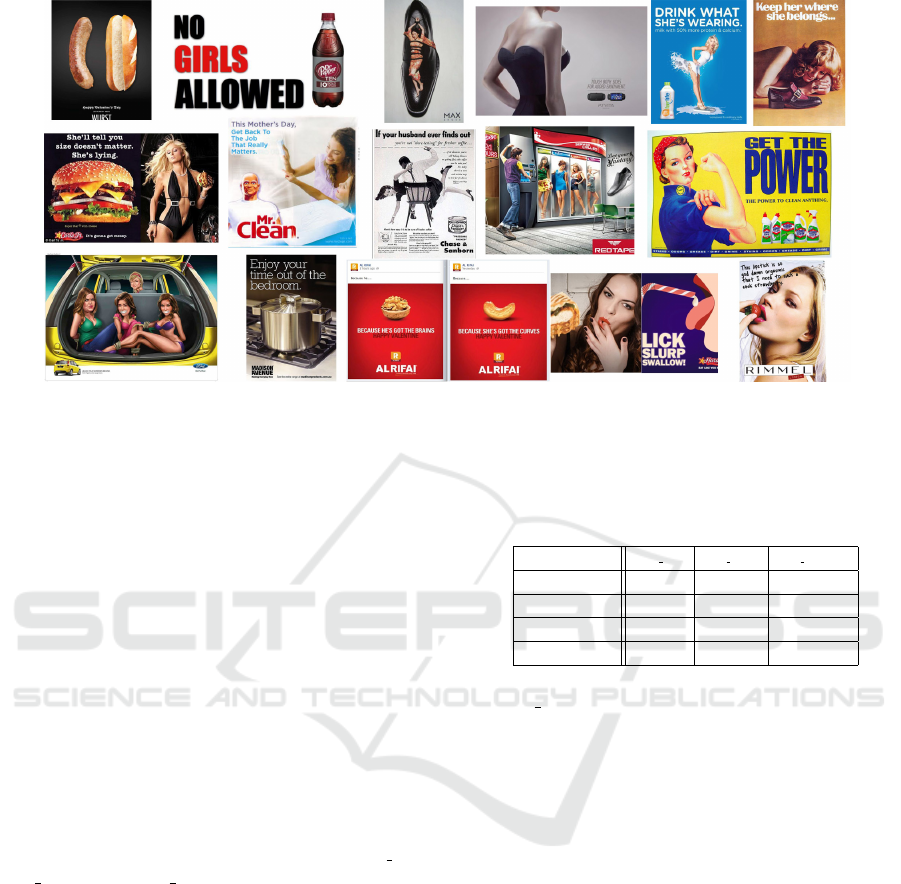
Figure 5: Examples of sexists advertisement belonging to the SAD
IT
database. Sexism can be related to the visual and/or
textual content.
5 EXPERIMENTAL RESULTS
We here consider the results of the two different clas-
sification tasks addressed in this work. First we ana-
lyze the classification performance of the three visual
classifiers here proposed (unimodal classification), to
automatically detect sexist visual content in advertise-
ments. Then we evaluate the performance of the mul-
timodal classification of advertisements that are sexist
in terms of text and/or visual content.
5.1 Unimodal Classification: Visual
Content
We trained the three different visual classifiers de-
scribed in Section 2 and depicted in Figure 2, on
the SAD
I
database. For each of them, V IS HD,
V IS Deep, and V IS DeepSal, we considered three
classifier models: NN, DT, and SVM and we eval-
uated the classification performance on the training
dataset applying a five-fold cross validation strategy
on these models, varying their parameters (number of
neighbors for the k-NN, with the euclidean distance,
pruning strategies for DT, and different kernels for
SVM). We report the results in terms of accuracy, re-
call, precision and f-measure (i.e. the harmonic mean
of recall and precision), with respect to the sexist class
(positive class).
For all the three visual classifiers the best model in
terms of f-measure is SVM with a radial basis func-
tion kernel. In Table 1 we report the performance of
this model for each of the three types of visual fea-
tures considered.
Table 1: Classification performance in terms of Accuracy
(%), Precision (%), Recall (%) and F-measure (%) obtained
by the best performing model (SVM), for each of the three
types of visual classifiers on the training dataset.
VIS HC VIS Deep VIS DeepSal
Accuracy 72.10 78.72 80.85
Precision 70.46 73.86 79.91
Recall 77.67 82.79 83.26
F-measure 73.9 78.07 81.55
VIS DeepSal is the best visual classifier on the
training set, with respect to all the performance mea-
sures considered. It is not surprising that deep
features extracted from a pre-trained net permit to
achieve a high classification performance even in
classification task not related to the one of the orig-
inal net. It has been demonstrated by Razavian et al.
(Sharif Razavian et al., 2014) that generic of-the-shelf
CNN representation achieves better results in several
computer vision classification tasks than other hand-
crafted visual features. Evaluating the deep features
on the most salient region instead of on the whole im-
age, seems to increase the classification performance.
5.2 Multimodal Classification: Visual
and Textual Content
We here report the results of the classification on the
SAD
IT
dataset, applying our multimodal classification
strategy depicted in Figure 3, compared with the per-
formance of the unimodal classifiers. Table 2 sum-
marizes these results in terms of accuracy (%), recall
(%), precision (%) and f-measure (%), with respect to
the sexist class.
Multimodal Classification of Sexist Advertisements
403
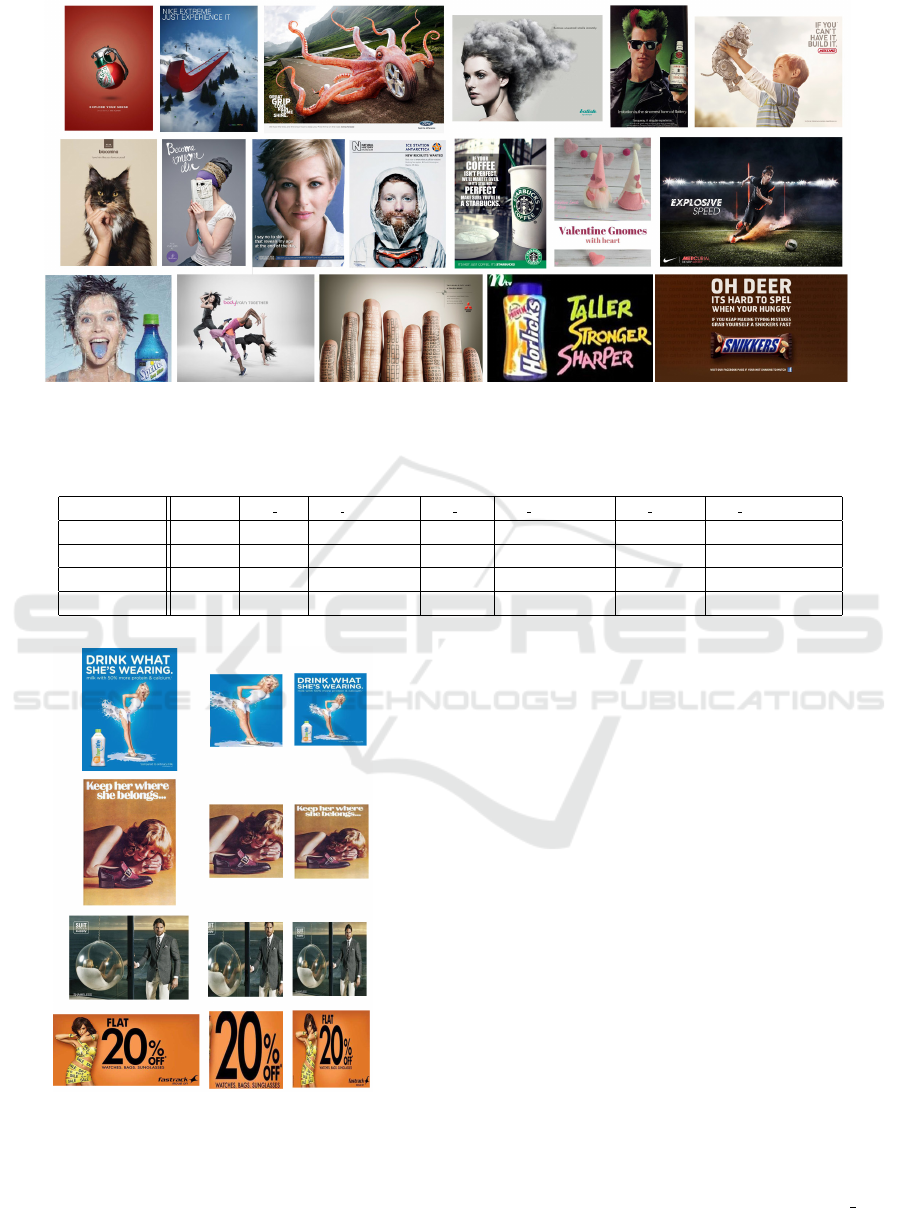
Figure 6: Examples of non sexist advertisement belonging to the SAD
IT
database. In this case neither the visual content nor
the textual one are considered sexist.
Table 2: Performance of the different classifiers on the SAD
IT
dataset, in terms of Accuracy (%), Precision (%), Recall (%)
and F-measure (%).
TEXT VIS HC VIS HC ∨ TEXT VIS Deep VIS Deep ∨ TEXT VIS DeepSal VIS DeepSal ∨ TEXT
Accuracy 61.86 65.63 67.19 69.79 68.23 68.23 67.19
Precision 72.00 68.47 65.94 69.92 66.43 69.83 65.94
Recall 50.47 71.03 85.05 80.37 86.92 75.70 85.05
F-measure 59.34 69.72 74.29 74.78 75.30 72.65 74.29
Figure 7: First column: original images; second column:
corresponding most salient regions; third column: resam-
pling of the original images. Observe that in some cases the
most salient region corresponds to a significant portion of
the original image (first and second rows), in some cases it
is more or less equivalent (third row), while in other cases
the extracted region does not provide adequate visual infor-
mation (last row).
In the first column the performance of the uni-
modal text classifier is reported. We want to remark
that this classifier was previously trained on a differ-
ent classification task, by using both misogynistic and
non-misogynistic texts from Twitter messages. How-
ever its performance when applied to detect sexist text
in advertisements shows the highest precision when
compared with all the other classifiers here consid-
ered.
To better evaluate the performance of the uni-
modal approaches on the SAD
IT
dataset we should
recall that the elements of this dataset do not necessar-
ily are contemporaneously sexist for both visual and
textual contents, while the label of the classes are as-
signed in presence of at least one of the two contents.
The multimodal classifiers always increase the perfor-
mance in terms of recall and f-measure, when com-
pared with the corresponding unimodal ones, while
keeping high value of accuracy. Moreover, the con-
tribution of the text classifier reduces the differences
in performance adopting different visual features, in
particular comparing hand-crafted versus deep ones.
The best classifier in terms of recall (86.92%) and
f-measure (75.30%) is obtained combining VIS Deep
with TEXT. The deep features extracted on the most
salient region do not permit on this dataset an im-
SIGMAP 2018 - International Conference on Signal Processing and Multimedia Applications
404

provement in classification performance. An analysis
of the salient regions extracted on images belonging
to the SAD
IT
dataset is reported in Figure 7. In this
Figure, original images (left column) are compared
with the corresponding salient regions (central col-
umn) and the resided version of the original images
(right column). The first two rows represent images
where the salient regions extracted significantly corre-
spond to the salient visual content. Instead for images
with a high dominance of text (fourth row) the salient
region could not be related to the visual content, ex-
tracting prevalently the text. Finally for several im-
ages, the salient region is more or less equivalent to
the original image itself (third row). This analysis can
justify the small differences, in terms of performance,
obtained on this dataset by applying the two different
deep strategies.
6 CONCLUSIONS
Considering the task of classifying the sexist con-
tent of advertisements, we have proved that a multi-
modal approach that considers both visual and textual
features permits good classification performance es-
pecially when compared with unimodal approaches.
To best of our knowledge this is the first work that
deals with this task. Within this context we provide
a dataset of advertisements with images and text that
will be available to the research community. Starting
from the promising results here obtained, significant
improvements can be reached with further analysis.
In particularly, we plan to increase the dataset of both
images and texts, and we plan to train a textual clas-
sifier on a more specific task. To automatically ex-
tract the texts, we plan to investigate different ocr, in
fact within this preliminary analysis, texts have been
manually extracted. The extraction of more signifi-
cant salient regions in presence of text should also be
investigated. Finally, other strategies to obtain a mul-
timodal classification will be investigated, consider-
ing both early fusion and late fusion approaches.
ACKNOWLEDGEMENTS
We gratefully acknowledge the support of NVIDIA
Corporation with the donation of the Tesla K40 GPU
used for this research.
REFERENCES
Anzovino, M., Fersini, E., and Rosso, P. (2018). Automatic
Identification and Classification of Misogynistic Lan-
guage on Twitter. In 23rd International Conference on
Natural Language & Information Systems.
Bhattacharya, S., Nojavanasghari, B., Chen, T., Liu, D.,
Chang, S.-F., and Shah, M. (2013). Towards a com-
prehensive computational model foraesthetic assess-
ment of videos. In Proceedings of the 21st ACM inter-
national conference on Multimedia, pages 361–364.
ACM.
Ciocca, G., Corchs, S., and Gasparini, F. (2016). Ge-
netic programming approach to evaluate complexity
of texture images. Journal of Electronic Imaging,
25(6):061408–061408.
Comaniciu, D. and Meer, P. (2002). Mean shift: A robust
approach toward feature space analysis. Pattern Anal-
ysis and Machine Intelligence, IEEE Transactions on,
24(5):603–619.
Corchs, S., Fersini, E., and Gasparini, F. (2017). Ensemble
learning on visual and textual data for social image
emotion classification. International Journal of Ma-
chine Learning and Cybernetics, pages 1–14.
Corchs, S. E., Ciocca, G., Bricolo, E., and Gasparini,
F. (2016). Predicting complexity perception of real
world images. PloS one, 11(6):e0157986.
Gasparini, F., Corchs, S., and Schettini, R. (2008). Recall
or precision-oriented strategies for binary classifica-
tion of skin pixels. Journal of electronic imaging,
17(2):023017–023017.
Hasler, D. and Suesstrunk, S. E. (2003). Measuring col-
orfulness in natural images. In Electronic Imaging
2003, pages 87–95. International Society for Optics
and Photonics.
Hewitt, S., Tiropanis, T., and Bokhove, C. (2016). The
problem of identifying misogynist language on twit-
ter (and other online social spaces). In Proceedings of
the 8th ACM Conference on Web Science, pages 333–
335. ACM.
Hu, W., Wu, O., Chen, Z., Fu, Z., and Maybank, S. (2007).
Recognition of pornographic web pages by classify-
ing texts and images. IEEE transactions on pattern
analysis and machine intelligence, 29(6):1019–1034.
Itti, L. and Koch, C. (2001). Computational modelling of vi-
sual attention. Nature reviews neuroscience, 2(3):194.
Junior, O. L., Delgado, D., Gonc¸alves, V., and Nunes, U.
(2009). Trainable classifier-fusion schemes: An ap-
plication to pedestrian detection. In Intelligent Trans-
portation Systems, 2009. ITSC’09. 12th International
IEEE Conference on, pages 1–6. IEEE.
Krizhevsky, A., Sutskever, I., and Hinton, G. E. (2012). Im-
agenet classification with deep convolutional neural
networks. In Advances in neural information process-
ing systems, pages 1097–1105.
Mack, M. and Oliva, A. (2004). Computational estimation
of visual complexity. In the 12th Annual Object, Per-
ception, Attention, and Memory Conference.
Mikolov, T., Sutskever, I., Chen, K., Corrado, G. S., and
Dean, J. (2013). Distributed representations of words
Multimodal Classification of Sexist Advertisements
405

and phrases and their compositionality. In Advances in
neural information processing systems, pages 3111–
3119.
Minhas, R., Mohammed, A. A., Wu, Q. J., and Sid-Ahmed,
M. A. (2009). 3d shape from focus and depth map
computation using steerable filters. In International
Conference Image Analysis and Recognition, pages
573–583. Springer.
Ojala, T., Pietik
¨
ainen, M., and Harwood, D. (1996). A com-
parative study of texture measures with classification
based on featured distributions. Pattern recognition,
29(1):51–59.
Plakoyiannaki, E., Mathioudaki, K., Dimitratos, P., and Zo-
tos, Y. (2008). Images of women in online advertise-
ments of global products: does sexism exist? Journal
of Business Ethics, 83(1):101.
Poland, B. (2016). Haters: Harassment, Abuse, and Vio-
lence Online. U of Nebraska Press.
Ries, C. X. and Lienhart, R. (2014). A survey on visual
adult image recognition. Multimedia tools and appli-
cations, 69(3):661–688.
Rosenholtz, R., Li, Y., and Nakano, L. (2007). Measuring
visual clutter. Journal of vision, 7(2):17–17.
Schettini, R., Gasparini, F., Corchs, S., Marini, F., Capra,
A., and Castorina, A. (2010). Contrast image cor-
rection method. Journal of Electronic Imaging,
19(2):023005–023005.
Sharif Razavian, A., Azizpour, H., Sullivan, J., and Carls-
son, S. (2014). Cnn features off-the-shelf: an as-
tounding baseline for recognition. In Proceedings of
the IEEE Conference on Computer Vision and Pattern
Recognition Workshops, pages 806–813.
Tamura, H., Mori, S., and Yamawaki, T. (1978). Textu-
ral features corresponding to visual perception. Sys-
tems, Man and Cybernetics, IEEE Transactions on,
8(6):460–473.
Vedaldi, A. and Lenc, K. (2015). Matconvnet – convolu-
tional neural networks for matlab. In Proceeding of
the ACM Int. Conf. on Multimedia.
Viola, P. and Jones, M. (2001). Rapid object detection using
a boosted cascade of simple features. In Computer Vi-
sion and Pattern Recognition, 2001. CVPR 2001. Pro-
ceedings of the 2001 IEEE Computer Society Confer-
ence on, volume 1, pages I–I. IEEE.
Zaidan, A., Karim, H. A., Ahmad, N., Zaidan, B., and Sali,
A. (2013). An automated anti-pornography system us-
ing a skin detector based on artificial intelligence: A
review. International Journal of Pattern Recognition
and Artificial Intelligence, 27(04):1350012.
Zimmerman, A. and Dahlberg, J. (2008). The sexual objec-
tification of women in advertising: A contemporary
cultural perspective. Journal of Advertising Research,
48(1):71–79.
SIGMAP 2018 - International Conference on Signal Processing and Multimedia Applications
406
