
Optimized Detection of Hypoglycemic Glucose Ranges in
Human Serum by Raman Spectroscopy with
532 nm Laser Excitation
Ata Golparvar
1,* a
, Assim Boukhayma
1,2
, Christian Enz
1
and Sandro Carrara
1
1
Integrated Circuit Laboratory, École Polytechnique Fédérale de Lausanne (EPFL), CH-2002 Neuchâtel, Switzerland
2
Senbiosys SA, CH-2002 Neuchâtel, Switzerland
Keywords: Blood Plasma, Continuous Monitoring, Glucometer, Glucose Monitoring, Human Serum Analysis,
Non-invasive, Raman Effect, Vibrational Spectroscopy.
Abstract: Raman scattering-based biomedical detection has usually been proposed with near-infrared laser sources.
However, a low-cost CMOS imager’s quantum efficiency is optimum around green wavelength, and their
sensitivity substantially decreases in near-infrared wavelengths. Additionally, since Raman scattering
intensity is proportional to λ
-4
, where λ is the laser wavelength, the increase of wavelength directly results in
less sensitive measurement. These facts contribute to limiting the transfer of detection methodologies based
on Raman spectroscopy to portable and low-cost point-of-care medical devices. Therefore, here we propose
532 nm green laser-induced Raman spectroscopy for low human serum glucose level detection. However, in
532 nm Raman spectroscopy of carotenoid containing biological systems, such as human serum, resonance
Raman occurs, and total carotenoids resonance bands dominate the spectra. To demonstrate serum glucose
detection on concentration levels typical in severe hypoglycemic ranges, this study optimizes laser focal depth,
laser excitation duration, and laser power to extend the sensitivity by exploiting the glucose Raman shift peak
at 1125 ± 7.5 cm
–1
. By applying experimentally tuned parameters, our findings suggest sensitive detection of
serum glucose in the range of 0–10 mmol/l with 1.2 mmol/l theoretical limit of detection (LOD) by using
spontaneous (non-enhanced) Raman spectroscopy.
1 INTRODUCTION
The number of diabetes patients has increased
significantly (B. Zhou et al., 2016), and “diabetes
management” has been a severe public health burden
expected to double by 2030 compared to 2015
statistics (Bommer et al., 2018). Diabetes mellitus is
a chronic disorder that impairs glucose homeostasis
(Chege, Birech, Mwangi, & Bukachi, 2019). To
survive, diabetic patients must prevent its severe
secondary complications by frequent monitoring to
keep the glucose level under control through adequate
insulin injection (Zimmet, Alberti, & Shaw, 2001).
To monitor blood glucose levels reliably, patients
depend on frequent finger-prick tests to draw out
capillary blood, which is painful and inconvenient
with the potential cross-contamination risk when the
a
https://orcid.org/0000-0002-1107-6380
* Corresponding author
lancet is reused or not properly sterilized (Ju et al.,
2020). Additionally, finger pricking is closely related
to diabetes burnout—a state of detachment from
diabetic care (Zimmet et al., 2001), directly related to
diabetes-induced morbidity and mortality (Abdoli,
Hessler, Vora, Smither, & Stuckey, 2020). Therefore,
optical detection techniques have been proposed for
non-invasive glucose monitoring and reviewed
extensively (Smith, 2015). Among them, Raman
spectroscopy holds great potential thanks to its high
specificity due to the unique chemical “fingerprint”
signature of inelastic scattering of photons from each
specific analyte (Singh, Goh, Canzoneri, & Ram,
2015). Furthermore, it promises an excellent
alternative for rapid, label‐free, and non-invasive
detection in biomedical applications (Lawson, Barry,
Williams, & Edwards, 1997), such as continuous
glucose concentration monitoring in human tissue
158
Golparvar, A., Boukhayma, A., Enz, C. and Carrara, S.
Optimized Detection of Hypoglycemic Glucose Ranges in Human Serum by Raman Spectroscopy with 532 nm Laser Excitation.
DOI: 10.5220/0010981300003121
In Proceedings of the 10th International Conference on Photonics, Optics and Laser Technology (PHOTOPTICS 2022), pages 158-165
ISBN: 978-989-758-554-8; ISSN: 2184-4364
Copyright
c
2022 by SCITEPRESS – Science and Technology Publications, Lda. All rights reserved

due to its water-insensitive probing (Gulyamov et al.,
2021; Kang et al., 2020). Raman effect occurs when
a molecule interacts with an incident photon and is
driven to a virtual state. With a slim chance the
molecule relaxes to a vibrational state other than the
original ground state, due to the quantum energy
exchange with the incident photon and the molecule’s
vibrational modes, dictated by their unique energy
difference (Krishnan & Shankar, 1981).
Although spontaneous Raman offers a small
scattering cross-section, it is still more robust for
glucose level estimation than other absorption-based
vibrational spectroscopy techniques due to the
water’s inadequate scattering response but high
absorbance signature (Li, Deen, Kumar, &
Selvaganapathy, 2014). However, since Raman
scattering is a weak process, its application to low
glucose concentration (i.e., below 5 mmol/l) detection
is problematic and to perform such measurements,
often long acquisition time or high laser powers are
needed. On the other hand, to enhance the Raman
effect, which may indeed lower the measurement’s
required acquisition time and laser power, techniques
such as plasmonic surface enhancement, resonance
Raman exploitation, and non-linear coherent process
have been suggested over the years (Kiefer, 2007; Li
et al., 2014). Even though surface enhancement is
most effective with metallic nanoparticle surfaces, the
subcutaneous injection of metallic materials can
produce toxicity (Asharani, Wu, Gong, &
Valiyaveettil, 2008) and require surgical implant
placement (Stuart et al., 2006), which removes the
technique from the non-invasive application. On the
other hand, resonant Raman spectroscopy usually
requires a low wavelength in ultra-violate ranges for
the excitation laser. However, such low wavelengths
hold risks of photochemical damage to the tissue
being investigated (Mhlanga, Tetyana, Nyembe, &
Sikhwivhilu, 2021), and thus this hinders the
technique from the non-invasive application as well.
Nonetheless, coherent Raman scattering might be
favored in the light of newly emerged technologies on
the side of cheap and low noise CMOS image sensors
(Boukhayma, 2018).
Even though spontaneous Raman has not been
primarily considered for low glucose level detection,
mainly due to the expressed reasons, we propose
spontaneous Raman spectroscopy to address the need
to improve the sensitivity toward low concentration
range. In fact, in the absence of any Raman
enhancement, the excitation laser wavelength
selection is perhaps the most critical design
parameter. In particular, Raman scattering intensity is
proportional to λ
-4
, where λ is the laser wavelength
(Šugar & Bouř, 2016). Due to that, 532 nm green laser
is theoretically 4.7 times more efficient than 785 nm
near-infrared laser and theoretically 16 times better
efficiency than a 1064 nm infrared laser source. Of
course, blue or violate lasers are even better than
green lasers, but they are still costly (Greer, Petrov, &
Yakovlev, 2013), and the quantum efficiency of low-
cost silicon-CMOS imagers decays rapidly below the
green wavelengths (Boukhayma, Peizerat, & Enz,
2016).
Recent investigations have shown that human
serum does not produce strong autofluorescence to
completely mask the Raman spectra in the visible
range with 532 nm green lasers and can be filtered out
using the available chemometric tools, different from
what is observed already with 660 nm red laser
(Medipally et al., 2017). Thus, acquiring 532 nm is
highly advantageous for improving the intensity of
the Raman scattering measurement. Furthermore, a
532 nm laser choice is optimum due to the highest
quantum efficiency of the CMOS imagers in the
green wavelengths (Wróbel, 2016), and therefore a
much better solution from the perspective of portable
Raman devices for glucose sensing. To succeed on
that, we need to consider the interference by
carotenoids, which resonance Raman shift is at 1153
cm
-1
, extremely close to that of the glucose that shows
its characteristic band around 1125 cm
-1
. Therefore,
this study deeply investigated the possible
optimizations on laser focal depth, laser excitation
duration, and laser power to optimize especially for
serum glucose levels in severe hypoglycemic ranges
by exploiting the Raman shift peak of 1125 ± 7.5 cm
–
1
with spontaneous and non-enhanced Raman
spectroscopy.
2 METHODOLOGY
2.1 Sample Preparation
D-(+)-glucose powder (C
6
H
12
O
6
, purity ≥ 99.5%) and
human serum solution (male AB plasma, sterile-
filtered, stored in -20 °C) were purchased from
Sigma-Aldrich (MilliporeSigma, MO, USA).
Reagents were analytical grade and were used as
received. Glucose stock solutions with concentrations
of 200 mmol/l and 100 mmol/l (25 ml each) were
prepared to dilute and spike the serum’s glucose
concentration to various amounts to explore the
dynamic range and sensitivity of the measurements.
The powder was carefully measured with a highly
precise scale and wholly dissolved in nanopure water.
The concentrations were selected to cover a wide
Optimized Detection of Hypoglycemic Glucose Ranges in Human Serum by Raman Spectroscopy with 532 nm Laser Excitation
159

range of human blood serum glucose levels to
simulate normal and unstable conditions (i.e.,
hypoglycemia or hyperglycemia) as well as to more
extensive concentration ranges (up 100 mmol/l) to the
straightforward demonstration of the detection
principle. Hypoglycemia was defined as a blood
glucose level smaller than 3.9 mmol/l (70 mg/dl),
whereas hyperglycemia was identified when it is
above 10 mmol/l (180 mg/dl) (Brinati et al., 2021).
Therefore, glucose stock solutions were diluted to
prepare 1.5 mL spiked serum solutions (0.75 mL
glucose mixed with 0.75 mL serum) with overall
glucose concentrations of 1–10 mmol/l (18–180
mg/dl) and 20-100 mmol/l (360–1800 mg/dl) with
intervals of 1 mmol/l and 20 mmol/l, respectively,
and were refrigerated overnight. Each sample was
first stirred during the measurement session, and then
a 20-μl droplet of each liquid was placed into a
concave glass microscope slides with well depths of
~ 800 μm (Electron Microscopy Sciences PA, USA)
using a micropipette (Gilson International, France).
2.2 Data Acquisition and Optimization
In the backscattered configuration, the Raman spectra
of human serum solutions were obtained with
confocal micro-Raman microscopy (LabRAM HR,
Horiba, Japan), exploiting the spectral region of 200–
1900 cm
–1
using a liquid-nitrogen-cooled CCD
camera. The excitation source was a 532 nm single-
frequency green laser (Cobolt 05, Hubner Photonics,
Germany). Different laser powers varying from 0.4
mW to 400 mW and different acquisition durations
changing from 10 s to 180 s were tested to optimize
the best sensitivity within the fastest acquisition time
for low glucose level detection in human serum. To
further optimize the Raman scattering intensity, the
filtered beam was focused to the surface as well as to
the 200 μm, 400 μm, and 600 μm below the surface
of the droplet using a long working distance ×50
objective lens with NA of 0.50 (LMPLFLN, Olympus
Corporation, Japan). The beam quality was M2 < 1.1,
beam diameter (1/e²) at the objective input was 2 mm,
and objective lens focal length was 180 mm. The
spectrometer was adjusted to groove density of 600
g/mm, the slit size of 100 μm, and the confocal hole
size of 200 μm. Higher grating values increase the
spectral resolution while decreasing spectral
coverage, and larger slit and confocal hole size
increase the intensity at the cost of spectral resolution
(F Adar, Lee, Mamedov, & Whitley, 2010; Tuschel,
2020). The spectral resolution of this univariate
analysis study is critical since the targeted glucose
1125 cm
-1
band is essentially a single shoulder peak.
Therefore, the spectral resolution should be high
enough to identify the main Raman peak of interest
by the nearby prominent carotenoids resonance 1153
cm
-1
peak. At the same time, Raman scattering
intensity is crucial to obtain high sensitivity in low
concentration levels. Therefore, we decided to select
a configuration to maintain a fair balance between
spectral resolution and Raman intensity. Calibration
of the spectrometer was carried with 520 cm
–1
characteristic peak of silicon. Three consecutive
spectra were obtained using different droplets to
compute the measurement error, and no photodamage
or photo-degradation was observed. Throughout the
experiments, the room was dark, and 24°C was
maintained.
All data processing was performed with Origin
(OriginLab Corporation, MA, USA). For each
spectrum, the autofluorescence induced baseline was
subtracted using the asymmetric least-square fit
(asymmetric factor 0.001, threshold 0.02, smoothing
factor 5, and iteration 10), then the Savitzky-Golay
filter (polynomial order 3, window length 13) was
applied to smooth the spectrum further (Zimmet et al.,
2001). The absolute area under the Raman shift peak
of 1125 ± 7.5 cm
–1
was integrated to perform the
univariate analysis and predict the serum glucose
level, and linear regression fit was used to draw the
calibration curve and calculate the measurement
sensitivity.
3 RESULTS AND DISCUSSION
Figure 1a illustrates the processed Raman scattering
spectra of human serum spiked with glucose, pure
aqueous glucose, and pure serum solutions. The
intensities of Raman scattering bands are directly
proportional to the concentration of solution analytes,
and for aqueous glucose, this is typically observed in
multiple peaks around 437, 518, 1060, 1125, and
1365 cm
–1
bands (Figure 1a, blue line) (Wang,
Mizaikoff, & Kranz, 2009). It has previously been
reported that selecting the spectral region of 1030 to
1400 cm
−1
improves the sensitivity for the glucose
prediction model (Parachalil et al., 2019). However,
our previous study shows that only the 1125 cm
–1
band is sensitive enough for pathophysiologically
relevant low glucose level detection and other peaks
are highly disrupted below 5 mmol/l. Thus we
concluded that univariate data analysis can preferred
over multivariate analysis (Golparvar et al., 2021).
The glucose Raman shift peak of 1125 cm
–1
has been
assigned to C-O-H bonds’ bending mode or C-O-C
bonds’ antisymmetric stretching mode (Dudek et al.,
PHOTOPTICS 2022 - 10th International Conference on Photonics, Optics and Laser Technology
160

Figure 1: (a) Processed (i.e., background subtracted and
smoothed) 532 nm green laser-induced Raman scattering
spectra of spiked human serum with 100 mmol/l glucose
(red line), human serum without glucose spike (green line),
and 100 mmol/l glucose aqueous solution (blue line). The
Raman spectrum of the mixture (serum + glucose) consists
of the superposition of the individual spectrum of each
solution (red line). Laser power and acquisition time were
adjusted to 200 mW and 1 minute, respectively.
Characteristic peaks of glucose (blue bands) and serum
(green bands) are highlighted. (b) The calibration curve for
glucose concentration prediction is computed by the area
under the curve at 1125 ± 7.5 cm
–1
; three consecutive
measurements return the standard deviation error bars.
2019; Fujihara, Nishimoto, Yasuda, & Takeshita,
2019). Although our previous study is based on
measurement acquired only on water-based solutions
(not human serum), it is imperative to address the
issue of measuring low concentrations in serum
successfully. On the other hand, when induced by a
785 nm near-infrared laser, the strongest serum
Raman bands in the fingerprint region appear around
820, 1044, 1335, 1383, 1442, and 1542 cm−1, and
they are widely associated with CH2 and CH3 groups
(i.e., lipids and proteins) (Huang et al., 2011).
However, when human serum is excited by a 532 nm
green laser, the Raman peaks of α- and β-carotenes,
which in total their concentration is only a few
hundred nmol/l in blood serum, resonate and
dominate the spectrum (Figure 1a, green line) (Bohn,
2018; Medipally et al., 2017).
Typically, if the laser excitation frequency is
close to the frequency of the electronic transition of a
molecule, resonance Raman occurs and enhances the
otherwise spontaneous Raman effect (Schmitt &
Popp, 2006). This well-known phenomenon is
traditionally used to study molecules in extremely
low concentrations (X. Zhou et al., 2019).
Carotenoids’ electronic absorption band is
anticipated to be between 400 nm and 550 nm, and
thus, 532 nm laser energy lies close enough to its
electronic transition to trigger the resonance Raman
effect (Fran Adar, 2017). However, in serum glucose
detection, this is an unwanted enhancement and the
very stable 1153 cm
−1
resonant Raman band of total
carotenoids interferes with the targeted glucose 1125
cm
–1
band. Although for univariate analysis of high
glucose levels (10–100 mmol/l), this is not an issue,
and the calibration curve is linearly fit with an R
2
value of 0.99 and sensitivity of ~ 242 counts/mM, in
lower glucose levels (1–8 mmol/l), the detection is
limited. In high glucose concentrations, the 1125 cm
–
1
peak is strong and distinguishable as same as the
1153 cm
−1
peak (Figure 1a, red line), but when the
intensity of glucose 1125 cm
–1
peak decreases due to
the decrease in concentration, it becomes a shoulder
peak to the 1153 cm
−1
and
completely vanishes below
~ 8 mmol/l. As a result, the measurement should go
through specific optimizations to detect low serum
glucose levels with 532 nm green laser-induced
spontaneous Raman spectroscopy.
The optimal focus depth of the laser beam in the
solutions affects the number of received inelastically
scattered photons and can be tuned to increase
detection sensitivity (Dubessy, Lhomme, Boiron, &
Rull, 2002). This is validated using four focus depths
while concentration, laser power, and acquisition
time were kept constant (Figure 2a). Furthermore,
different droplets of the same solution were used each
time to ensure the intensity difference between
measurements is not induced by heat changes in the
region of focus due to the laser power. By fine-tuning
the z-axis of the objective stage, the focus depth
changed. Figure 2a illustrates that the laser beam
yields the lowest Raman intensity when focused on
the aqueous glucose solution’s surface (depth = 0
um). Instead, the intensity slightly decreases with the
focus depth below the solution’s surface (e.g., more
scattering at a depth of 200 um compared to 400 um).
Optimized Detection of Hypoglycemic Glucose Ranges in Human Serum by Raman Spectroscopy with 532 nm Laser Excitation
161

Figure 2: Optimizations for univariate detection of low
glucose concentration using merely 1125 cm
-1
band from
human serum with 532 nm green laser-induced Raman
spectroscopy in interference with carotenoids’ resonance
Raman band of 1153 cm
-1
. Intensity dependency of 1125
cm
-1
band to (a) depth of focus variation, (b) acquisition
time, and (c) laser power variation.
On the other hand, increasing the laser power and
the acquisition time increases the sensitivity of
Raman spectra (Braun et al., 2016). Figure 2b
illustrates
the processed Raman spectra of 5 mmol/l
Figure 3: Unprocessed Raman scattering spectra of 532 nm
green laser-induced human serum with glucose
concentrations ranging from 10 mmol/l to severe
hypoglycemic ranges and nanopure water. The depth of
laser focus is 200 μm inside the solution droplet, the
excitation duration is 3 minutes, and the laser power is 400
mW. The highlighted characteristic Raman peak of glucose
1125 cm
-1
appears as a small shoulder to the strong
carotenoid resonance peak of 1153 cm
-1
but is still
distinguishable due to the applied optimizations. Offsets are
added for clarity.
glucose spiked serum with 400 mW of power with
different acquisition times varied from 10 s to 180 s
in the signature region. Data show that the signal by
glucose at 1125 cm
-1
stays stable, although the strong
total carotenoid resonance peaks saturate in the
acquisition time of 180 s. Figure 2c illustrates the
processed Raman spectra for the same samples but
with an acquisition time of 120 s and different laser
power varied from 0.4 mW to 200 mW. Figure 2c
shows that the 200 mW is not enough to detect low
glucose levels in serum because of the interference
with the total carotenoids resonance band.
Figure 3. illustrates the unprocessed serum
Raman spectra with glucose concentrations ranging
from 0 mmol/l to 10 mmol/l obtained by considering
all the discussed optimization (depth of laser focus
200 μm, excitation duration 3 minutes, and laser
power 400 mW). The highlighted glucose Raman
shift peak is stable and can be used in the univariate
analysis, calculating merely the area under the curve
at 1125 ± 7.5 cm
–1
, even though the 1153 cm
–1
and
1512 cm
–1
resonance carotenoid pecks saturated
already at 4 mmol/l of glucose in the serum.
Figure 4a. illustrates the filtered spectra from
Figure 3 in the region of interest, as highlighted, and
Figure 4b shows the obtained calibration curve by
recording an excellent linear fit (randomly scattered
PHOTOPTICS 2022 - 10th International Conference on Photonics, Optics and Laser Technology
162
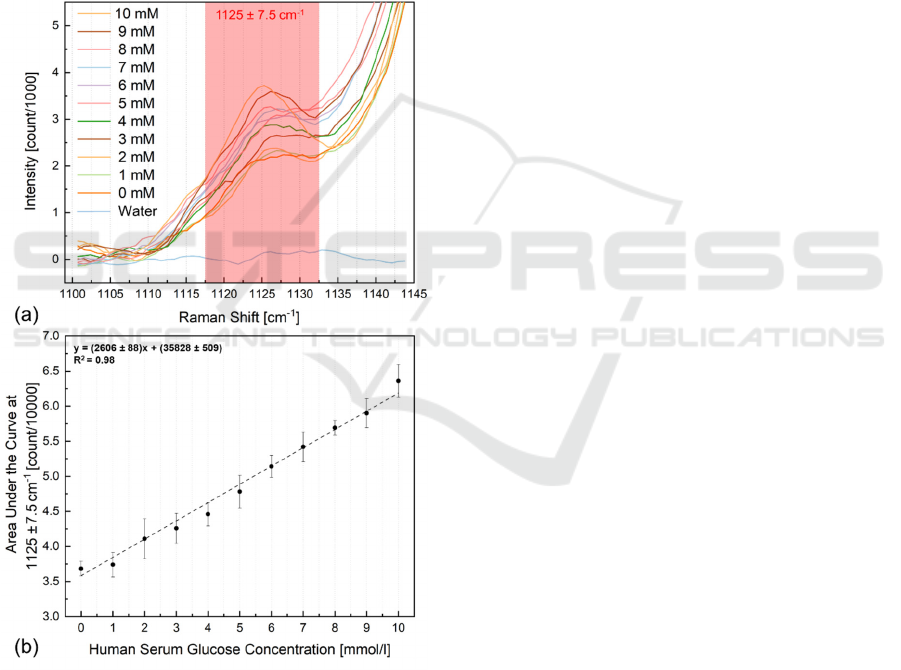
data in the residual plot was recorded) with R
2
value of
0.98, the sensitivity of ~ 2606 counts/mM, and root
mean square of the error or residual standard deviation
of 0.6. The theoretical limit of detection (LOD) is
calculated with (1) in accordance with recommenda-
tions by the International Union of Pure and Applied
Chemistry (IUPAC) definitions (Stacey, Mader, &
Sammon, 2017; Vandenabeele & Moens, 2012).
LOD = Kẟ/S ≈ 1.2 mmol/l (1)
Where K is the confidence coefficient (usually K=3
with a confidence level of 99.86%), ẟ is the standard
deviation of the blank measurement (here ~ 1066.9
counts), and S is the slope of the calibration curve
(here ~ 2606 counts/mM).
Figure 4: (a) Processed Raman scattering spectra of human
serum with glucose concentrations below 10 mmol/l and
water; the characteristic peak under analysis is highlighted.
The visual evaluation of the Raman shift around 1125 cm
–1
indicates the glucose level increase as a function of its
concentration. (b) The calibration curve for glucose
concentration prediction is computed by the area under the
curve at 1125 ± 7.5 cm
–1
; three consecutive measurements
return the standard deviation error bars. Sensitivity ≈ 2606
counts/mM and LOD ≈ 1.2 mmol/l.
4 CONCLUSION
The 532 nm green laser-induced autofluorescence
appears as background noise in the human serum
Raman spectra but can be filtered out. Therefore, it is
feasible to acquire 532 nm excitation source for
glucose detection, while it appears highly
advantageous to improve the efficiency of the Raman
scattering (up to almost 16 times) with respect to
near-infrared wavelengths. Furthermore, 532 nm
laser choice is optimal for low-cost applications with
CMOS imagers. In fact, their highest quantum
efficiency (QE) at this wavelength is increased by a
further 37.5%: i.e., typically CMOS imagers QE at
532 nm is ~ 95% while is only 65% at 785 nm). Of
course, total carotenoids resonance appears when 532
nm laser is utilized in spontaneous Raman
spectroscopy on full human serum. Although this is
not an issue for high glucose concentrations (e.g., in
the case of hyperglycemia monitoring), this
resonance by carotenoids limits the detection of lower
glucose levels (below 10 mmol/l, or 180 mg/dl).
These levels are of top importance to monitor because
they typically correspond to those of hypoglycemic
patients, indeed.
Therefore, this study investigated possible
optimizations on laser focal depth, laser excitation
duration, and laser power to extend the sensitivity of
the measurement to low glucose ranges in order to
open the monitoring of hypoglycemic ranges below
2.2 mmol/l (40 mg/dl), usually neglected in
applications of Raman detection of glucose for the
limitations we have described in this paper. Indeed,
the calibration curve we have recorded on serum
samples by applying the mentioned optimized tuned
parameters was enough sensitive and linear in the
range of 0–10 mmol/l, with a limit of detection (LOD)
at 1.2 mmol/l only. Therefore, this study confirms that
Raman spectroscopy is useful to measure endogenous
compounds in lower concentrations also in the case
their peak are typically present close to the region of
Raman shift where carotenoid-interference is usually
present.
Future developments will be focused to directly
detect urea and lactate in lower concentration ranges
as well, in human serum, with 532 nm-induced
Raman spectroscopy, by merely analyzing their
single Raman signatures bands. Lactate has a
characteristic peak around 861 cm
-1
, and urea has a
strong characteristic presence around 1005 cm
-1
(Golparvar et al., 2021). Although lactate
characteristic peak hypothetically will not interfere
with any of the carotenoids resonance bands, urea’s
characteristic peak will interfere with the resonance
Optimized Detection of Hypoglycemic Glucose Ranges in Human Serum by Raman Spectroscopy with 532 nm Laser Excitation
163

band of total carotenoids at 1002 cm
-1
, and further
investigations should be carried out similarly to
optimize the selectivity for urea.
ACKNOWLEDGMENTS
This work was supported by the École Polytechnique
Fédérale de Lausanne (EPFL) research fund. The
authors gratefully thank Dr. Richard Gaal for highly
fruitful discussions about Raman spectroscopy.
REFERENCES
Abdoli, S., Hessler, D., Vora, A., Smither, B., & Stuckey,
H. (2020). Descriptions of diabetes burnout from
individuals with Type 1 diabetes: an analysis of
YouTube videos. Diabetic Medicine, 37(8), 1344-1351.
Adar, F. (2017). Carotenoids-their resonance Raman
spectra and how they can be helpful in characterizing a
number of biological systems. Spectroscopy, 32(6), 12-
20.
Adar, F., Lee, E., Mamedov, S., & Whitley, A. (2010).
Experimental evaluation of the depth resolution of a
Raman microscope. Microscopy and Microanalysis,
16(S2), 360-361.
Asharani, P., Wu, Y. L., Gong, Z., & Valiyaveettil, S.
(2008). Toxicity of silver nanoparticles in zebrafish
models. Nanotechnology, 19(25), 255102.
Bohn, T. (2018). Metabolic fate of bioaccessible and non-
bioaccessible carotenoids. Non-Extractable
Polyphenols and Carotenoids: Importance in Human
Nutrition and Health, 165-200.
Bommer, C., Sagalova, V., Heesemann, E., Manne-
Goehler, J., Atun, R., Bärnighausen, T., . . . Vollmer, S.
(2018). Global economic burden of diabetes in adults:
projections from 2015 to 2030. Diabetes care, 41(5),
963-970.
Boukhayma, A. (2018). Low-noise CMOS image sensors.
In Ultra Low Noise CMOS Image Sensors (pp. 13-34):
Springer.
Boukhayma, A., Peizerat, A., & Enz, C. (2016). A sub-0.5
electron read noise VGA image sensor in a standard
CMOS process. IEEE Journal of solid-state circuits,
51(9), 2180-2191.
Braun, F., Schwolow, S., Seltenreich, J., Kockmann, N.,
Röder, T., Gretz, N., & Rädle, M. (2016). Highly
sensitive Raman spectroscopy with low laser power for
fast in-line reaction and multiphase flow monitoring.
Analytical chemistry, 88(19), 9368-9374.
Brinati, L. M., de Fátima Januário, C., Balbino, P. C.,
Gonçalves Rezende Macieira, T., Cardoso, S. A.,
Moreira, T. R., & de Oliveira Salgado, P. (2021).
Incidence and Prediction of Unstable Blood Glucose
Level among Critically Ill Patients: A Cohort Study.
International Journal of Nursing Knowledge, 32(2), 96-
102.
Chege, B. M., Birech, Z., Mwangi, P. W., & Bukachi, F. O.
(2019). Utility of Raman spectroscopy in diabetes
detection based on biomarker Raman bands and in
antidiabetic efficacy studies of herbal extract Rotheca
myricoides Hochst. Journal of Raman Spectroscopy,
50(10), 1358-1366.
Dubessy, J., Lhomme, T., Boiron, M.-C., & Rull, F. (2002).
Determination of chlorinity in aqueous fluids using
Raman spectroscopy of the stretching band of water at
room temperature: application to fluid inclusions.
Applied spectroscopy, 56(1), 99-106.
Dudek, M., Zajac, G., Szafraniec, E., Wiercigroch, E., Tott,
S., Malek, K., . . . Baranska, M. (2019). Raman Optical
Activity and Raman spectroscopy of carbohydrates in
solution. Spectrochimica Acta Part A: Molecular and
Biomolecular Spectroscopy, 206, 597-612.
Fujihara, J., Nishimoto, N., Yasuda, T., & Takeshita, H.
(2019). Discrimination between infant and adult
bloodstains using micro‐Raman spectroscopy: A
preliminary study. Journal of forensic sciences, 64(3),
698-701.
Golparvar, A., Boukhayma, A., Loayza, T., Caizzone, A.,
Enz, C., & Carrara, S. (2021). Very Selective Detection
of Low Physiopathological Glucose Levels by
Spontaneous Raman Spectroscopy with Univariate
Data Analysis. BioNanoScience, 1-7.
Greer, J. S., Petrov, G. I., & Yakovlev, V. V. (2013). Raman
spectroscopy with LED excitation source. Journal of
Raman Spectroscopy, 44(7), 1058-1059.
Gulyamov, S., Shamshiddinova, M., Bae, W. H., Park, Y.
C., Kim, H. J., Cho, W. B., & Lee, Y. M. (2021).
Identification of biomarkers on kidney failure by
Raman spectroscopy. Journal of Raman Spectroscopy.
Huang, N., Short, M., Zhao, J., Wang, H., Lui, H., Korbelik,
M., & Zeng, H. (2011). Full range characterization of
the Raman spectra of organs in a murine model. Optics
express, 19(23), 22892-22909.
Ju, J., Hsieh, C.-M., Tian, Y., Kang, J., Chia, R., Chang, H.,
. . . Liu, Q. (2020). Surface enhanced Raman
spectroscopy based biosensor with a microneedle array
for minimally invasive in vivo glucose measurements.
ACS sensors, 5(6), 1777-1785.
Kang, J. W., Park, Y. S., Chang, H., Lee, W., Singh, S. P.,
Choi, W., . . . Park, J. (2020). Direct observation of
glucose fingerprint using in vivo Raman spectroscopy.
Science Advances, 6(4), eaay5206.
Kiefer, W. (2007). Recent advances in linear and non-linear
Raman spectroscopy I. Journal of Raman
Spectroscopy: An International Journal for Original
Work in all Aspects of Raman Spectroscopy, Including
Higher Order Processes, and also Brillouin and
Rayleigh Scattering, 38(12), 1538-1553.
Krishnan, R., & Shankar, R. (1981). Raman effect: History
of the discovery. Journal of Raman Spectroscopy,
10(1), 1-8.
Lawson, E., Barry, B., Williams, A., & Edwards, H. (1997).
Biomedical applications of Raman spectroscopy.
Journal of Raman Spectroscopy, 28(2‐3), 111-117.
Li, Z., Deen, M. J., Kumar, S., & Selvaganapathy, P. R.
(2014). Raman spectroscopy for in-line water quality
PHOTOPTICS 2022 - 10th International Conference on Photonics, Optics and Laser Technology
164

monitoring—Instrumentation and potential. Sensors,
14(9), 17275-17303.
Medipally, D. K., Maguire, A., Bryant, J., Armstrong, J.,
Dunne, M., Finn, M., . . . Meade, A. D. (2017).
Development of a high throughput (HT) Raman
spectroscopy method for rapid screening of liquid blood
plasma from prostate cancer patients. Analyst, 142(8),
1216-1226.
Mhlanga, N., Tetyana, P., Nyembe, S., & Sikhwivhilu, L.
(2021). Application of Raman Spectroscopy in
Biomedical Diagnostics. In Recent Developments in
Atomic Force Microscopy and Raman Spectroscopy for
Materials Characterization: IntechOpen.
Parachalil, D. R., Bruno, C., Bonnier, F., Blasco, H.,
Chourpa, I., McIntyre, J., & Byrne, H. J. (2019). Raman
spectroscopic screening of high and low molecular
weight fractions of human serum. Analyst, 144(14),
4295-4311.
Schmitt, M., & Popp, J. (2006). Raman spectroscopy at the
beginning of the twenty‐first century. Journal of Raman
Spectroscopy: An International Journal for Original
Work in all Aspects of Raman Spectroscopy, Including
Higher Order Processes, and also Brillouin and
Rayleigh Scattering, 37(1‐3), 20-28.
Singh, G. P., Goh, S., Canzoneri, M., & Ram, R. J. (2015).
Raman spectroscopy of complex defined media:
biopharmaceutical applications. Journal of Raman
Spectroscopy, 46(6), 545-550.
Smith, J. L. (2015). The pursuit of non-invasive glucose:
hunting the deceitful turkey. Revised and Expanded,
copyright.
Stacey, P., Mader, K. T., & Sammon, C. (2017). Feasibility
of the quantification of respirable crystalline silica by
mass on aerosol sampling filters using Raman
microscopy. Journal of Raman Spectroscopy, 48(5),
720-725.
Stuart, D. A., Yuen, J. M., Shah, N., Lyandres, O., Yonzon,
C. R., Glucksberg, M. R., . . . Van Duyne, R. P. (2006).
In vivo glucose measurement by surface-enhanced
Raman spectroscopy. Analytical chemistry, 78(20),
7211-7215.
Šugar, J., & Bouř, P. (2016). Quantitative analysis of sugar
composition in honey using 532‐nm excitation Raman
and Raman optical activity spectra. Journal of Raman
Spectroscopy, 47(11), 1298-1303.
Tuschel, D. (2020). Spectral Resolution and Dispersion in
Raman Spectroscopy. Spectroscopy, 35, 9.
Vandenabeele, P., & Moens, L. (2012). Some ideas on the
definition of Raman spectroscopic detection limits for
the analysis of art and archaeological objects. Journal
of Raman Spectroscopy, 43(11), 1545-1550.
Wang, L., Mizaikoff, B., & Kranz, C. (2009).
Quantification of sugar mixtures with near-infrared
Raman spectroscopy and multivariate data analysis. A
quantitative analysis laboratory experiment. Journal of
chemical education, 86(11), 1322.
Wróbel, M. (2016). Non-invasive blood glucose monitoring
with Raman spectroscopy: prospects for device
miniaturization. Paper presented at the IOP Conference
Series: Materials Science and Engineering.
Zhou, B., Lu, Y., Hajifathalian, K., Bentham, J., Di Cesare,
M., Danaei, G., . . . Taddei, C. (2016). Worldwide
trends in diabetes since 1980: a pooled analysis of 751
population-based studies with 4ꞏ 4 million participants.
The lancet, 387(10027), 1513-1530.
Zhou, X., Qin, M., Zhu, J., Wang, C., Zhu, G., Wang, H.,
& Yang, L. (2019). Rapid and sensitive surface‐
enhanced resonance Raman spectroscopy detection for
norepinephrine in biofluids. Journal of Raman
Spectroscopy, 50(3), 314-321.
Zimmet, P., Alberti, K., & Shaw, J. (2001). Global and
societal implications of the diabetes epidemic. Nature,
414(6865), 782-787.
Optimized Detection of Hypoglycemic Glucose Ranges in Human Serum by Raman Spectroscopy with 532 nm Laser Excitation
165
