
Studying Interaction Patterns for Knowledge Graph Exploration
Loris Grether
a
and Hans Friedrich Witschel
b
FHNW University of Applied Sciences and Arts Northwestern Switzerland, Riggenbachstrasse 16, Olten, Switzerland
Keywords:
Knowledge Graph (KG), Knowledge Graph Exploration, User Guidance, Interaction Patterns, User Study.
Abstract:
The flexible data models of knowledge graphs (KGs) are powerful tools for handling large and dynamic data
sets and are increasingly used for the tasks of data processing and storage. Although a KG may contain rich
data and powerful connections, it is upon the searchers to explore these graphs and make sense out of them.
The objective of this research paper is to investigate if and how KG exploration can be improved from a user’s
point of view, to enhance the discovery of information. A qualitative user study should deliver insights on how
different users interact with a KG, at what point they struggle and missed potential discoveries. Recognizing
and understanding the intentions of the users is necessary to create solutions that support them best in their
particular situation. Based on the findings, new features and improvements are suggested, developed and
added to a prototypical KG exploration application, to be finally tested with regard to their impact on user
exploration and acceptance. Based on the collected data we could identify the best guidance mechanisms that
improve KG exploration the most.
1 INTRODUCTION
Knowledge graphs are considered to be one of the
measures that can help to structure the highly dy-
namic flood of data that is generated at increasing
rates. However, KGs are not easily accessible, es-
pecially for users that do not know any particular
query language or the structure and relations of the
stored data (Jayaram et al., 2014; Kuric et al., 2019;
Yahya, 2016). In order to enable non-experienced and
lay persons to query KGs, user-friendly approaches
have been proposed, comprising among others key-
word search, natural language questions, querying by
example (either textual or visual), several filtering op-
tions or various forms of visual cues.
Many search scenarios involve more complex
tasks that can only hardly be solved or answered
within one query (Hassan Awadallah et al., 2014;
Bates, 1989). Additionally, users often do not have
a clear conception of their goal and thus start their
exploration with a vague information need. Using
this rather fuzzy initial question or query as a start-
ing point, the user would then iteratively seek and
trawl through the KG for further information until the
request is satisfied (Lissandrini et al., 2020; Pirolli,
2009; Witschel et al., 2021). To support the users
a
https://orcid.org/0000-0002-3024-7130
b
https://orcid.org/0000-0002-8608-9039
throughout such an exploration process, the system or
tool should not only improve the access to the graph
but also give further guidance such as orientation help
and navigation advice. Currently, there is a relatively
large deficit of user-based studies of the different ap-
proaches to searching and exploring a KG (Elbed-
weihy et al., 2014). Instead, existing approaches esti-
mate their maturity level based on questions answer-
ing datasets comprising a ground truth (e.g. (Liang
et al., 2021)) or simply provide demonstrations of
their functionalities, but none of them is a user-based
evaluation (Witschel et al., 2021). It is thus unclear to
what extent the given approaches are useful from an
end-user point of view, a gap that we intend to close
by conducting a qualitative user study.
2 RELATED WORK
To get a better overview and understanding of the
wide variety of different KG exploration options, we
cluster the different approaches into the following
three dimensions.
(1) The first dimension is the query language
respectively the query structure. A query can be
fully structured (typically using a query language
(e.g. SPARQL, SQL, Cypher, etc.)), semi structured
(e.g. keyword-based) (Wu et al., 2013; Namaki et al.,
Grether, L. and Witschel, H.
Studying Interaction Patterns for Knowledge Graph Exploration.
DOI: 10.5220/0011548600003335
In Proceedings of the 14th International Joint Conference on Knowledge Discovery, Knowledge Engineering and Knowledge Management (IC3K 2022) - Volume 1: KDIR, pages 257-264
ISBN: 978-989-758-614-9; ISSN: 2184-3228
Copyright
c
2022 by SCITEPRESS – Science and Technology Publications, Lda. All rights reserved
257

2018) or unstructured such as free-text respectively
natural language questions (Zafar et al., 2020; Hu
et al., 2021). It is also possible to perform a query
based on an example by providing a subgraph in ei-
ther textual (Lissandrini et al., 2020) or visual form
(Cuenca et al., 2021; Yi et al., 2017).
(2) The second dimension is the form and level
of interaction. In this respect, the methods differ re-
garding (i) the degree of interaction or guidance, (ii)
the point in time of interaction or guidance and (iii)
the form or type of interaction or guidance.
The basic principle of guidance is a mixed-
initiative process where a system assists (guides) the
user and in turn receives feedback from the user
(Ceneda et al., 2019): This usually happens in an in-
teractive and iterative manner until the knowledge gap
is resolved or the goal achieved.
(3) The third dimension is about the presentation
of the results. Here, a basic distinction can be made
between a textual and a visual result. The majority
of the identified Natural Language Querying (NLQ)
and Question Answering (QA) systems generate tex-
tual responses. The representation of the visual re-
sults can differ from each other. For example, the sys-
tems of Mohanty and Ramanath (Mohanty and Ra-
manath, 2019), Namaki et al. (Namaki et al., 2018)
and Witschel et al. (2020) or almost every approach
that implements a visual query construction, repre-
sents the results as a subgraph. Other studies present
multiple subgraphs (Jayaram et al., 2015; Yi et al.,
2017) and yet others summarize the result set (Wu
et al., 2013; Yang et al., 2014).
3 METHOD
We have conducted two qualitative user studies (see
section 4 and 5), to answer our main research ques-
tion, namely whether guidance mechanisms improve
KG exploration and the discovery of hidden informa-
tion. We have defined 3 (sub-) research questions
(RQs) as follows:
• RQ1: How does a user interact with a KG and
what do they fail to discover?
• RQ2: How can one recognize the intents of a user
by observing their interactions?
• RQ3: What are the best guidance mechanisms?
During the research project of (Witschel et al.,
2020), the authors developed a prototypical graph ex-
ploration tool as well as a KG containing information
from the medical domain (Riesen et al., 2021). Both
of these artifacts are used to support the two data col-
lection processes of the present paper.
The purpose of having two phases of data collec-
tion was to use the first phase to enable the forma-
tion of hypotheses of required guidance and interac-
tion mechanism. For the second phase, a selection of
these hypotheses could be tested by implementing the
respective guidance functionalities.
The scenario and tasks of both user tests is to per-
form a basic anamnesis of a patient with the help of
the medical KG. Due to the domain of the used KG,
the probands are all medical students, who are cur-
rently in their final year of studies at the University
of Basel in Switzerland. The fact that the medical
students are familiar with the content of the graph re-
spectively its entities represented by the node types
and their relationships may simplify their initial ori-
entation in the network and should create similar pre-
conditions for all of them. As prospective doctor-to-
be, the probands receive a fictitious patient case with
only little information about the symptoms and de-
mographics of a patient. They are asked to make an
initial diagnosis and gather as much information as
possible (assisted by the tool and the medical graph
as its basis).
In total, the study counted eight probands that
have participated in the user tests and interviews. All
sessions were video-recorded and coded using the
software tool MAXQDA.
4 FIRST DATA COLLECTION
The first data collection addressed RQ1 and RQ2. Its
objective was to gain insights on how different users
would interact with a KG by different means and to
identify where they might struggle or miss potential
discoveries.
Before explaining the task to the individual
proband, a short introduction of the tool and its basic
functionalities was given. To answer RQ1, the exper-
iment started with all assisting functionalities turned
off. In order to not influence the probands during this
initial phase in any way, the guidance mechanisms
were deliberately not shown in the primary introduc-
tion but solely mentioned. Once the exploration had
progressed to the point where a certain level of com-
plexity was reached (namely two different relation-
ship types were displayed), the probands were intro-
duced to the two guidance mechanisms of query rec-
ommendation and result preview. This was also the
start of the second part of the exploration phase where
the guidance mechanisms were available to the users.
The user tests were terminated when the user had the
impression of either having identified enough infor-
mation (e.g. made the diagnosis) or was stuck. Dur-
KDIR 2022 - 14th International Conference on Knowledge Discovery and Information Retrieval
258

ing the whole exploration process, the probands were
observed with a special focus on:
• Do they have problems to orientate themselves in
the graph?
• Do they know what to do next?
• How easy is it for them to interact with the differ-
ent functionalities offered by the tool?
• When are they using what functionality?
4.1 Formative Evaluation
(Fox, 2020), p.1 defines the two most important as-
pects of an exploration system as follows: “The con-
sole of the precognitive system will have two special
buttons, a silver one labeled ‘Where am I’ and a gold
one labeled ‘What should I do next?’”.
At first, we conducted user tests with functionali-
ties as described in (Witschel et al., 2021), comprising
the possibility to ask questions in natural language,
receive recommendations for further questions when
selecting nodes and giving answers in the form of sub-
graphs.
In all user tests conducted within this first phase
of our study, the majority of the detected challenges
can be attributed to the area of orientation (i.e. know-
ing where you are). This could be due to the fact that
the probands were all advanced medical students and
knew how to proceed to come to a solution. It addi-
tionally appeared that the students had enough know-
how about the content of the KG to be able to roughly
estimate how to deal with the single entities and their
relationships. The keyword filter checkbox list was
well used by the probands to inspire their actions and
to proceed during the graph navigation as it lists all
available node types. Further, none of the participants
gave the impression of having major difficulties with
the handling and use of the various functions of the
tool. Especially, after a certain time of interaction,
the interplay looked generally intuitive. The general
approach of visualizing the answers of the system in
the form of nodes and edges was well received by the
probands.
The following subitems describe the observations
made during the user tests in terms of orientation is-
sues, establishes corresponding hypotheses and sug-
gests possible solutions.
• Filter Questions. The scenario of the user test
required to first enter several keywords and then
asking a suitable question in natural language. At
the latest, after all symptoms were added to the
canvas via keyword search, all probands searched
for the diseases associated with these symptoms.
While one proband directly started with a specific
question, looking only for the diseases exhibit-
ing all of the symptoms (i.e. ”Which diseases
combine all these symptoms?”), the other two
probands both first asked a rather general question
that should return all the diseases associated with
at least one of the symptoms shown (e.g. ”What
diseases cause these symptoms?”) and narrowed
the result down to diseases connected to all the
available symptoms in a second step. The gram-
mar that translates the natural language questions
into cypher queries does support filter questions,
e.g. ones starting with “Which of these. . . ” to re-
strict the result set to certain nodes. However, the
grammar did not feature filter questions such as
“What diseases cause all of these symptoms?”.
• Other Filtering Options. We also observed that,
when approximately 60 nodes (from at least two
different node types) and 75 edges were shown,
the probands had some trouble to make sense of
the displayed subgraph. They tried to rearrange
the nodes on the canvas to recreate an overview.
Overall, they spent a lot of time arranging and re-
arranging the numerous nodes and yet, due to the
many edges, it was still not easy to see if all nodes
of interest could be identified.
The list below describes different functionalities
that might be helpful to retain the overview in
such situations.
– Clustering: R
´
asto
ˇ
cn
´
y et al. (R
´
asto
ˇ
cn
´
y et al.,
2011) state that result clustering is an estab-
lished approach to decrease information over-
load in KG exploration. One of the probands
stated during the user test that with a manual
arrangement and selection of individual nodes,
there is always a threat that one might not be
able to detect all nodes that may belong to a
specific group. If the probands could use a
function to cluster the displayed nodes (e.g. a
cluster button in the taskbar), they might be
able to orient themselves more easily in con-
fusing subgraphs.
– Reduce Result Set Slider: According to Tomin-
ski et al. (Tominski et al., 2009), range sliders
are an effective instrument to filter objects by
their numerical attributes and values calculated
by the system itself could be a suitable mea-
sure. A slider filter could be used to reduce the
nodes one after another according to a degree
that is calculated just in time over the currently
displayed subgraph or once upfront through the
whole graph.
– Node Weight: Instead of reducing the number
of nodes displayed, node weighting is intended
Studying Interaction Patterns for Knowledge Graph Exploration
259
to highlight the degree of relevance through vi-
sual means. For instance, Bastian et al. (Bas-
tian et al., 2009) could assist their users by mak-
ing sense of the network structure and content
by indicating the relative importance of nodes
by different colors and sizes.
All described functionalities have been imple-
mented and added to the prototypical graph explo-
ration system developed by Witschel et al. (Witschel
et al., 2020).
5 SECOND DATA COLLECTION
The objective of the second data collection is to deter-
mine to what degree the new functionalities are able
to improve graph exploration and thus answer RQ3.
With regard to the first user tests, all probands ap-
preciated the availability of multiple functionalities
and the associated freedom to use them depending on
the current scenario. It could be observed that the in-
terplay between the different functionalities can im-
prove the exploration process. While choosing from
multiple options may be perceived as useful, Don-
ald Norman states: “Complexity probably increases
as the square of the features: double the number of
features, quadruple the complexity.” (Norman, 2002).
Therefore, using the evaluation procedure described
below, functionalities are examined with regard to
their impact on user exploration and acceptance. In
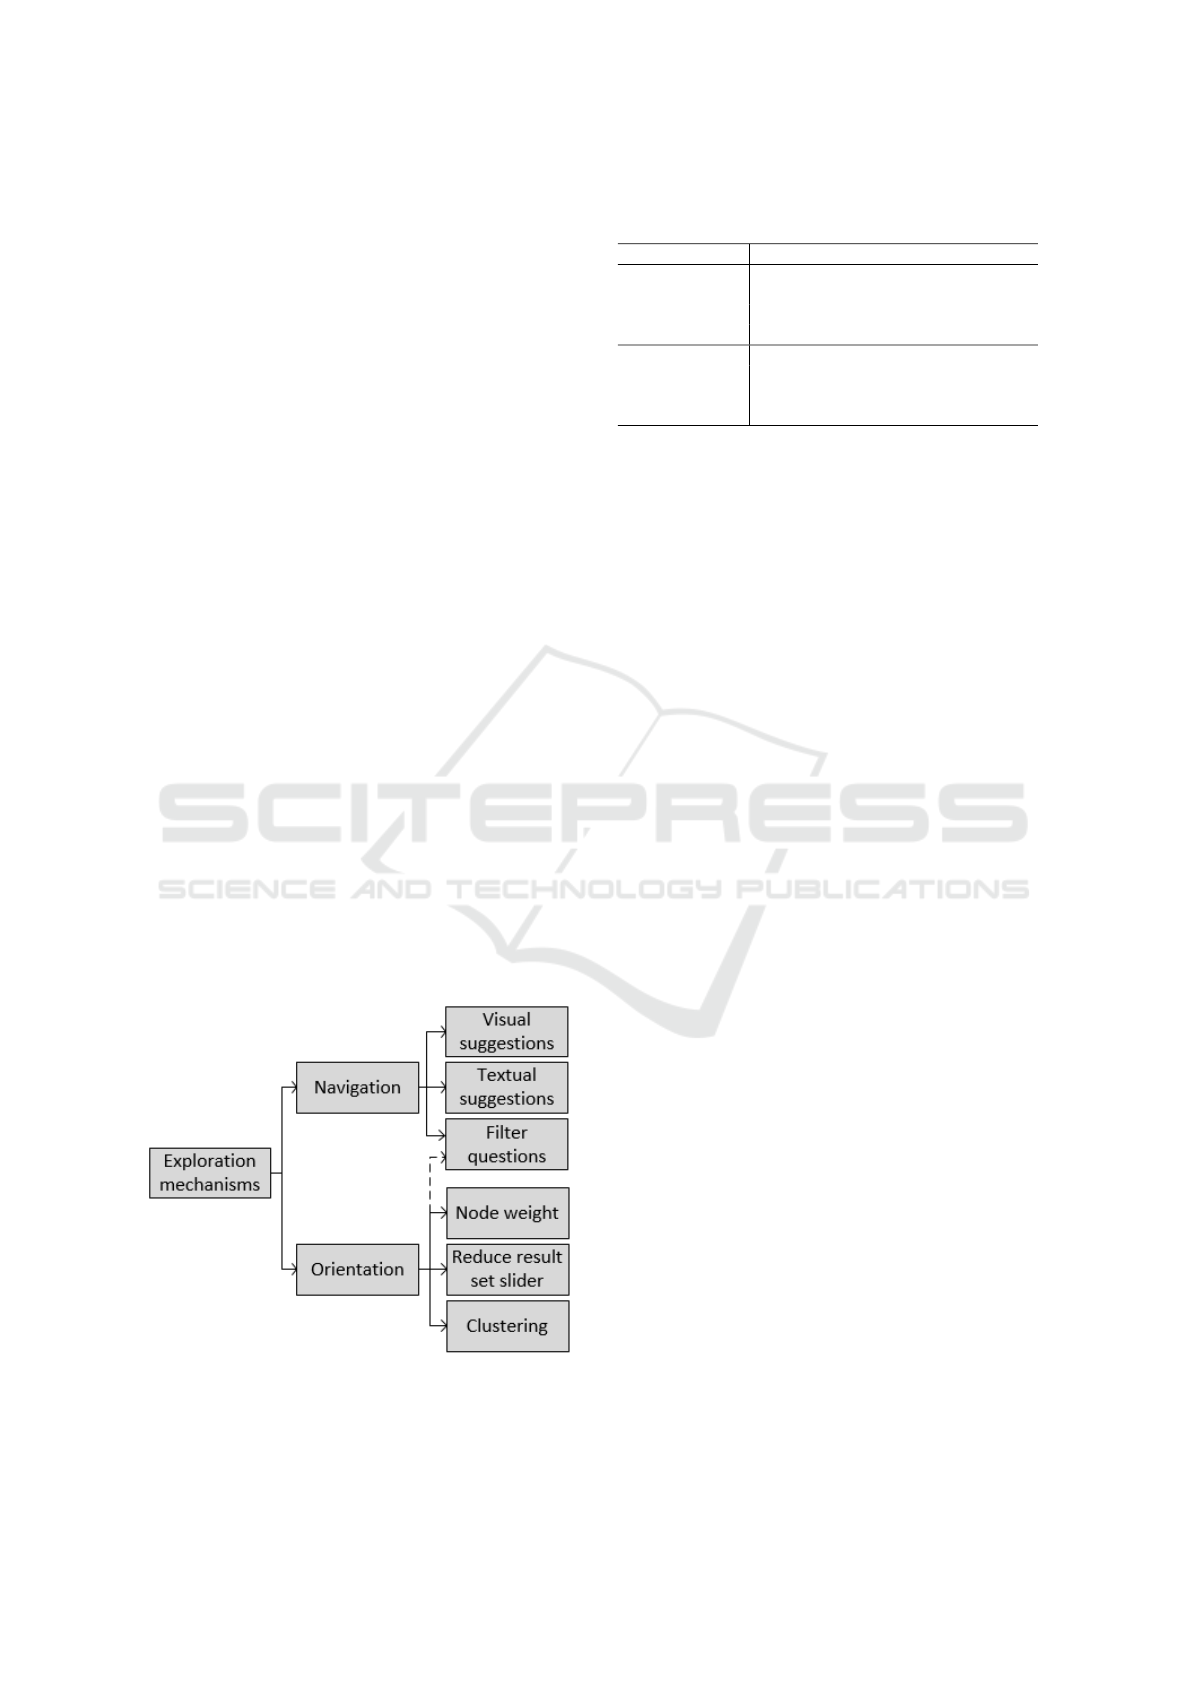
general, one can distinguish between the two applica-
tion areas orientation and navigation. Figure 1 shows
the allocation of the individual functionalities with re-
spect to their area of application.
Figure 1: Exploration functionalities of the graph explo-
ration system.
Table 1: Frequency of usage for the different orientation
and navigation aids by probands U1-U5.
Functionality U1 U2 U3 U4 U5 Sum
Orientation 4 9 11 7 5 36
Cluster 0 3 4 4 0 11
Node weight 1 2 3 2 1 9
Reduce slider 0 1 4 1 1 7
Navigation 6 12 9 6 7 40
Textual 0 1 7 5 3 16
Visual 2 6 0 0 0 8
Filter Question 0 0 0 0 1 1
The scenario and task of the user tests remains the
same as in the first data collection. However, five new
medical students were recruited i.e. none of them had
participated in the previous data collection or had al-
ready seen the KG exploration system. All students
had to solve the same task and thus received the same
introduction to the tool as the first group.
At the first data collection, the navigation mech-
anisms were only switched on when a certain explo-
ration stage was reached to identify and investigate
possible changes in user exploration behavior trig-
gered by these functionalities. For the new user tests,
all functionalities were available from the beginning.
Considering the group size of the participants and
the likelihood that not every proband would use all the
functionalities on their own, it was important that they
commented and justified their decisions and actions.
Further, they were occasionally asked to go back to
certain scenarios and to use one to many alternative
functionalities in order to be able to make a better as-
sessment. The individual user tests were concluded
by a follow-up interview addressing user preferences
regarding interaction functionalities.
6 EVALUATION
We first show a quick overview of how often our
probands used the available orientation and naviga-
tion aids, see Table 1.
In the following, we will occasionally refer to
these numbers. However, because of the small num-
ber of participants, we will be very careful to draw
any conclusions from them. Rather, the focus of the
following discussion will be on our qualitative find-
ings.
6.0.1 Orientation Functionalities
Among the three orientation mechanisms clustering,
node weight and reduce result set slider, the cluster
functionality was identified as the best approach to
improve the orientation of the searcher. According to
the users, the main reason for this are its ease of use,
KDIR 2022 - 14th International Conference on Knowledge Discovery and Information Retrieval
260
its efficient way to simplify the result set and its ad-
vantages over the other approaches, especially with
large result sets. It turned out that the most effective
approach to graph exploration is to keep the subgraph
as small as possible. This proved more powerful than
solely emphasizing individual nodes based on impor-
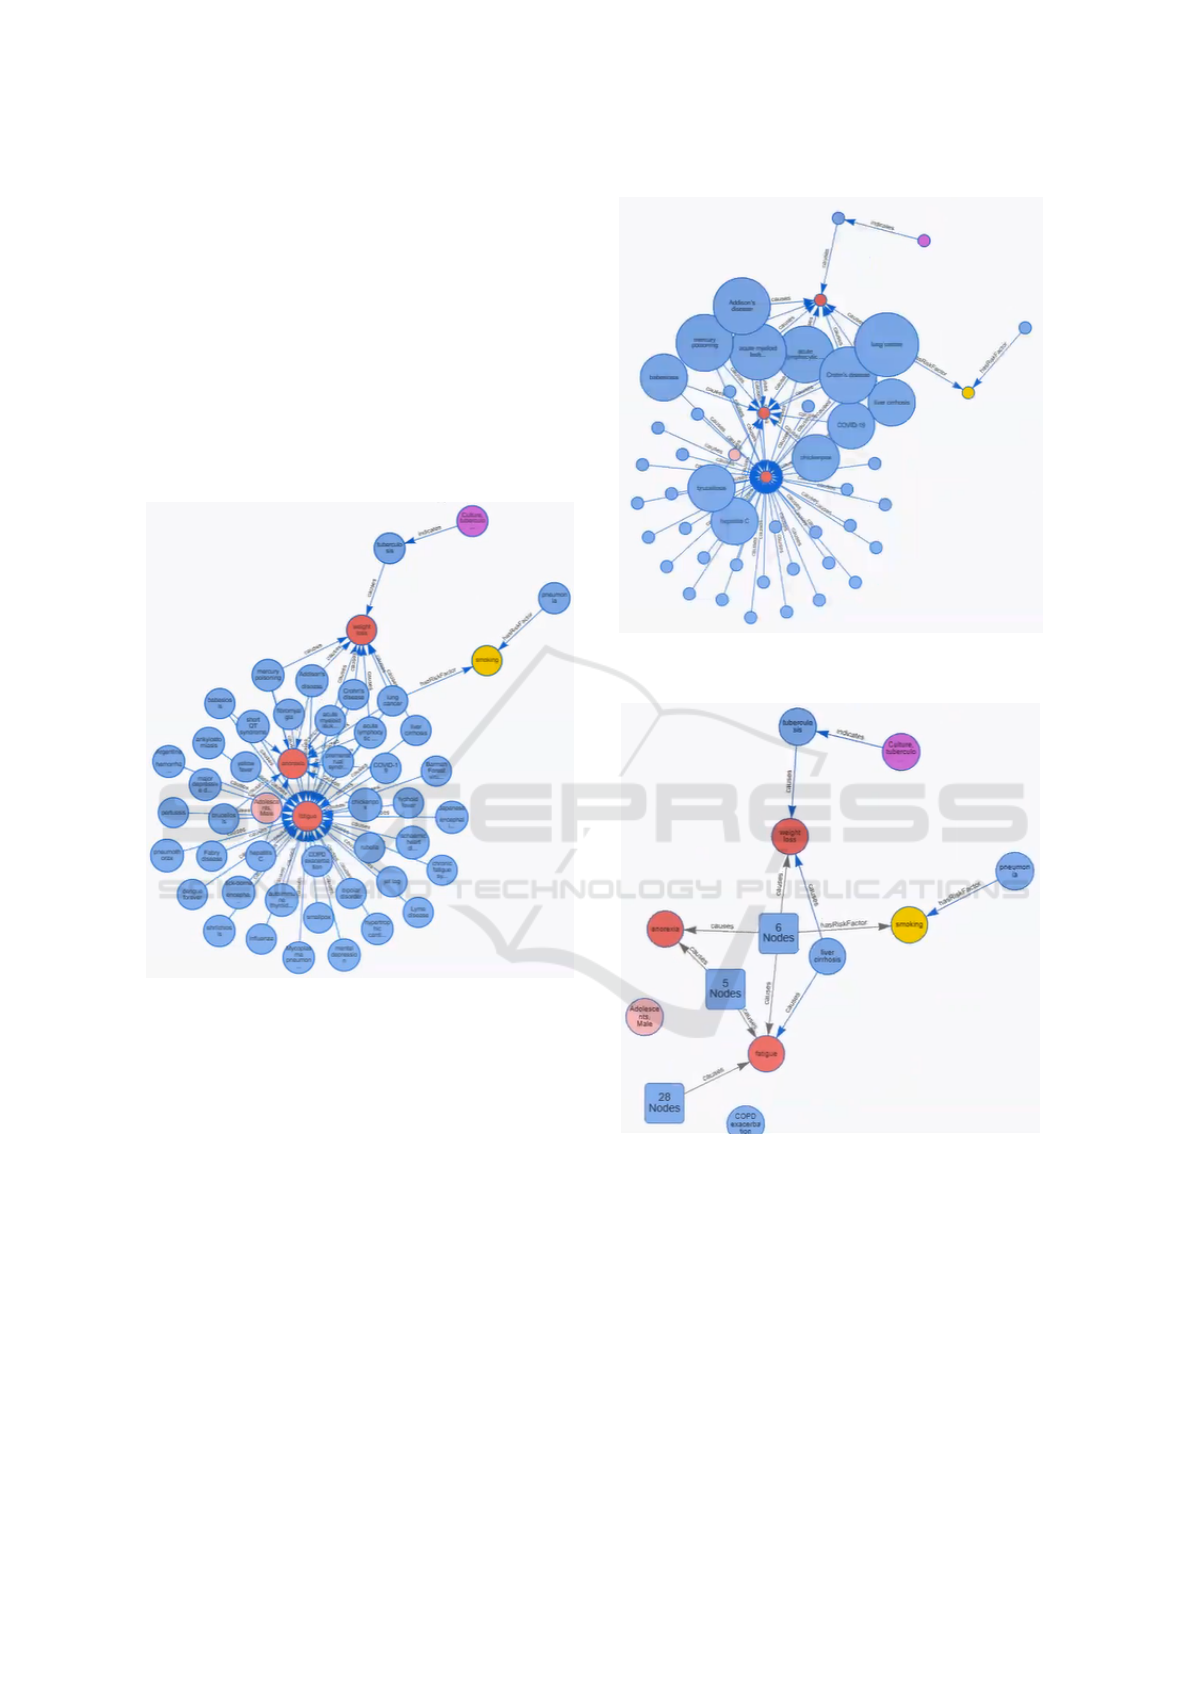
tance measures. One example that illustrates the ad-
vantage of the cluster functionality when it comes to
large results is displayed in Figure 2, 3 and 4. Figure
2 shows a subgraph consisting of approximately 49
nodes and 65 edges. The user had to identify all the
diseases (blue nodes) that are connected to all three
symptoms (red nodes).
Figure 2: Sample Subgraph.
To simplify the subgraph the user switched on the
node weight functionality (see Figure 3). Although,
the node weight highlighted the nodes with multiple
relationships, manual arrangement of the nodes might
be necessary to be sure which nodes are connected
to all symptoms. Application of a slider to reduce
the result set by removing nodes based on centrality
exhibited similar problems. The cluster functionality
on the other hand allowed the user a fast and easy
detection of the six nodes that are connected to all
three symptoms (see Figure 4).
Thus, our results indicate a strong preference for
the clustering approach, as the most efficient and ef-
fective way of compressing large and complex sub-
graphs for fast user orientation.
Figure 3: Applied node weight to the subgraph shown in
Figure 2.
Figure 4: Applied cluster to the subgraph shown in Figure
2.
6.0.2 Navigation Functionalities
Beside the navigation functionalities that were elabo-
rated within the scope of the first data collection pro-
cedure, the exploration system also encompasses a
keyword search. In our basic exploration approach,
a keyword search is always the first step of an ex-
ploration session (see (Witschel et al., 2020)). The
keyword search is not complemented by any assisting
system functionality or any form of guidance. With
Studying Interaction Patterns for Knowledge Graph Exploration
261

regard to the navigation functionalities, the following
observations could be made.
• If the node i.e. the object or attribute (e.g.
symptom, behaviour and patient characteristic)
was known to the user, they generally and ini-
tially preferred to use the keyword search to look
for it. With two exceptions, the probands only
switched to another search or exploration func-
tionality, such as visual (see figure 6) or textual
(see figure 5) guidance, when the keyword search
was unsuccessful.
• If the node i.e. the object or attribute (e.g. dis-
ease and diagnostic test) was not known to the
user, they generally used either the textual or vi-
sual guidance mechanism to look for it.
Only one user really broke the search pattern
described above, as he primarily used the keyword
search to explore and navigate through the graph –
and was even quite successful with his strategy due to
his advanced domain knowledge. The circumstance
that finally convinced the proband to use the visual
guidance was that he wanted to ensure that he finds
all diseases that are pointing to all three symptoms
named before.
Overall, test persons had different preferences re-
garding visual vs. textual navigation, see also the us-
age statistics in Table 1 where Users 1 and 2 show
strong preference for visual aids, all other users pre-
ferred textual guidance. One could argue that the
visual suggestions are more straightforward because
one does not have to read through the proposed list
of questions in the textual suggestions. On the other
hand, some of the users stated that the textual sug-
gestions better inspired their next actions when they
were stuck during the exploration. Finally, it could
not be determined that one approach could lead to a
more successful exploration than the other. Both ap-
proaches are regarded as equal and both might be im-
proved and adjusted in the scope of future work.
Figure 5: Example of a textual suggestion when the node
”Pneumonia” is clicked.
Figure 6: Example of a visual suggestion when the node
”Crohn’s disease” is clicked.
6.0.3 User Types
During the user tests it could be observed that the user
type can have considerable influence on the explo-
ration.
White et al. (White et al., 2009) and Elbed-
weihy et al. (Elbedweihy et al., 2012) differentiate
between domain experts i.e. users that have knowl-
edge in the topic or subject of the information need
and casual users or novices that have little or no do-
main knowledge at all. White et al. (White et al.,
2009) thereby divide the search behavior in to the
three categories (1) query attributes (wording, syn-
tax and query length), (2) search strategies and tactics
(sequence of actions, mix of querying and browsing)
and (3) search outcomes (accuracy and time). For
both user tests conducted in the scope of this paper,
all probands were medical students and thus can be
regarded as domain experts. The search strategy of
the proband who mainly used the keyword search to
navigate through the KG corroborates this distinction
of user type. Without an advanced medical knowl-
edge, such a proceeding would not have been possi-
ble. Tabatabai & Shore (Tabatabai and Shore, 2005)
also distinguish between experts and novices. How-
ever, their separation is made between strategies and
attributes of the users that may influence the success
rate of the search. Their defined strategies are naviga-
tion, evaluation, metacognition, cognition, affect and
prior knowledge and the attributes include age, sex,
information seeking knowledge, years of experience
and computer knowledge. The last three attributes
are also considered as separators between users in the
study of Rogers et al. (Rogers et al., 1999). Two of
the probands of this study, user 4 and especially user
3, showed to have only little technological knowledge
KDIR 2022 - 14th International Conference on Knowledge Discovery and Information Retrieval
262

and experience with search engines. Their selection
of search and exploration functionalities seemed to be
rather arbitrary which redound to a rather inefficient
and ineffective exploration. Considering the infor-
mation above, we can carefully conclude two things.
First, the user type may have influence on the chosen
exploration mechanism or functionality of a search
system by the individual users. Second, computer
knowledge, technical affinity and system knowledge
influence the efficiency and effectiveness or even the
success of the exploration. According to Lazonder et
al. (Lazonder et al., 2000), novice users only need lit-
tle hands-on experience to significantly improve their
browsing skills in the web. Similar behavior could be
determined with regard to the exploration process of
the probands 3 and 4 as their confidence grew dur-
ing the user test, which had positive influence on their
findings.
Based on the currently available data, it is not pos-
sible to make further founded statements. For exam-
ple, there are multiple strategies and attributes that
may explain why some searchers are more success-
ful than others. Further research is needed to more
accurately determine the key person-related success
factors of a KG exploration.
7 CONCLUSION
The overall objective of this study was to investigate
if and how KG exploration can be improved from a
user’s point of view, to enhance the discovery of in-
formation. The literature research carried out in this
context provided information on the current state of
the art of available approaches and functionalities. A
large deficit of user-based studies and user centric
tests could be identified.
The first phase of our work was intended to fur-
ther clarify how different users interact with a KG,
where they might struggle or miss potential discov-
eries. Recognizing and understanding the intentions
and pain points of the users was necessary to create
solutions that support them best in their particular sit-
uation. We found that users face above all orientation
difficulties when results (in the form of subgraphs)
grow large. Based on these findings, new features and
improvements were suggested, developed and added
to the prototype in order to be again tested with a spe-
cial focus on the users. On the one hand, these fea-
tures comprised orientation aids for situations where
result graphs grow large, namely: a size-based node
weight visualization, a subgraph clustering and a node
centrality-based slider for result set reduction. On the
other hand, we also included again navigation aids,
namely both visual navigation suggestions (result pre-
views) and textual query suggestions (including filter
questions).
The second data collection phase evaluated the
relative utility of all resulting features from a user per-
spective. It was an important finding that – while for
orientation the node clustering approach was clearly
preferred by our study participants – there was no
clear preference regarding navigation aids. It seems
that different user types have different preferences
here and thus both textual and visual cues are needed.
Future work and further research could be moti-
vated by the one-sided selection of the participants
or the unchanged scenario of the user tests conducted
within the scope of this study. Changing these pa-
rameters may lead to different results and could thus
help to clarify whether an exploration mechanism or
even a KG exploration system can be equally efficient
and effective for all user types and use cases. KGs
and their exploration are attracting increasing interest
from both industry and academia and it is expected
that this interest will continue to grow in the future.
Some of the opportunities and benefits but also some
of the associated challenges of these topics could be
illustrated by this study. The gained knowledge may
encourage researchers to not only test their solutions
on models or statistics but also to increasingly involve
potential end users in the evaluation process.
REFERENCES
Bastian, M., Heymann, S., and Jacomy, M. (2009). Gephi
: An open source software for exploring and manipu-
lating networks. page 2.
Bates, M. J. (1989). The design of browsing and berrypick-
ing techniques for the online search interface. Online
Review, 13(5):407–424. publisher: MCB UP Ltd.
Ceneda, D., Gschwandtner, T., and Miksch, S. (2019). A
review of guidance approaches in visual data analysis:
A multifocal perspective. Computer Graphics Forum,
38(3):861–879.
Cuenca, E., Sallaberry, A., Ienco, D., and Poncelet, P.
(2021). Vertigo: a visual platform for querying and
exploring large multilayer networks. IEEE Transac-
tions on Visualization and Computer Graphics, pages
1–1. event: IEEE Transactions on Visualization and
Computer Graphics.
Elbedweihy, K., Mazumdar, S., Wrigley, S. N., and
Ciravegna, F. (2014). Nl-graphs: A hybrid approach
toward interactively querying semantic data. In Pre-
sutti, V., d’ Amato, C., Gandon, F., d’ Aquin, M.,
Staab, S., and Tordai, A., editors, The Semantic Web:
Trends and Challenges, volume 8465, pages 565–579.
Springer International Publishing, Cham.
Elbedweihy, K., Wrigley, S. N., and Ciravegna, F. (2012).
Evaluating semantic search query approaches with ex-
Studying Interaction Patterns for Knowledge Graph Exploration
263

pert and casual users. Lecture Notes in Computer Sci-
ence, pages 274–286, Berlin, Heidelberg. Springer.
Fox, E. A. (2020). How should one explore the digital
library of the future? JCDL ’20, page 1–2, New
York, NY, USA. Association for Computing Machin-
ery. [Online; accessed 2021-05-16].
Hassan Awadallah, A., White, R. W., Pantel, P., Dumais,
S. T., and Wang, Y.-M. (2014). Supporting complex
search tasks. In Proceedings of the 23rd ACM interna-
tional conference on information and knowledge man-
agement, pages 829–838.
Hu, X., Duan, J., and Dang, D. (2021). Natural language
question answering over knowledge graph: the mar-
riage of sparql query and keyword search. Knowledge
and Information Systems, 63(4):819–844.
Jayaram, N., Khan, A., Li, C., Yan, X., and Elmasri,
R. (2014). Towards a query-by-example system for
knowledge graphs. GRADES’14, page 1–6, New
York, NY, USA. Association for Computing Machin-
ery. [Online; accessed 2021-04-12].
Jayaram, N., Khan, A., Li, C., Yan, X., and Elmasri, R.
(2015). Querying knowledge graphs by example en-
tity tuples. IEEE Transactions on Knowledge and
Data Engineering, 27(10):2797–2811. event: IEEE
Transactions on Knowledge and Data Engineering.
Kuric, E., Fern
´
andez, J. D., and Drozd, O. (2019). Knowl-
edge graph exploration: A usability evaluation of
query builders for laypeople. Lecture Notes in Com-
puter Science, pages 326–342, Cham. Springer Inter-
national Publishing.
Lazonder, A. W., Biemans, H. J., and Wopereis, I. G.
(2000). Differences between novice and experienced
users in searching information on the world wide web.
Journal of the American Society for Information Sci-
ence, 51(6):576–581.
Liang, S., Stockinger, K., de Farias, T. M., Anisimova, M.,
and Gil, M. (2021). Querying knowledge graphs in
natural language. Journal of Big Data, 8(1):3.
Lissandrini, M., Mottin, D., Palpanas, T., and Velegrakis,
Y. (2020). Graph-query suggestions for knowledge
graph exploration. WWW ’20, page 2549–2555, New
York, NY, USA. Association for Computing Machin-
ery. [Online; accessed 2021-04-12].
Mohanty, M. and Ramanath, M. (2019). Insta-search:
Towards effective exploration of knowledge graphs.
CIKM ’19, page 2909–2912, New York, NY, USA.
Association for Computing Machinery. [Online; ac-
cessed 2021-04-12].
Namaki, M. H., Wu, Y., and Zhang, X. (2018). Gexp: Cost-
aware graph exploration with keywords. SIGMOD
’18, page 1729–1732, New York, NY, USA. Associ-
ation for Computing Machinery. [Online; accessed
2021-04-12].
Norman, D. A. (2002). The design of everyday things. Basic
Books, New York, 1st basic paperback edition.
Pirolli, P. (2009). Powers of 10: Modeling complex
information-seeking systems at multiple scales. Com-
puter, 42(3):33–40. event: Computer.
Riesen, K., Witschel, H.-F., and Grether, L. (2021). A novel
data set for information retrieval on the basis of sub-
graph matching. In Torsello, A., Rossi, L., Pelillo,
M., Biggio, B., and Robles-Kelly, A., editors, Struc-
tural, Syntactic, and Statistical Pattern Recognition,
volume 12644, pages 205–215. Springer International
Publishing, Cham.
Rogers, Y., Scaife, M., and Navarro-Prieto, R. (1999). Cog-
nitive strategies in web searching. Proceedings of the
5th . . . . [Online; accessed 2021-11-09].
R
´
asto
ˇ
cn
´
y, K., Tvaro
ˇ
zek, M., and Bielikov
´
a, M. (2011).
Supporting search result browsing and exploration via
cluster-based views and zoom-based navigation. WI-
IAT ’11, page 297–300, USA. IEEE Computer Soci-
ety. [Online; accessed 2021-04-12].
Tabatabai, D. and Shore, B. (2005). How experts and
novices search the web. Library & Information Sci-
ence Research, 27:222–248.
Tominski, C., Abello, J., and Schumann, H. (2009).
Cgv—an interactive graph visualization system. Com-
puters & Graphics, 33(6):660–678.
White, R. W., Dumais, S. T., and Teevan, J. (2009). Char-
acterizing the influence of domain expertise on web
search behavior. WSDM ’09, page 132–141, New
York, NY, USA. Association for Computing Machin-
ery. [Online; accessed 2021-11-02].
Witschel, H. F., Riesen, K., and Grether, L. (2020). Kvgr: A
graph-based interface for explorative sequential ques-
tion answering on heterogeneous information sources.
Lecture Notes in Computer Science, pages 760–773,
Cham. Springer International Publishing.
Witschel, H. F., Riesen, K., and Grether, L. (2021). Natural
language-based user guidance for knowledge graph
exploration: A user study. In Cucchiara, R., Fred, A.
L. N., and Filipe, J., editors, Proceedings of the 13th
International Joint Conference on Knowledge Discov-
ery, Knowledge Engineering and Knowledge Manage-
ment, IC3K 2021, Volume 1: KDIR, Online Streaming,
October 25-27, 2021, pages 95–102. SCITEPRESS.
Wu, Y., Yang, S., Srivatsa, M., Iyengar, A., and Yan, X.
(2013). Summarizing answer graphs induced by key-
word queries. Proceedings of the VLDB Endowment,
6(14):1774–1785.
Yahya, M. (2016). Question answering and query process-
ing for extended knowledge graphs. page 172.
Yang, S., Xie, Y., Wu, Y., Wu, T., Sun, H., Wu, J., and
Yan, X. (2014). Slq: a user-friendly graph querying
system. pages 893–896, Snowbird Utah USA. SIG-
MOD/PODS’14: International Conference on Man-
agement of Data, ACM. [Online; accessed 2021-03-
09].
Yi, P., Choi, B., Bhowmick, S. S., and Xu, J. (2017). Autog:
a visual query autocompletion framework for graph
databases. The VLDB Journal — The International
Journal on Very Large Data Bases, 26(3):347–372.
Zafar, H., Dubey, M., Lehmann, J., and Demidova, E.
(2020). Iqa: Interactive query construction in seman-
tic question answering systems. Journal of Web Se-
mantics, 64.
KDIR 2022 - 14th International Conference on Knowledge Discovery and Information Retrieval
264
