
Analysis of the Reliability Compliance with Delivery Time
E. Maksimova
a
Russian University of Transport RUT (MIIT), Moscow, Russia
Keywords: Reliability, risks, operational difficulties, delivery time, technological operations.
Abstract: The practical application of the idea of sustainable freight transportation requires improving the methods of
accounting for possible deviations from the technological standards at all stages of the transportation process,
increasing the reliability of meeting the transportation deadlines and assumed contractual obligations. This
article presents an analysis of the reliability of compliance with freight and empty car delivery time based on
a retrospective analysis of statistical data. The article provides an analysis of the number of shipments that
arrived at the stop station past their delivery time, the reasons for freight delays on route and the number of
claims filed, using one of the technological polygons of the transportation process management for a case
study.
1 INTRODUCTION
Railroads are one of the key modes of transportation
worldwide thanks to their unique characteristics, such
as high capacity, safety, reliability, punctuality and
environmental friendliness. By the end of 2019, all
rail systems in the world had about 1.1 million
kilometers of track and transported more than 4.1
trillion passenger-km and 11 trillion ton-km of
freight. However, these systems often suffer from
various malfunctions that are profoundly detrimental
to the efficiency of their production activities (Hong,
2019). Consequently, in recent years the challenges
of how to better protect railway systems and reduce
systemic losses when various disruptions occur have
drawn increasing attention from stakeholders and
researchers.
The efficiency of production activities of transport
companies depends on many factors - the changing
structure of freight flows; competitive advantages
concerning interchangeable types of vehicles;
competition between different private owners;
regional conditions affecting the transportation
process; the presence of restrictions, etc. (Kozlov,
2020). Under current conditions, the train car rolling
stock of operators is often out of sync with the cargo
flows, causing additional shunting and freight work
and often leading to non-compliance with delivery
times.
a
https://orcid.org/0000-0001-6790-3173
Experts estimate that railway stations lose 10-
15% of their productivity due to technological
failures. It is believed that the bottleneck of a
structure is its busiest element. The study
(Timukhina, 2012) presents that the relationship
between the loading of an element and delays it
causes is more complex and ambiguous. Selection of
the elements that cause the greatest vulnerability
should be based on the bottlenecks of a structure or
bottlenecks of a technology.
2 LITERATURE REVIEW
Reliability compliance with delivery time is one of
the most important assets. Various international
studies indicate that the guarantee of reliable delivery
times is a strategic competitive advantage.
Transportation time, as well as the cost of
transportation represent time and money costs in the
global trading system. The study of the reliability of
transportation time compliance is crucial for
understanding the dynamics of time costs, including
in international transportation (Jia, 2020).
The international publications on the importance
of freight transportation reliability are quite few in
number. Reviews of the methods used and the results
obtained in studies of the cost estimation of
transportation time in freight transportation around
94
Maksimova, E.
Analysis of the Reliability Compliance with Delivery Time.
DOI: 10.5220/0011579500003527
In Proceedings of the 1st International Scientific and Practical Conference on Transport: Logistics, Construction, Maintenance, Management (TLC2M 2022), pages 94-99
ISBN: 978-989-758-606-4
Copyright
c
2023 by SCITEPRESS – Science and Technology Publications, Lda. Under CC license (CC BY-NC-ND 4.0)

the world can be found in (Zamparini, 2007; de Jong,
2009; Feo-Valero, 2011; Report for the Ministry of
Infrastructure and the Environment, Significance,
The Hague, 2013). The study (RAND Europe, SEO
and Veldkamp/NIPO, 2004) is one of the first to
present the value of freight transportation reliability
in the form of standard deviation of transportation
time. The key result in (Significance, VU University,
John Bates Services, TNO, NEA, TNS NIPO and
PanelClix, 2013) is that most of the empirical results
of freight reliability assessment are related to the
proportion of shipments that arrive too late
(sometimes with a minimum delay threshold).
The works (Hague Consulting Group, Rotterdam
Transport Centre and NIPO, 1992) discuss the use of
the factor cost method for the cost estimation of
transportation time. It is argued that the study of the
cost estimate of time for freight transportation is
necessary to determine the "marginal time
transportation costs": transportation costs that will
change as a result of changes in transportation time.
It is a derivative of the total logistics cost function of
transportation time. Total logistics costs are
comprised of transportation personnel costs, fuel and
energy costs, vehicle costs, overhead costs, which are
all costs incurred by carriers and transportation
companies, as well as costs of damage to goods,
interest costs on the value of goods during
transportation and the cost of having a safety reserve
(the last three factors directly affecting the
transportation component in the price of goods).
A number of authors consider the use of
mathematical models to assess the reliability of the
transport process and the creation, on their basis, of
appropriate modules in information management
systems. The use of methods to assess and ensure the
reliability of transportation based on business process
modeling is particularly important for increasing the
competitiveness of transport companies in unstable
economic conditions (Kurganov, 2018).
Studies have appeared recently in the field of
reliability of intermodal transportation, in particular
transportation with the use of railway-automotive and
railway-water transport. According to the goals stated
by many countries, by 2030 30% of freight transport
over 300 km should be transferred from road
transport to other, more environmentally friendly
modes of transport. Most importantly, this
assumption applies to rail transport and water
transport. Rail transport has the best chance of taking
over some of the freight traffic in the coming years.
Rail transport, like water transport, has much
more inertia (larger vehicles and ships used for
transportation, longer transportation times, etc.).
Goods transported by these modes of transport tend
to have a lower cost per tonne than goods transported
by road and air, therefore, the transport component in
the price of goods will be relatively small.
The development of rail transportation depends
on its ability to adapt to a number of market
requirements related to transportation time, cost,
flexibility, information flow and reliability of the
production process. Currently, the main obstacle to
development is its low competitiveness, especially in
relation to road transportation. This is mainly
influenced by low flexibility, limited cost-
effectiveness over long distances, and lack of
reliability, manifested mainly in problems with timely
transportation (Zhao, 2020). The bottleneck may be
an underdeveloped railway connection (Roso, 2013),
the low flexibility of rail transport (Behrends, 2015),
the low quality of railway infrastructure, the use of
different information systems, the reluctance to share
information (Kramarz, 2021), the higher priority of
passenger trains over freight trains, the lack of
integration between transportation tasks and terminal
tasks (Hu, 2019). Such limitations reduce the
reliability of the entire transport system.
Transportation services performed with such
restrictions will not be able to meet the requirements
of modern supply chains, which require a high degree
of flow reliability (Elbert, 2017).
3 MATERIALS AND METHODS
Carriers, operators and owners of railway rolling
stock estimate delivery time through the costs of
providing transportation services. If transportation
time were reduced, vehicles and personnel would be
freed up to perform other productive activities,
resulting in savings in vehicles and labor. Greater
reliability means that the carrier and operator can
have confidence when planning transportation. The
results of foreign researchers obtained to date show
that the value of time related to transport services is
indeed more or less equal to the cost of the vehicle
and labor per hour (de Jong, 2009).
For shippers, the valuation of transportation time
is directly related to the goods themselves. It includes
the working capital invested in the goods during the
time required for transportation (especially important
for high-value goods), the potential reduction in value
of perishable goods during transportation, and the
possibility of disruption of the production process due
to lack of resources or inability to deliver due to lack
of inventory. The two latter factors play a significant
role in assessing the reliability of freight
Analysis of the Reliability Compliance with Delivery Time
95
transportation. Shippers with their own rolling stock
evaluate both the costs of transportation proper and
their component in the cost of goods.
Estimation of violation of cargo delivery time
through train delays using the average delay does not
reflect the full picture. The value of delays increases
slower than the risk of their occurrence. In other
words, reducing the risk of delays by half reduces the
cost of delays by less than half. This provision can be
derived from a simple microeconomic model, where
more and more customers choose sufficient margins
to eliminate late delivery and contractual failure, as
the risk of delay increases (Börjesson, 2011). For
small risks of delay, this phenomenon can also be
caused by low planning costs: the higher the risk of
delay, the more customers find it appropriate to make
contingency plans, including overstating the
necessary norms for bringing in cargo and empty
rolling stock, thereby creating additional reserves of
necessary resources.
Every year more than a billion tons of cargo of
various nomenclature are moved through the Russian
railroad network. The Russian Railways Holding
Company sets itself many objectives, among which
are: increasing production and economic efficiency,
scaling up transportation business, and improving
transportation safety and service quality. However,
for various reasons, including through no fault of the
carrier, there are cases of violation of the technology
of organization of the transportation process and
failure to meet deadlines for delivery of cargoes and
empty cars. All technological violations of
manufacturing processes have a direct impact on the
reliability of cargo delivery time - compliance by
railroads (carriers) with obligations to freight owners
in terms of meeting delivery time in accordance with
the accepted contractual obligations. Reliability is
measured as a percentage and reflects the share of
shipments that arrived without violation of delivery
time.
In the carriage of goods, the carrier assumes
responsibility for the safety of cargo en route, as well
as for the performance of other obligations under the
contract of carriage, including, but not limited to, the
delivery of cargo and empty cars on time. In cases
where the carrier has not fulfilled one or more
obligations, the cargo owners are entitled to file a
claim, specifying what clauses of the contract the
carrier violated and the amount of penalty they want
to recover.
In accordance with federal regulations, the
consignee or consignor may file a claim for damages
in the amount of 6% of the freight charge for each day
of delay, but not more than 50% of the total freight
charge. As a rule, cargo owners unreasonably claim
damages without taking into account various factors
beyond carrier's control, such as cases stipulated by
Article 29 of the Statute on Railway Transport of the
Russian Federation. In such cases the carrier invokes
Article 333 of the Civil Code of the Russian
Federation "reduction of forfeit". In 85% of cases
cargo owners' claims are groundless and claims are
rejected. All cases of violation of delivery time are
considered by a special commission - the working
group.
In accordance with the adopted technology the
railway transport has a fairly wide range of reasons
for freight and empty cars delays, while the number
of delays due to the fault of cargo owners or owners
of private tracks amounts to only 1-2% of the total
number. For clarity, the entire list of causes is
summarized in 7 main reasons, among them are the
following:
− delays due to force majeure;
− track occupancy, non-acceptance, demurrage
and accumulation;
− untimely operations and restrictions;
− waiting, refusal, diverting car traffic from the
shortest routes;
− absence of or waiting for a locomotive;
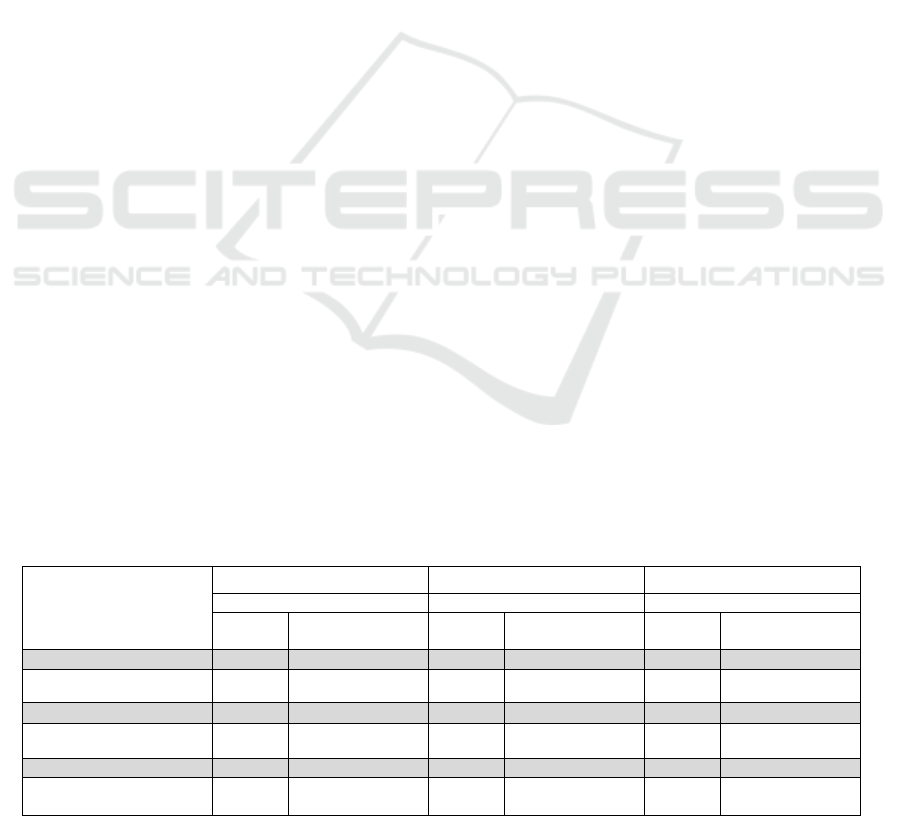
Table 1: Analysis of the reliability of meeting railway delivery time.
Railway
2019 2020 2021
share of shi
p
ments, % share of shi
p
ments, % share of shi
p
ments, %
on
time
with violation
on
time
with violation
on
time
with violation
Okt
y
abrska
y
a 99.00 1.00 99.50 0.50 97.10 2.90
Gorkovskaya 99.30 0.70 99.50 0.50 97.50 2.50
Severnaya 96.60 3.40 99.10 0.90 94.90 5.10
Sverdlovskaya 99.90 0.10 99.60 0.40 97.10 2.90
West Siberian 99.20 0.80 99.90 0.10 99.70 0.30
Average value 98.80 1.20 99.52 0.48 97.26 2.74
TLC2M 2022 - INTERNATIONAL SCIENTIFIC AND PRACTICAL CONFERENCE TLC2M TRANSPORT: LOGISTICS,
CONSTRUCTION, MAINTENANCE, MANAGEMENT
96
− reasons that depend on the cargo owners and
owners of private tracks;
− other reasons.
4 RESULTS AND DISCUSSION
Let us consider the analysis of statistical data on the
number of shipments arriving at the destination
station with a violation of the delivery time, the
reasons for freight delays in transit, the number of
claims for 2019, 2020 and 2021 in the North-West
technological polygon of the transportation process
management. The period under consideration covers
three years, including the year with the most adverse
epidemiological situation, which affected the causes
of delays in transit.
Table 1 shows statistical data on shipments
arriving without and with a violation of the delivery
time and empty cars.
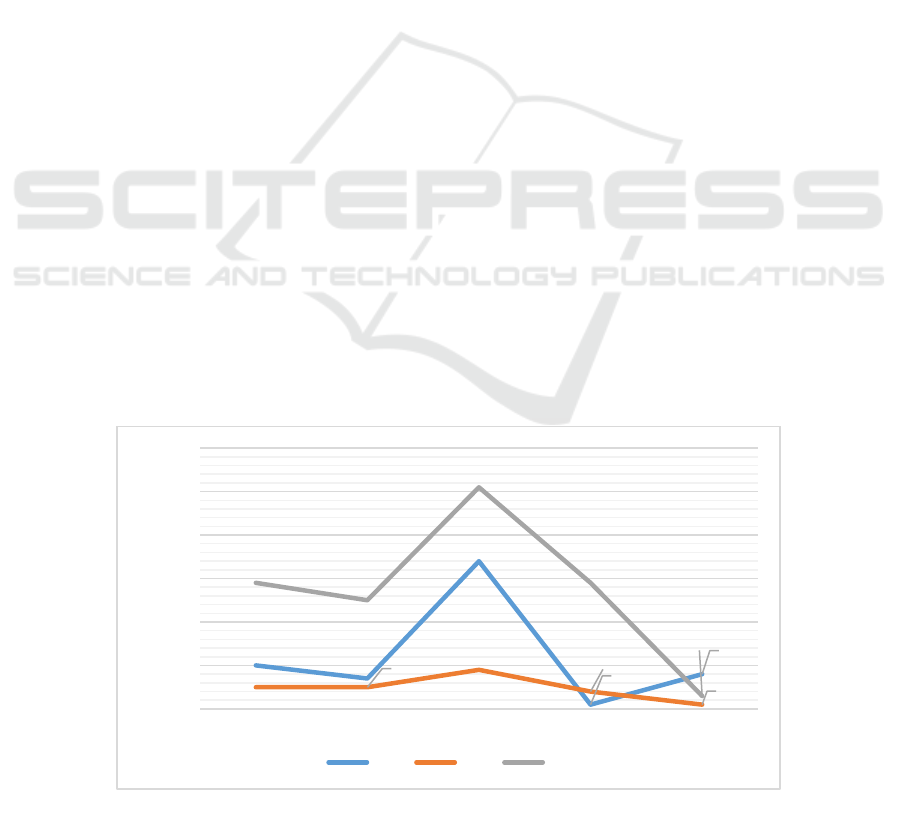
We used Table 1 to plot the dependence of the
reliability index on the roads of the technological
(Figure 1).
The technological polygon of the transportation
process management under consideration has quite a
high level of reliability of delivery of cargo and empty
cars - on average, 98.53% of shipments arrived on
time over three years. As can be seen from the graph,
Severnaya Road has the highest rate of late delivery,
with 94.9% of shipments arriving on time in 2021, the
lowest reliability level in three years. The
Sverdlovskaya (2019) and West Siberian (2020)
Railways have the best reliability indicator (99.9%).
The amount of penalties on claims filed decreased
significantly relative to 2019, by 54.22%, with the
number of complaints filed decreasing as well, by
52.04%. Primarily, this may indicate an increase in
the actual reliability of meeting freight delivery time,
as well as a greater degree of cargo preservation
relative to 2019. Payments of penalties after court
proceedings decreased by 39%.
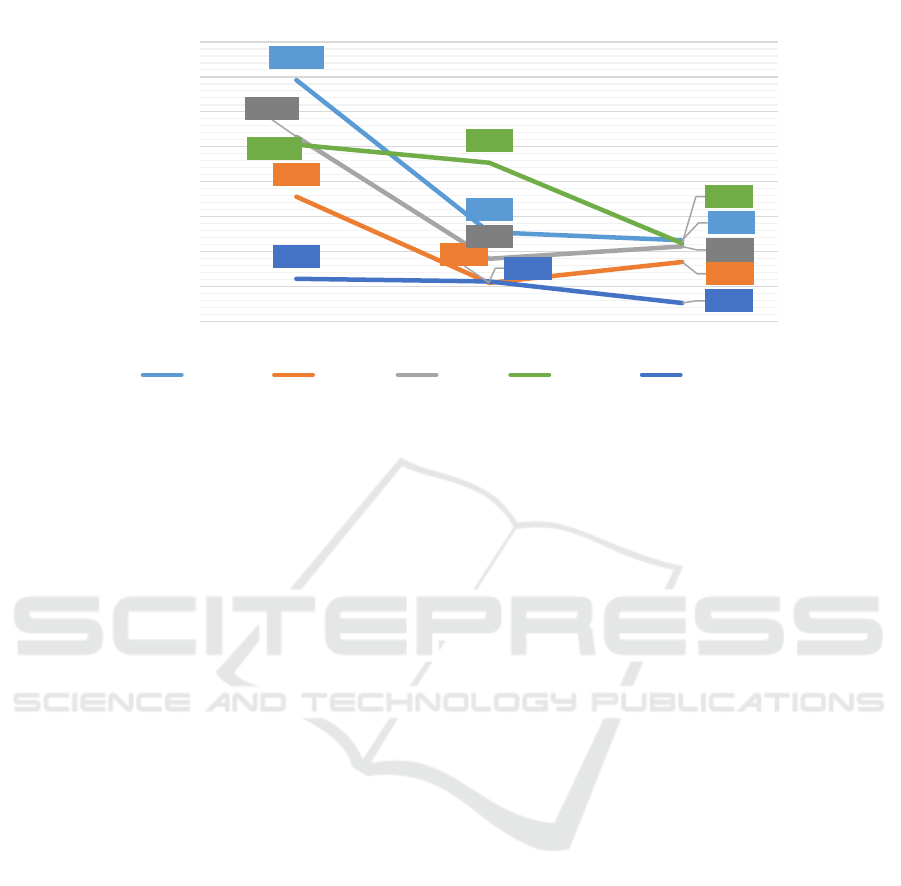
Figure 2 shows the data on the number of
violations of the delivery time for freight and empty
cars by the railways of the technological
transportation polygon of the process management
under consideration.
Despite the high value of the number of claims in
2019, their number decreased on average by 2 times
as early as by 2020, however, by 2021 there is again
a slight increase on the Severnaya, Oktyabrskaya and
Gorky railways. The main problem remains a
distorted reflection of the true causes of delays, which
is the main force holding back the solution of this
problem. The existing systems for monitoring and
determining responsibility for violations of standard
delivery times require a unified technology for
determining the degree of influence of Russian
Railways divisions, consignors, consignees, and
third-party organizations on the permitted causes of
delays in freight shipments in transit.
According to the statistics for the technological
polygon the main reason for failure to meet delivery
time is the absence or waiting for a locomotive - 61%
(506,250 cases), with by delays, track occupancy,
non-acceptance, demurrage and accumulation
ranking second - 15% (121,679 cases), followed by
complaints about untimely operations and rejections,
as well as about waiting, technical equipment failures,
diverting of car traffic from the shortest routes - 8%
each (67,423 and 61,917 cases respectively). The
rarest other reasons are 6% (11,461 cases), as well as
Figure 1: Diagram of dependence of reliability indices.
1
0,7
3,4
0,1
0,8
0,5
0,5
0,9
0,4
0,1
2,9
2,5
5,1
2,9
0,3
0
1
2
3
4
5
6
Oktyabrskaya Gorkovskaya Severnaya Sverdlovskaya West Siberian
Share of shipments arriving with a violation
of the delivery time, %
2019 2020 2021
Analysis of the Reliability Compliance with Delivery Time
97
complaints about force majeure and reasons
dependent on the cargo owners or owners of private
tracks - 1% each (10,961 and 11,461 cases,
respectively).
5 CONCLUSION
Reliability of existing cargo flows, regardless of the
organizational solutions used, along with costs and
time is a priority for all participants of the
transportation process and is one of the important
criteria determining the choice of mode of transport.
Rail transport allows obtaining the effects associated
with the reduction of internal costs of freight
transportation, however, due to the low flexibility,
time and reliability, it is still not sufficiently
competitive with other modes of transport. In order to
improve the reliability of compliance with
transportation times, it is necessary to monitor the
passage of freight and empty cars along the
infrastructure while recording all technological and
temporal deviations of the transportation process
from the established standard values and identifying
those responsible for the violation of technology. For
this purpose, the car-hours of cargo shipments on the
infrastructure need to be recorded, and a forecast of
delivery of cargo and empty freight cars needs to be
generated, taking into account possible deviations
from technological standards at all stages of the
transportation process.
REFERENCES
Hong, L., Ye, B., Yan, H., Zhang, H., Ouyang, M., He, X.
S., 2019. Spatiotemporal vulnerability analysis of
railway systems with heterogeneous train flows,
Transportation Research Part A: Policy and Practice
130, pp. 725-744.
Kozlov, P., Osokin, O., Timukhina, E., Tushin, N., 2020.
Optimization of Fleet Size and Structure While Serving
Given Freight Flows. VIII International Scientific
Siberian Transport Forum. TransSiberia 2019.
Advances in Intelligent Systems and Computing 1116.
Timukhina, E. N., Kashcheeva, N. V., 2012, Functional
reliability - theoretical foundations and calculation
principles. Modern problems of the transport complex
of Russia 2, 1, pp. 98-108.
Jia, H., Lam, J. S. L., Tran, N. K., 2020. Spatial variation of
travel time uncertainty in container shipping,
Transportation Research Procedia, 48, pp. 1740-1749.
Zamparini, L., Reggiani, A., 2007. Freight transport and the
value of travel time savings: a meta-analysis of
empirical studies. Transp. Rev., 27-5, pp. 621-636.
de Jong, G. C., Kouwenhoven, M., Kroes, E. P., Rietveld,
P., Warffemius, P., 2009. Preliminary monetary values
for the reliability of travel times in freight transport.
Eur. J. Transp. Infrastruct. Res., 9 (2), pp. 83-99
Feo-Valero, M., Garcia-Menendez, L., Garrido-Hidalgo,
R., 2011. Valuing freight transport time using transport
demand modelling: a bibliographical review. Transp.
Rev. 201, pp. 1-27
Significance, VU University, John Bates Services, TNO,
NEA, TNS NIPO and PanelClix, 2013. Values of time
and reliability in passenger and freight transport in The
Netherlands. Report for the Ministry of Infrastructure
and the Environment, Significance, The Hague.
Figure 2: Diagram of comparison of the number of violations by railways.
138134
51051
46482
71393
22098
34044
105749
35917
42919
101207
90829
44760
24451
22895
10594
0
20000
40000
60000
80000
100000
120000
140000
160000
2019 2020 2021
The number of violations by railways
Oktyabrskaya Gorkovskaya Severnaya Sverdlovskaya West Siberian
TLC2M 2022 - INTERNATIONAL SCIENTIFIC AND PRACTICAL CONFERENCE TLC2M TRANSPORT: LOGISTICS,
CONSTRUCTION, MAINTENANCE, MANAGEMENT
98

RAND Europe, SEO and Veldkamp/NIPO, 2004.
Hoofdonderzoek naar de reistijdwaardering in het
goederenvervoer, rapport TR-154-AVV voor AVV,
RAND Europe, Leiden.
Hague Consulting Group, Rotterdam Transport Centre and
NIPO, 1992. De reistijdwaardering in het
goederenvervoer, rapport hoofdonderzoek. Rapport
142-1 voor Rijkswaterstaat, Dienst Verkeerskunde,
HCG, Den Haag.
Kurganov, V., Gryaznov, M., Dorofeev, A., 2018.
Management of transportation process reliability based
on an ontological model of an information system,
Transportation Research Procedia, 36, pp. 392-397.
Zhao, J., Zhu, X., Wang, L., 2020. Study on scheme of
outbound railway container organization in rail-water
intermodal transportation. Sustainability, 12 (4), pp. 1-
19.
Roso, V., 2013. Sustainable intermodal transport via dry
ports – Importance of directional development. World
Review of Intermodal Transportation Research, 4 (2/3),
pp. 140-156.
Behrends, S., 2015. The modal shift potential of intermodal
line-trains from a haulier’s perspective: Drivers and
barriers in the mode choice process. World Review of
Intermodal Transportation Research, 5(4), pp. 369-
386.
Kramarz, M., Przybylska, E., Wolny, M., 2021. Reliability
of the intermodal transport network under disrupted
conditions in the rail freight transport, Research in
Transportation Business & Management, 100686.
Hu, Q., Wiegmans, B., Corman, F., Lodewijsk, G., 2019.
Integration of inter-terminal transport and hinterland
rail transport. Flexible Services and Manufacturing
Journal, 31, pp. 807-831.
Elbert, R., Seikovsky, L., 2017. The influences of
behavioral biases barriers and facilitators on the
willingness of forwarders’ decision makers to modal
shift from unimodal road freight transport to intermodal
road-rail freight transport. Journal of Business
Economics, 87 (8), pp. 1083-1123.
Börjesson, M., Eliasson, J., 2011. On the use of “average
delay” as a measure of train reliability, Transportation
Research Part A: Policy and Practice, 45, 3, pp. 171-
184.
Analysis of the Reliability Compliance with Delivery Time
99
