
Dynamic Linkages Between Global Oil Price Volatility and Fertilizer
Stock Indices in China on Pre and During Covid-19 Pandemic
Binlin Li
1*
, Jie Ma
2
and Shitao Wei
1
1
College of Economics and Management Yunnan Agricultural University, Kunming, China
2
College of Economics and Management, East China University of Technology, Nanchang, China
Keywords: Multivariate GARCH, Fertilizer, Oil Price, Covid-19 Pandemic.
Abstract: This study firstly detects the dynamic linkage between WTI oil price and Chinese fertilizer stock indices,
namely potash, phosphorus, and nitrogen fertilizer, respectively. Results indicate a weak long-term
interdependence and the time-varying pathway of connectedness between WTI oil price and fertilizer indices
using a connectedness technique. Then, BEKK, CDCC, and GARCH models are used to display time-varying
changes of dynamic conditional correlations on pre and during Covid-19 pandemic, and a significant increase
of linkage can be identified at the beginning of the pandemic. Finally, response impulse and historical variance
decomposition techniques are employed to analyze the response of fertilizer stock indices from the effect of
the magnitude of oil price. Results help to diversify investment portfolios for investors.
1 INTRODUCTION
The global fertilizer industry has been shocked due to
the effects of the Covid-19 pandemic in many
countries and regions. Because fertilizers are key
nutrients that are beneficial to improve agricultural
productivity and maintain food supply to satisfy
global population growth, we can understand that the
supply security of fertilizer is correlated with the food
security in the globe. Moreover, the oil price has
affected the fertilizer industry because extraction of
phosphate rock and potash, the production of
integrated chemical complexes, transportation, etc.
are greatly impacted by energy use. In past studies,
despite the much literature focusing on the nexus of
oil and major stock indices in the world, the related
empirical research on the nexus of oil price and
fertilizer indices is extremely limited. More
importantly, China is the largest producer and
predominant exporter in the global fertilizer industry,
so it is essential to estimate the dynamic impact of oil
price and fertilizer stock indices to given rise to focus
on detecting the dynamic linkage of oil and fertilizer
stock indices, also provide possible evidence to
facilitate the diversification strategies for investors.
This study contributes to extend previous studies
in several regards. First, this is the first empirical
study to display the time-varying dynamics of WTI
oil price and fertilizer stocks in China, namely potash,
phosphorus, and nitrogen, using the most recent data,
including the pre and during performance Covid-19
pandemic. Second, we use BEKK, CDCC and GO-
GARCH models to display the time-varying
performance of dynamic conditional correlations on
pre and during Covid-19 pandemic. Third, this study
explores the impulse response and historical variance
decomposition analysis to show the shock and impact
of the pandemic.
The remainder of this paper is analyzed as
follows. Section 2 provides the data and preliminary
analysis. Section 3 provides econometric methods.
Section 4 presents the empirical results. Section 5
discusses conclusions.
2 DATA AND PRELIMINARY
TEST
This study uses the closing price data obtained from
Choice system. (http://choice.eastmoney.com/) An
essential
contribution of this study spans the most
recent period from August 4, 2014, to July 23, 2021,
which covers the recent period of pre and during the
Covid-19 pandemic with high fluctuations in global
financial markets due to the pandemic. Daily closing
price returns were calculated by the logarithmic
difference, and all assets return show a characteristic
Li, B., Ma, J. and Wei, S.
Dynamic Linkages between Global Oil Price Volatility and Fertilizer Stock Indices in China on Pre and during Covid-19 Pandemic.
DOI: 10.5220/0011721700003607
In Proceedings of the 1st International Conference on Public Management, Digital Economy and Internet Technology (ICPDI 2022), pages 45-51
ISBN: 978-989-758-620-0
Copyright
c
2023 by SCITEPRESS – Science and Technology Publications, Lda. Under CC license (CC BY-NC-ND 4.0)
45
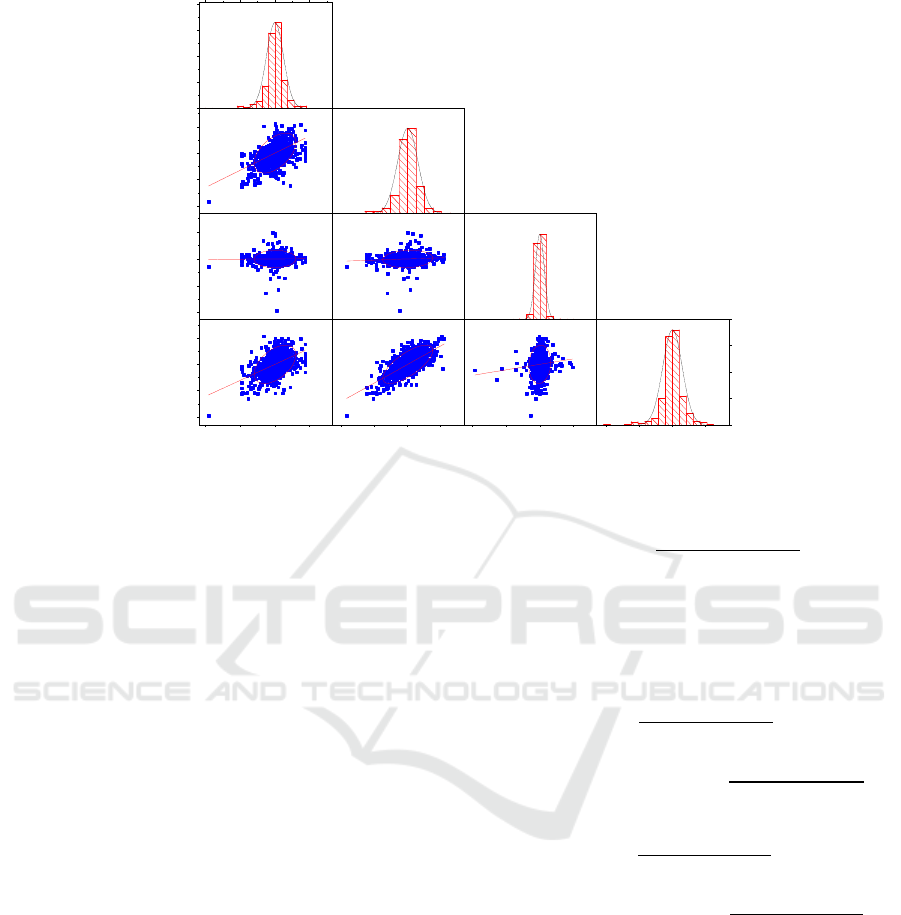
Figure 1: Scatter matrix graph between WTI oil price and Chinese fertilizer stock indices returns.
of more volatile clustering. The results of preliminary
statistics indicate that WTI oil return shows the
highest standard deviations and volatility clustering
pattern. Kurtosis results indicate that all series
probability distributions exist in fat tails, and Jarque-
Bera (J-B) shows a normal distribution does not exist.
Augmented Dickey-Fuller (ADF) test and KPSS test
support all assets series are stationary at/ the 1%
significance. The ARCH-LM (20) test confirms the
ARCH effects for all returns. Fig. 1 visually shows
the correlation of different assets return by using a
scatter-matrix graph. It is observable that a weak
positive correlation exists between oil price and
fertilizer indices, and the highest value exists between
oil price and nitrogen return.
3 ECONOMETRIC METHODS
3.1 Net Pairwise Connectedness
Connectedness technique was proposed by Diebold
and Yilmaz (2012) (Diebold, 2012) to estimate
directional and net connectedness. We only provide a
simple introduction of the method. Detailed
introduction can be seen in many previous studies.
The generalized forecast error variance
decomposition of the H-step ahead error variance in
forecasting the j-th following shocks from the k-th
variable can be expressed as follows:
Θ
𝐻
=
∑
∑
(1)
Θ
(𝐻) captures the contribution of the H-step ahead
error variance.
The directional connectedness received by market
i (or j) from all other markets j (or i) is given by
𝑇𝐷
= 100 ×
∑
Θ
(
𝐻
)
,
∑
Θ
(
𝐻
)
,
= 100 ×
∑
Θ
(
𝐻
)
,
𝑛
(2)
𝑇𝐷
= 100 ×
∑
Θ
(
𝐻
)
,
∑
Θ
(
𝐻
)
,
= 100 ×
∑
Θ
(
𝐻
)
,
𝑛
(3)
Thus, a net connectedness index for variable i can be
identified as
𝑁𝐸𝑆
(
𝐻
)
= 𝑇𝐷
−𝑇𝐷
. (4)
3.2 BEKK, CDCC, and GO-GARCH
Models
Following Ahmad et al. (2018) (Ahmad, 2018), Kang
et al. (2017) (Kang, 2017), and Sadorsky et al. (2014)
(Sadorsky, 2014), we provide the dynamic
conditional correlations depend on BEKK, CDCC,
-0.22 -0.11 0.00 0.11
0
180
360
540
720
potash
potash
-0.156
-0.078
0.000
0.078
Pearson's r=0.51691
nitrogen
nitrogen
-0.50
-0.25
0.00
0.25
Pearson's r=0.01783
oil
Pearson's r=0.09982
oil
-0.22 -0.11 0.00 0.11
-0.192
-0.096
0.000
0.096
Pearson's r=0.50196
phosphorus
potash
-0.156 -0.078 0.000 0.078
Pearson's r=0.73087
nitrogen
-0.50 -0.25 0.00 0.25
Pearson's r=0.09321
oil
-0.192 -0.096 0.000 0.096
0
160
320
480
640
phosphorus
phosphorus
ICPDI 2022 - International Conference on Public Management, Digital Economy and Internet Technology
46
and GOGARCH models. Previous studies have
provided detailed equations, and we introduce a
simple review of methods in the study. Previous
studies have provided a very detailed introduction.
BEKK-GARCH model defines a positive 𝐻
without
imposing an explicit restriction for coefficients. 𝐻
can be indicated by Eq. (1) and construct a diagonal
BEKK by 2 X 2 matrices A and B.
𝐻
= 𝐶
𝐶 + 𝐶
𝑢
𝑢
,
+ 𝐵
𝐻
𝐵
(5)
𝐶 =
𝐶
𝐶
0 𝐶
, 𝐴 =
𝑎
0
0 𝑎
, 𝐵 =
𝑏
0
0 𝑏
(6)
where C denotes an upper triangular of 2 X 2 matrices
An orthogonal method of GO-GARCH model,
assuming the residuals of 𝜀
= 𝑧𝑒
, and z denotes
linear map and 𝑒
is uncorrelated section. the
conditional covariance matrix 𝐻
is given by
𝐻
= 𝑍
𝑍𝐺
(7)
The GO (1, 1) is indicated as:
𝐺
= 𝐶
𝐶 + 𝐴
𝑒
𝑒
,
+ 𝐵
𝐺
𝐵 (8)
Engle (2002) (Engle, 2002) proposed a two-step
procedure of dynamic conditional correlation (DCC)
model. A matrix of conditional correlations 𝛾
can
be shown as:
𝛾
= diag
(
𝜉
∗
)
⁄
𝜉
diag
(
𝜉
∗
)
⁄
, 𝑤𝑖𝑡ℎ 𝜉
∗
= 𝑑𝑖𝑎𝑔
𝜉
.
(9)
𝜉
denotes the symmetric positive-definite matrix
and can be shown as:
𝜉
=
(
1 −𝛼−𝛽
)
𝜉
̅
+ 𝑎𝜀
𝜀
+ 𝑏𝜉
,
with a, b > 0, and a+b<1. (10)
Aielli (2013) (Aielli, 2013) proposed a corrected
version of the correlation process as in Equation (11):
𝜉
=
(
1 −𝛼−𝛽
)
𝑆+ 𝛼(𝜉
∗/
𝜀
𝜀
𝜉
∗/
)+
𝛽𝑄
𝜅
,
𝜅
>0, and 𝜅
+ 𝜅
<1. (11)
4 RESULTS
4.1 Connectedness Analysis
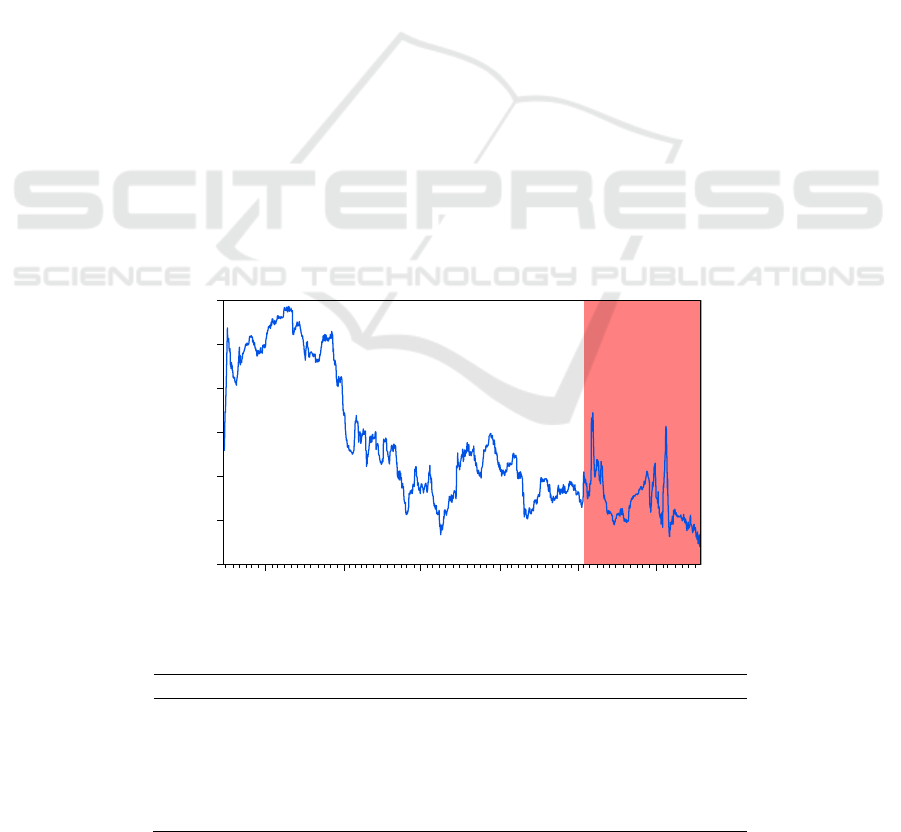
Fig. 2 plots the total connectedness index (TCI) by
employing Diebold and Yilmaz (2012). We calculate
based on a 200-day rolling technique and 10-day
forecasting horizon. The results show that TCI was
22.3% and a weak interdependence between oil and
fertilizer indices, but potash, phosphorus, and
nitrogen stock return seems easily transmitted. From
a time-varying perspective, the TCI shows as high as
30-40% during 2014-2016 then decline rapidly, and
about 22%-36% during the Covid-19 pandemic.
As shown in Table 1, Potash and Phosphorus
stock index contributed the statistically larger of TCI
Figure 2: The dynamics of the total connectedness index.
Table 1: Total connectedness index (TCI) and net pairwise connectedness results.
Oil Potash Phosphorus Nitrogen From
Oil 98.8 0.4 0.6 0.3 1.2
Potash 1.0 97.8 0.5 0.7 2.2
Phosphorus 1.9 25.3 72.2 0.5 27.8
N
itrogen 2.7 26.6 28.8 41.9 58.1
Contribution to. 5.7 52.3 29.9 1.4 89.3
Contribution includin
g
104.4 150.1 102.1 43.3 22.3%
20
24
28
32
36
40
44
2015 2016 2017 2018 2019 2020 2021
Dynamic Linkages between Global Oil Price Volatility and Fertilizer Stock Indices in China on Pre and during Covid-19 Pandemic
47
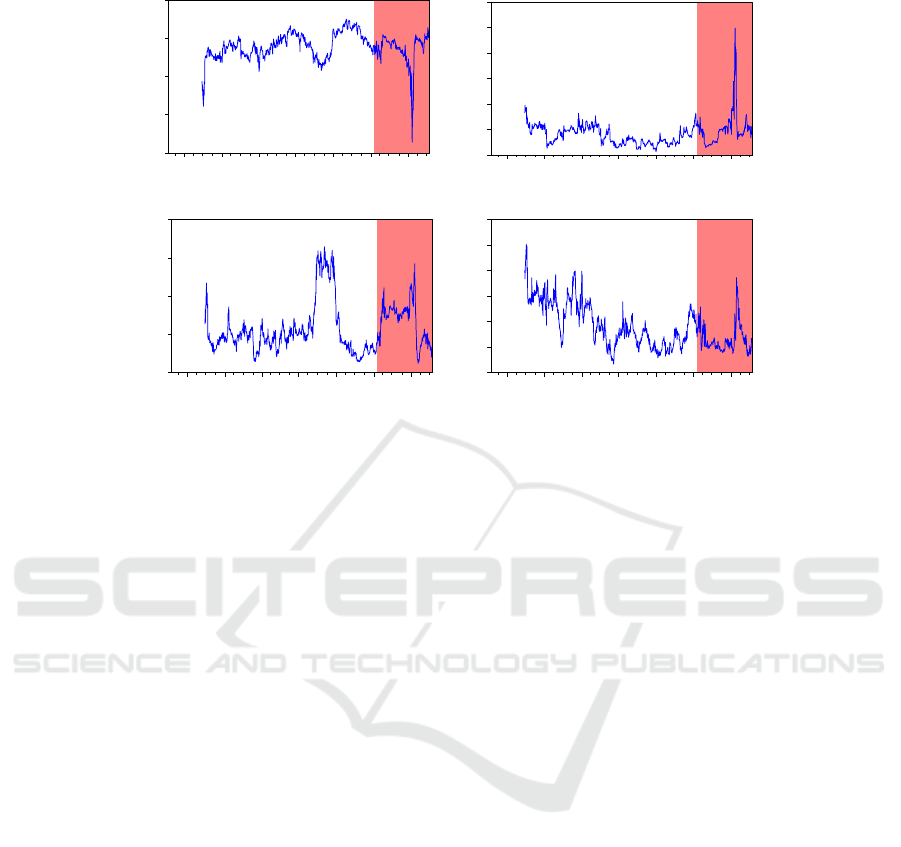
Figure 3: Dynamic pairwise connectedness between WTI oil price and WTI oil price, potash, phosphorus and nitrogen returns
(red shaded area is the period of Covid).
to other assets, with 52.3% and 29.9%, and received
spillovers from others with 2.2% and 27.8%,
respectively. Oil transmitted 5.7% of the shocks to
others and received 1.2% from others, implying oil
return is the net transmitter but weak interconnected
with Chinese fertilizer stock indices. It is worthy to
note that Phosphorus stock index have a important
role during assets. Phosphorus stock index
contributed 29.9% to others, and receive about 27.8%
from others. Nitrogen stock index is the biggest
receiver among all assets, and received 58.1% from
other assets.
The dynamic trajectory of the net pairwise TCI of
WTI oil price and fertilizer indices is indicated in
Fig.3. We can observe that transmission from WTI oil
price to fertilizer stock indices was not highly
influenced.
The pairwise connectedness of oil-phosphorus
and oil-nitrogen have higher performance on the pre-
Covid-19 pandemic, and oil-potash shows the
weakest. During the Covid-19 period, we can observe
that the pairwise connectedness is highly volatile for
all pairs, and the potash stock index is more sensitive
to oil shocks. The findings have implications of
indicating the connectedness of oil and potash stock
s have a significant increase during Covid-19, and
investors can consider possible strategies based on
the time-varying path of the connectedness.
4.2 Dynamic Conditional Correlations
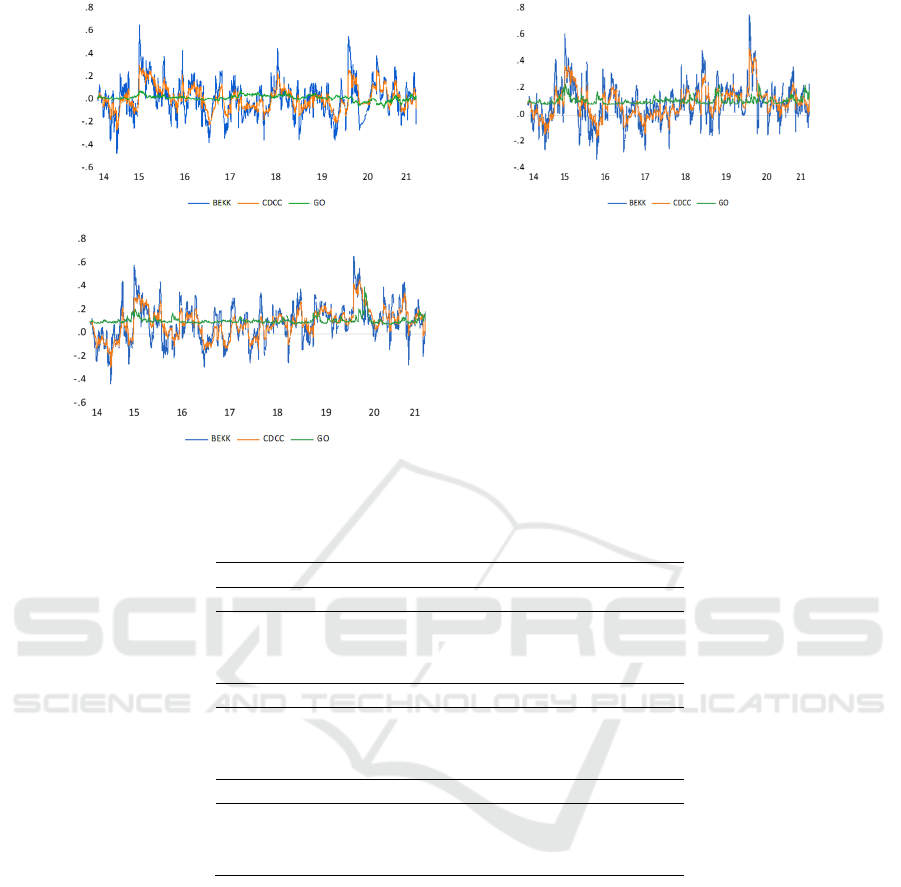
Fig. 4 displays the time-varying changes of dynamic
conditional correlations of WTI oil price and fertilizer
stock indices on pre and during Covid-19 pandemic
by comparing three multivariate GARCH models
(BEKK, CDCC and Go-GARCH).
Overall, the findings confirm there is a weak
integration between WTI oil price and the Chinese
fertilizer industry, implying oil price has a weak
impact on the fertilizer industry in China. Moreover,
BEKK and CDCC-GARCH models have a similar
performance of capturing the co-movements and
dynamic conditional correlations, and the results of
GO-GARCH are significantly different. Most
importantly, during the Covid-19 pandemic, a
significant clustering and increase can be observed
for all pairs, and oil-potash shows a sudden increase.
In the case of the WTI oil price and phosphorus stock
index pair, the conditional correlation stayed more
stable, with an average of 0.147 over the sample
period. The Covid-19 pandemic also increase the
linkage of WTI oil price, and shows a correlation of
0.2. It is observable that the strongest linkage
between oil and phosphorus stock was shown at the
begging of the Covid-19, also implying the sudden
crisis have significant news impact on stock market.
Nitrogen stock index shows a stronger co-movement
with oil price compared to other stock indices. In the
covid-19 period, the correlation is 2 times more than
pre-Covid-19, which is averaged of 0.245.
60
70
80
90
100
14 15 16 17 18 19 20 21
OIL-OIL
0
5
10
15
20
25
30
14 15 16 17 18 19 20 21
OIL-POTASH
0
4
8
12
16
14 15 16 17 18 19 20 21
OIL-PHOSPHORUS
0
2
4
6
8
10
12
14 15 16 17 18 19 20 21
OIL-NITROGEN
ICPDI 2022 - International Conference on Public Management, Digital Economy and Internet Technology
48
WTI oil
p
rice-Potash WTI oil price-Phosphorus
WTI oil price-Nitrogen
Figure 4: Time-varying dynamic conditional correlations of WTI oil price and Chinese fertilizer stocks indices.
Table 2: Mean and average value of the dynamic conditional correlation from different methods.
BEKK CDCC GO Average
Oil-Potash
all 0.011 0.018 0.023 0.026
Pre-Covid 0.000 0.006 0.030 0.018
During Covid 0.047 0.054 -0.004 0.048
Oil-Phosphorus
all 0.090 0.093 0.112 0.147
Pre-Covid 0.076 0.076 0.109 0.131
During Covid 0.135 0.144 0.122 0.200
Oil-Nitrogen
all 0.091 0.091 0.114 0.148
Pre-Covid 0.062 0.062 0.111 0.117
During Covid 0.176 0.185 0.129 0.245
4.3 Impulse Response and Historical
Variance Decomposition
We conduct an impulse response to show the
dynamics of WTI oil price on the Potash, Phosphorus,
and Nitrogen fertilizer index over 10 periods,
respectively. A new technique of bootstrapping with
a 95% confidence interval is used to show the results.
Fig. 5 presents the response of Potash,
Phosphorus, and Nitrogen from WTI oil price to
display the impact of oil shocks. The results indicate
the impact exists shortly for all indexes, and the
impact is relatively weak from WTI oil price. There
is only a positive impact on all fertilizer stock index
from first to third year, and the peak year exists in the
second year. And positive effect from the fourth year,
then gradually decline after the eighth year.
In order to indicate the different performance of
oil price shocks, in the following, we use generalized
weights of historical variance decomposition of
fertilizer stock indices from WTI oil return. The
output is very similar to previous results. The Covid-
19 pandemic has an essential impact on the
correlation of oil and fertilizer stocks. Moreover, it is
observable that the impact is minimal and only exists
at the beginning of the Covid-19 pandemic (See in
Fig.6)
Dynamic Linkages between Global Oil Price Volatility and Fertilizer Stock Indices in China on Pre and during Covid-19 Pandemic
49

WTI oil
p
rice-Potash WTI oil
p
rice-Phos
p
horus
WTI oil
p
rice-Nitro
g
en
Figure 5: Response of Chinese fertilizer stock indices to WTI oil price.
during Covid-19 during Covid-19
during Covi
d
-19
p
re-Covi
d
-19
pre-Covid-19 pre-Covid-19
Figure 6: Historical variance of decompositions of fertilizer stock indices from WTI oil price on pre and during Covid-19
pandemic.
-.001
.000
.001
.002
.003
.004
12345678910
Response of POTASH to OIL
-.002
.000
.002
.004
.006
12345678910
Response o
f
PHOSPHORUS to OIL
-.002
.000
.002
.004
.006
12345678910
Response of NITROGEN to OIL
-.2
-.1
.0
.1
.2
14 15 16 17 18 19
Total stochastic oil
phosphorus
from oil
-.15
-.10
-.05
.00
.05
.10
14 15 16 17 18 19
Total stochastic oil
nitrogen
f
rom oil
ICPDI 2022 - International Conference on Public Management, Digital Economy and Internet Technology
50

5 CONCLUSIONS
The empirical results of the study firstly provide the
evidence to extend previous works of literature to
examine the nexus of WTI oil price and fertilizer
stocks in China. Several conclusions can be obtained.
First, the total connectedness index was 22.3%,
implying a weak interdependence between oil and
fertilizer indices. From a hedging strategy
perspective, it is not an ideal asset to hedge the risk
for energy markets. WTI oil has a fragile impact on
the fluctuations of the others, and the potash stock
index was a significant contributor, and the nitrogen
stock index was a receiver in the long run. Second,
primarily positive dynamic conditional correlations
between the WTI oil price and stock indices were
observable pre and during the Covid-19 period. More
importantly, it can be obtained the Covid-19 had a
significant impact on fertilizer stock indices at the
beginning of the pandemic. Oil-Nitrogen showed a
higher dynamic linkage during the sampling period,
and Oil-Potash showed a weaker performance. The
findings from Impulse response and Historical
variance decomposition analysis also are consistent
with the results. The impact of the Covid-19 on the
nexus of Oil price and fertilizer stock indices only
exists at the beginning of the pandemic, then shows a
rapid decline. The results are beneficial to investors
and portfolio managers to assess risk management to
optimize portfolios if they consider the nexus of the
energy market and fertilizer industry. Moreover,
policymakers can use this analysis to monitor the
changes in energy costs in the fertilizer industry.
ACKNOWLEDGEMENT
This study was conducted with the support of two
projects. Project 71763034 supported by National
Natural Science Foundation of China. Project
2020JY08 supported by YNAU Outstanding Scholar
Project.
REFERENCES
Ahmad, W., P. Sadorsky, and A. Sharma. 2018. Optimal
hedge ratios for clean energy equities. Economic
Modelling 72:278–95. doi:10.1016/j.econmod.
2018.02.008.
Aielli, G. P. 2013. Dynamic conditional correlation: On
properties and estimation. Journal of Business &
Economic Statistics 31 (3):282–99. doi:10.1080
/07350015.2013.771027.
Diebold, F. X., and K. Yilmaz. 2012. Better to give than to
receive: Predictive directional measurement of
volatility spillovers. International Journal of
Forecasting 28(1):57–66. doi:10.1016/j.ijforecast.
2011.02.006.
Engle, R. 2002. Dynamic conditional correlation. Journal
of Business & Economic Statistics 20 (3):339–50.
doi:10.1198/073500102288618487.
Kang, S. H., R. Mciver, and S.-M. Yoon. 2017. Dynamic
spillover effects among crude oil, precious metal, and
agricultural commodity futures markets. Energy
Economics 62:19–32. doi:10.1016/j.eneco.2016.
12.011.
Sadorsky, P. 2014. Modeling volatility and correlations
between emerging market stock prices and the prices of
copper, oil and wheat. Energy Economics 43:72–81.
doi:10.1016/j.eneco.2014.02.014.
Dynamic Linkages between Global Oil Price Volatility and Fertilizer Stock Indices in China on Pre and during Covid-19 Pandemic
51
