
Analysis on the Determining Factors of International Tourism in New
Zealand: Optimisation of Computer-based Algorithmic Linear
Regression Model
Hewei
Chang
Surrey International Institute, Dongbei University of Finance and Economics, China
Keywords: International Tourism, New Zealand, Linear Regression Model, The Elasticity of Demand.
Abstract: Scientific tourism management is becoming increasingly significant. Hence, this paper utilizes computer-
optimized methods to ensure and analyse the several factors influencing the demand for international tourism
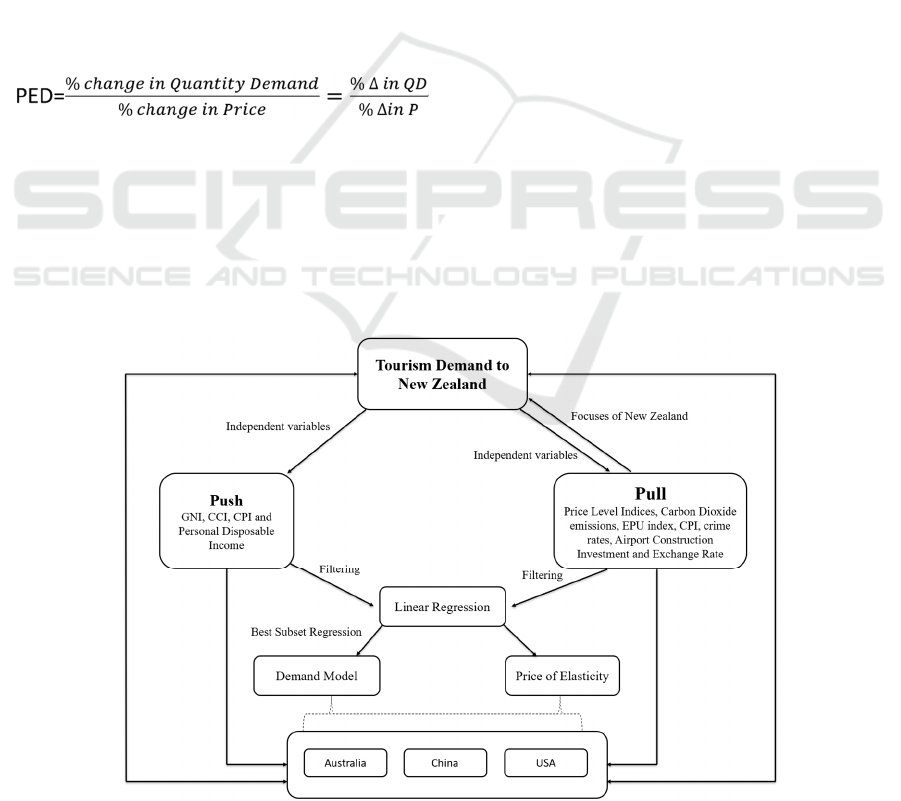
in New Zealand from macro and microeconomic perspectives. Moreover, this paper utilizes the 'push' and
'pull' theory with variables from the country of origin as push factors and variables from the destination
country as pull factors. Then, data related to the top three source countries from 2009 to 2018 is selected, and
Minitab are utilized for correlation analysis, the best subset, and a linear regression equation so that price
elasticities of demand are calculated for the variables relating to each of the top three sources countries. The
price elasticity of demand is used to show pull factors for stakeholders in the tourism industry and to promote
sustainable international tourism development in New Zealand.
1 INTRODUCTION
Tourism has become a fast-growing and
interconnected branch of the economy (Bunghez,
2016), especially inbound tourism (Li et al., 2018).
Given the positive economic contribution of
international tourists, investigating the influence of
variable factors on the demand of international
tourists and applying them to guide the improvement
of the inbound tourism strategy is vital.
This paper uses the push-pull theory in tourism to
explain how factors in source and destination
countries affect international. By arranging the
literature from both macroeconomic and
microeconomic perspectives, several variables are
identified that can potentially affect tourist arrivals in
New Zealand. Then by establishing a linear
regression equation to study the correlation and
elasticity of various variables with the number of
inbound tourists to New Zealand, the paper explores
the sensitivity between the relative changes in
tourism demand and impact indicators such as price
(Peng et al., 2015).
This study selects New Zealand as the destination.
Among tourist source countries, Australia, China,
and The United States are the top three ones from
2009 to 2018. Tourism has been a major driver of
economic growth in New Zealand (Shu et al., 2014).
Modelling the influencing factors of tourism demand
fosters the growth momentum of the industry in New
Zealand (Pham et al., 2017).
2 LITERATURE REVIEW
2.1 Variables
Demand stems from economics, including desire and
purchasing power. In the tourism industry, it is
considered to be a measure of the use of a commodity
or service by tourists (Frechtling, 2001). Namely, the
factors affecting the demand for international
inbound tourism influence consumers' judgment and
choice of destinations, which is implied in the
number of arrivals.
In economics, price is one of them, which can be
reflected by the Consumer Price Index (CPI). CPI of
destination and competitive countries are both
crucial. Australia is the latter one. There is a spillover
effect on tourism demand in Australia and New
Zealand (Balli and Tsui, 2016). Spillover effects refer
to an organization's performance of an activity, which
produces the expected effect of the activity, and
unexpected one outside the organization (Li et al.,
588
Chang, H.
Analysis on the Determining Factors of International Tourism in New Zealand Optimisation of Computer-Based Algorithmic Linear Regression Model.
DOI: 10.5220/0011752500003607
In Proceedings of the 1st International Conference on Public Management, Digital Economy and Internet Technology (ICPDI 2022), pages 588-595
ISBN: 978-989-758-620-0
Copyright
c
2023 by SCITEPRESS – Science and Technology Publications, Lda. Under CC license (CC BY-NC-ND 4.0)

2011). The demand for inbound tourists from New
Zealand can be affected by the Australian tourism
demand factors. Therefore, there may be
complementary or substitutional relationships
between other source countries’ tourism demand for
New Zealand and Australia.
The Exchange rate is an important factor.
Fluctuations in exchange rates dominate changes in
overall relative tourism prices over time (Chang, Hsu,
and McAleer, 2013). Personal disposable income
(PDI) can be used as an index of reflected income and
consuming ability; Gross National Income (GNI) has
a significant impact on a country's international
tourism demand (Khoshnevis and Khanalizadeh,
2017). According to OECD, GNI is based on GDP.
Therefore, GNI and GDP are selected as variables in
this paper; The Consumer Confidence Index (CCI) is
a measure of the attitude of consumers about their
expected financial situation (Dominitz and Charles,
2004), so CCI can affect the travel demand of
consumers by predicting their future income (Easaw,
Garratt, and Heravi, 2005); The Economic policy
uncertainties (EPU) index reflects the uncertainty of
the country's overall economy (Tsui et al., 2018). It
can affect visitors’ confidence in trade and business
activities, thus influencing the demand for business
travel (Tsui et al., 2018); Additionally, price level
indices are the proportion of purchasing power parity
to the market exchange rate. It can identify the
stability of the economic environment in the
destination, which customers care about.
The development of air infrastructure can make it
easier for tourists to reach their destinations (Kanwal
et al., 2020), so people may consider it before
traveling; The increase in crime rate causes
destinations to be troubled by the negative image,
causing the number of tourists to drop significantly
(Lorde and Jackman, 2013); Carbon emissions
reduce the visiting of tourists with a strong awareness
of sustainable development (Chen, Lin, and Hsu,
2017).
2.2 Push and Pull Theory
The mentioned factors can play an important role as
motivations in consumer behavior when deciding on
a destination. The push and pull framework is a valid
approach to testing tourist behavior in tourism theory
(Chen and Chen, 2015). The 'push-pull theory' was
initially one of the key theories in the study of mobile
populations and migration. Gradually, it has been
applied by scholars to study the push and pull factors
that influence tourists' choice of destination, as it is
an efficient way to explain tourists' choice of
destination. In tourism, push factors are understood
as what tourists will choose one place over another.
They are primarily demand-side. Those considered in
this study are GNI, CCI, and PDI in source countries.
Pull factors such as features, attractions, or attributes
of the destination itself. It is primarily an external
factor and belongs to the supply side (Prayag and
Ryan, 2011). They are price level indices, carbon
dioxide emissions, EPU index, CPI, crime rate,
airport construction investment, and exchange rate in
New Zealand.
2.3 Price Elasticity of Demand
Calculating the elasticity of demand for these factors
can better reflect the degree of influence. For
example, the price elasticity of demand at the
destination, the price elasticity of substitution in a
competitive market, and the income elasticity. From
this, the percentage change of the corresponding
independent variable caused by every 1% change in
demand can be analyzed (Tribe, 2020). This has
important implications for the marketing strategy,
pricing, and future tourism demand for destination
tourism products and services (Konovalova and
Vidishcheva, 2013).
3 DATA SOURCES
3.1 Dependent Variables
Tourism demand in the study is shown by the number
of arrivals, including all visitor numbers as well as
arrivals from the top three source countries.
3.2 Independent Variables
In this study, independent variables include price
level indices, investment and maintenance in air
infrastructure, crime rate, three source countries’
GNI, exchange rate, PDI, and CPI- New Zealand,
CPI-Australia, EPU index, and carbon dioxide
emissions.
4 METHODOLOGY
Tourism demand elasticity is a unitless measure of
the sensitivity of tourism demand to changes in
relevant factors (Song et al., 2010), which is simply a
measure of how tourism demand varies with changes
in its influencing factors. The study of tourism
Analysis on the Determining Factors of International Tourism in New Zealand Optimisation of Computer-Based Algorithmic Linear
Regression Model
589
demand elasticity has two main implications: 1. to
understand the changes in tourist tourism demand by
each influencing factor. 2. to assist the destination to
adjust the prices of tourism products and marketing
strategies to maximize revenue based on the results
of this study (Tang and Chen, 2017). If the price of
the destination decreases, tourists' income is
sufficient to purchase and enjoy more tourism
products, but the demand for tourism products in
alternative countries will reduce because they lose
price competitiveness. These two changes are called
the income effect and substitution effect respectively
(Song, et al., 2010). These two effects can be implied
from the values of income and price elasticities in the
demand function. Hence, this paper uses correlation
and regression analysis to analyse the sensitivity of
New Zealand’s inbound tourism demand to changes
in the influencing factors in the Australian, US, and
Chinese markets from the perspective of demand
elasticity. The elasticity of demand is expressed as
follows:
In this paper, the New Zealand arrivals from
Australia, China, and the USA are used as the
dependent variable (Y) respectively. The multiple
linear regression analysis is used to explore the
factors influencing the demand for inbound tourism
in New Zealand and to establish independent
regression equations for the three source countries.
Independent variables such as GNI, CPI, and PDI are
expressed as X
1
, X
2
, X
3
...... are expressed and the
linear model expressions are as follows.
Y=a+ b
1
X
1
+ b
2
X
2
+…+b
n
X
n
Firstly, the study uses Minitab software to
perform correlation analysis for each variable and
screened out the variables with r values greater than
0.8. The independent and dependent variables with
strong correlations were then calculated using
stepwise regression. Although the results obtained
were a good fit, some factors that are highly
correlated in the relevant literature did not enter the
equation. Because this is a purely statistical
screening, the ‘potential’ explanatory power of many
independent variables may be wasted. Therefore, to
fully utilize and analyze all independent variables,
the paper concludes with a method to select the best
subset for the study. Since there was a problem of
excessive covariance in the first equation
establishment, individual variables were excluded
and then regressed. The equations obtained afterward
fit well, and the adjusted r-squared is above 90%, the
equation has passed the F test, P test, and Chi-square
test, proving that the equations meet the requirements
of linear regression.
5 RESULTS
The correlation analysis results are shown in the
following tables by Minitab.
Figure 1: Conceptual Model Diagram.
ICPDI 2022 - International Conference on Public Management, Digital Economy and Internet Technology
590
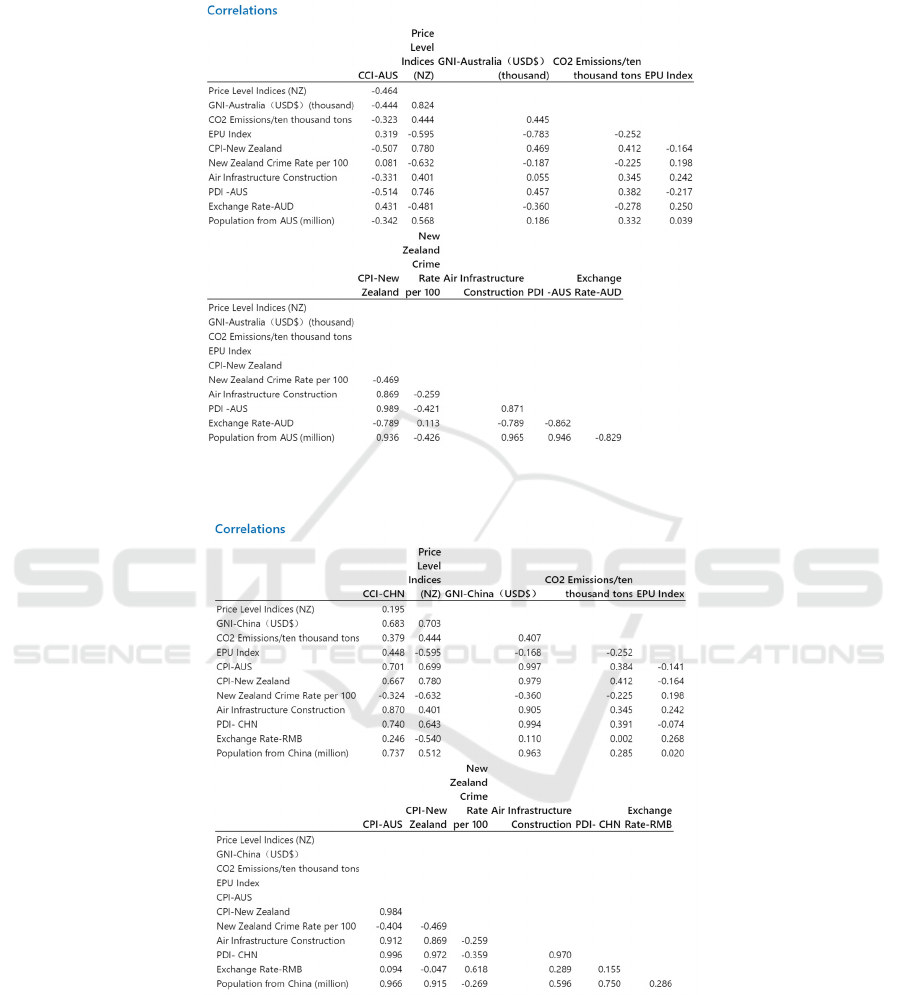
Table 1: Correlations of variables of Australia.
AUS
Table 2: Correlations of variables of China.
China
Analysis on the Determining Factors of International Tourism in New Zealand Optimisation of Computer-Based Algorithmic Linear
Regression Model
591

Table 3: Correlations of variables of United States.
USA
After correlation analysis, several factors which are
correlated with the three countries’ tourism demand
are selected in the following table.
Table 4: Factors correlated with tourism demand.
Australia CPI-
New
Zealand
Investment
and
Maintenance
in Airport
Infrastructure
Disposable
Income-
USA
China GNI-
China
CPI-New
Zealand
CPI-AUS Investment in
Air
Infrastructure
Personal
Disposable
Income-
CHN
United
States
CCI-
USA
GNI-USA CPI-AUS Investment in
Air
Infrastructure
Personal
Disposable
Income-
USA
Price of Elasticity of Demand
After using best subset, factors that can significantly
affect tourism demand are selected and then the linear
regression is shown, which has been checked.
1. For the Australian Market:
(1) The Demand Model is below:
Quantity demanded
x
= 2.31+ 1.251*Disposable
Income- AUS+ 8.03* Investment and Maintenance in
Air Infrastructure
After calculating: Quantity demanded
x
=
14,927,948
(2) The Formula needed to Calculate Elasticity:
Price Elasticity of Demand = beta *
Price
Quantity
Results of price elasticity of demand:
Quantity demanded: Price Elasticity of Demand=
0.844
D
x
: Price Elasticity of Demand = 0.104
I
x
: Price Elasticity of Demand = 0.297
2. For the China Market:
(1) The demand model is below:
Quantity demanded
x
= −1.913+ 3.84 * Investment
and Maintenance in Air Infrastructure +0.1385 *
Personal Disposable Income- CHN
After calculating: Quantity demanded
x
=
3,000,088
(2) The formula needed to calculate elasticity:
Price Elasticity of Demand = beta *
Price
Quantity
Results of price elasticity of demand:
Quantity demanded: Price Elasticity of Demand=
0.581
I
x
: Price Elasticity of Demand = 1.056
P
x
: Price Elasticity of Demand = 1.666
3. For the USA Market:
(1) The demand model is below:
Quantity demanded
x
= 5.51+0.0988* CPI-AUS +
5.21* Investment and Maintenance in Air
Infrastructure + 0.119* GNI-USA
After calculating: Quantity demanded
x
=
2,762,046
(2) The formula needed to Calculate Elasticity:
Price Elasticity of Demand = beta *
Price
Quantity
Results of price elasticity of demand:
Quantity demanded: Price Elasticity of Demand=
0.614
C
x
: Price Elasticity of Demand = 3.206
ICPDI 2022 - International Conference on Public Management, Digital Economy and Internet Technology
592

I
x
: Price Elasticity of Demand = 0.494
G
x
: Price Elasticity of Demand= 2.089
6 DISCUSSION
6.1 PDI
From the obtained elasticity results (1.666), China’s
demand responds to the change in PDI positively.
The elasticity is greater than 1, indicating that the
growth rate of demand is greater than the growth rate
of income. That means New Zealand tourism is a
luxury for Chinese tourists. Such change in
consumers' propensity to consume due to a change in
income is consistent with the income effect in
economics (Jiang and Tang, 2001). In the push and
pull theory, it is regarded as a pull factor to drive
tourists to travel to New Zealand.
6.2 GNI
Based on the results, it can be found that the USA’s
per capita GNI elasticity is 2.089, which means that
the per capita national income of the USA has a
greater impact on the outbound tourism of USA
residents to New Zealand. However, The United
States is a developed country, and traveling abroad is
not a luxury consumption activity for its residents.
This is an interesting finding given that USA GNI is
not supposed to have much impact on outbound
tourism demand.
6.3 CPI
The elasticity of demand of Australia's CPI to the
USA is 3.206, which shows that Australia's CPI
greatly affects Americans' demand for New Zealand
travel. the positive cross elasticity means Australia
and New Zealand are substitute countries for visitors
from America. From the perspective of the
substitution effect, if tourists have lower spending
power than before in Australia, they tend to reduce
demand and increase tourism demand for alternative
New Zealand. From the perspective of income effect,
that means a decrease in the relative income of
tourists, so they will reduce tourism demand,
including in New Zealand. However, the substitution
effect outweighs the income effect, so demand in
New Zealand rises. When Australia's CPI grows, the
USA tends to increase tourism demand in New
Zealand.
6.4 Investment and Maintenance in Air
Infrastructure
The price of elasticity of Australia’s demand is the
least among the three countries. Aviation traffic has
been developed and convenient, and the current
condition has been able to meet the entry demand of
New Zealand tourists (Duval, 2013). The
maintenance and upgrade of the airport facilities will
not affect their entry. As a result, there is little
elasticity.
However, the figure of China is 1.056, which is
relatively elastic. According to this, Chinese tourists
are sensitive to airport infrastructure investment.
Investment in airport infrastructure can increase
passenger traffic, provide more services, and increase
airfares (Eugenio-Martin, 2016). Due to the small
number of flights between New Zealand and China,
it is difficult to meet the increasing demand from
China (Ozer, Balli, and Tsui, 2018). Thus, an increase
in airport accessibility can pull significant increasing
Chinese tourism demand. As air traffic between the
two countries matures, the index may become less in
the future.
The price elasticity of demand in the USA is equal
to 0.494, which is inelastic. One of the reasons is that
America is more accessible to New Zealand than
China. Additionally, due to their higher PDI, USA
travellers are less sensitive to the increased airfare
caused by the investment in air infrastructure than
Chinese travellers (Schiff and Becken, 2011).
Therefore, the pulling power is not as strong as that
of the Chinese.
Overall, the elasticity of demand for long-
distance transportation is greater than that for short-
distance transportation. It can be attributed that
people traveling long distances have higher
requirements for service and put more emphasis on
the convenience of air infrastructure (Wu et al.,
2020). Therefore, China and USA pay more attention
to air investment and construction than Australia.
7 CONCLUSIONS
This study mainly uses the push-pull theory to study
the influencing factors and price elasticity of
Australia, China, and the United States' demand for
New Zealand's international tourism. Research shows
that Australia and China are less price-sensitive,
while the US is more resilient. Changes in PDI and
CPI will also have a greater impact on New Zealand's
inbound tourism demand. In addition, due to the
special geographical location of New Zealand,
Analysis on the Determining Factors of International Tourism in New Zealand Optimisation of Computer-Based Algorithmic Linear
Regression Model
593

aviation infrastructure will directly affect the number
of arrivals, so air services should be improved.
This study only considers economic and
environmental factors and does not consider political
and cultural factors, which may affect international
tourism (Cheung and Saha, 2015). Beyond that, the
findings of this study are not generalizable because
the research only collects tourism data from New
Zealand for 10 years, and the short-term fluctuations
and lags of variables are not observable (Nghiem,
Pham, and Dwyer, 2017). Therefore, there may be
errors between the findings and the actual situation.
REFERENCES
Bunghez, C. L. (2016) ‘The importance of tourism to a
destination’s economy, Journal of Eastern Europe
Research in Business and Economics 2016(1) pp. 1-9.
doi.10.5171/2016.143495
Balli, F. and Tsui, W. H. K. (2016) ‘Tourism Demand
Spillovers between Australia and New Zealand:
Evidence from the Partner Countries’, Journal of travel
research 55 (6), pp. 804–812
doi.10.1177/0047287515569778
Chang C-L, Hsu H-K, and McAleer, M. (2013) ‘Is small
beautiful? Size effects of volatility spillovers for firm
performance and exchange rates in tourism’, The North
American Journal of Economics and Finance 26(1) pp.
519–534.
Chen, C. M., Lin, Y. L., and Hsu, C. L. (2017) ‘Does air
pollution drive away tourists? A case study of the Sun
Moon Lake National Scenic Area’, Taiwan.
Transportation Research Part D: Transport and
Environment 53(1) pp. 398-
402.doi.org/10.1016/j.trd.2017.04.028.
Chen, L.-J. and Chen, W.-P. (2015) ‘Push-pull factors in
international birders’ travel’, Tourism Management
48(2) pp. 416–425.
Cheung, Y. H. (Yh) and Saha, S. (2015) Exploring the Nexus
Between Tourism Demand and Cultural Similarity.
Tourism analysis. [Online] 20 (2), 229–241. (Accessed:
13
th
Apr 2022)
Dominitz, J. and Charles, F. M. (2004) ‘How Should We
Measure Consumer Confidence?’, Journal of Economic
Perspectives 18(2) pp. 51-66.
Duval, D.T. (2013) ‘Critical Issues in Air Transport and
Tourism, Tourism Geographies 15(3) pp. 494–510.
Easaw, J.Z., Garratt, D. and Heravi, S.M. (2005) ‘Does
consumer sentiment accurately forecast UK household
consumption? Are there any comparisons to be made
with the US?’, Journal of Macroeconomics 27 (3)
pp.517-32?
Eugenio-Martin, J. L. (2016) ‘Estimating the Tourism
Demand Impact of Public Infrastructure Investment:
The Case of Malaga Airport Expansion’, Tourism
Economics 22(2) pp. 254–268.
Frechtling, D. C. (2001) Forecasting tourism demand
methods and strategies Oxford: Butterworth-
Heinemann.
Jiang, H., and Tang Y. E. (2001) ‘Research on Price
Elasticity of Demand in Tourism Economy’, Journal of
Beijing International Studies University 1(3) pp. 1-6.
Khoshnevis, Y. S. and Khanalizadeh, B. (2017) ‘Tourism
demand: a panel data approach, Current issues in
tourism, 20 (8), pp. 787–800.
Kanwal, S., Rasheed, M. I., Pitafi, A. H., Pitafi, A., and
Ren, Minglun (2020) ‘Road and transport
infrastructure development and community support for
tourism: The role of perceived benefits, and community
satisfaction, Tourism management (1982) doi.10.1016
/j.tourman.2019.104014.
Konovalova, A.A., and Vidishcheva, V.E. (2013)
‘Elasticity of Demand in Tourism and Hospitality,
European Journal of Economic Studies, 4(2), pp. 84-89
(Accessed on 10
th
Apr 2021).
Li, K. X., Jin, M. and Shi, W. (2018) ‘Tourism as an
important impetus to promoting economic growth: A
critical review’, Tourism management perspectives,
26(1) pp. 135–142 doi.10.1016/j.tmp.2017.10.002.
Li, S., Min, X., Kun, Z., Jing, W., and Zheng, W. (2011).
‘Measuring Tourism Spillover Effects among Cities:
Improvement of the Gap Model and a Case Study of the
Yangtze River Delta’, Journal of China Tourism
Research, 7 (2), pp. 184-206.
Lorde, T. and Jackman, M. (2013) ‘Evaluating the Impact
of Crime on Tourism in Barbados: A Transfer Function
Approach’, Tourism analysis 18 (2) pp. 183–191.
Ozer, B.H., Balli, F. and Tsui, W.H.K. (2018)
‘International tourism demand, number of airline seats
and trade triangle: Evidence from New Zealand
partners’, Tourism Economics 25(1) pp. 132–144.
Peng, B., Song, H., Crouch, G. I. and Witt, S. F. (2015) ‘A
Meta-Analysis of International Tourism Demand
Elasticities’, Journal of travel research 54 (5) pp. 611–
633. doi.10.1177/0047287514528283.
Pham, T. D., Nghiem, S., and Dwyer, L. (2017) ‘The
determinants of Chinese visitors to Australia: A dynamic
demand analysis’, Tourism management (1982) 63268–
276.DOI: 10.1016/j.tourman.2017.06 .015.
Prayag, G. and Ryan, C. (2011) ‘The relationship between
the ‘push’ and ‘pull’ factors of a tourist destination: the
role of nationality – an analytical-qualitative research
approach, Current Issues in Tourism, 14(2) pp. 121–143.
Pham, T. D., Nghiem, S., and Dwyer, L. (2017) ‘The
determinants of Chinese visitors to Australia: A dynamic
demand analysis’, Tourism management (1982) 63268–
276.DOI: 10.1016/j.tourman.2017 .06.015.
Shu, M. H., Hung, W. J., Nguyen, T. L., Hsu, B. M., and
Lu, C. (2014) ‘Forecasting with Fourier residual
modified ARIMA model-An empirical case of inbound
tourism demand in New Zealand’, WSEAS
Transactions on Mathematics 13(1) pp. 12-21.
Song, H., Kim J. H. and Yang, S. (2010) ‘Confidence
intervals for tourism demand elasticity, Annals of
Tourism Research 37(2) pp. 377-396.
ICPDI 2022 - International Conference on Public Management, Digital Economy and Internet Technology
594

Schiff, A. and Becken, S. (2011) ‘Demand elasticity
estimates for New Zealand tourism’, Tourism
Management 32(3) pp. 564–575.
Tsui, W.H.K, Balli, F., Tan, D. T. W., Lau, O., and Hasan,
M. (2018) ‘New Zealand business tourism: Exploring
the impact of economic policy uncertainties’, Tourism
economics: the business and finance of tourism and
recreation 24 (4) pp. 386–417.
Tsui, W. H. K., Chow, C. K. W., Lin, Yi-Hsin, and Chen,
Po-Lu. (2021) ‘Econometric analysis of factors
influencing Chinese tourist visits to New Zealand’,
Tourism management perspectives 39(1) pp. 1-14
doi.10.1016/j.tmp.2021.100861.
Tribe, J. (2020) The economics of recreation, leisure, and
tourism. 6th and. Published by Routledge.
Tang, J. C., Chen, S. Q., (2017) ‘Estimating the elasticity
of China's inbound tourism demand based on an error
correction model’, Tourism Science 31(5) pp. 65-81.
doi.10.16323/j.cnki.like.2017.05.005.
Wu, N., Wang, Y.T., Tan, C.Y. and Zhou, G. (2020) A
study on the psychology and Service Demand of long-
haul Flight passengers. Available at:
https://xueshu.baidu.com/usercenter/paper/show?pap
erid=205e4e5bdd37ebc59317f67d335104ca
Analysis on the Determining Factors of International Tourism in New Zealand Optimisation of Computer-Based Algorithmic Linear
Regression Model
595
