
Designing and Creating Expert Advisor on Forex Based on Moving
Average Indicator Moving Average Indicators Using Martingale
System
Muhammad Farman Andrijasa
1a
, Anton Topadang
1
, Dwi Suprat Tandi
1
, Saiful Adli Ismail
2
and Norulhusna Ahmad
2b
1
Information of Technology, State Polytechnic of Samarinda, Cipto Mangun Kusomo Street, Samarinda, Indonesia
2
Razak Faculty of Technology and Informatics, Universiti Teknologi Malaysia, Kuala Lumpur, Malaysia
Keywords: Expert Advisor (EA), Forex, Metatrader, Moving Average, Martingale.
Abstract: The foreign exchange market is a form of a futures market where sellers and buyers of foreign exchange meet.
Although it is not tangible like the market that is commonly found, although only online this market is a large
capital market and has a physical office even though this market is online this market has problems that can
interfere with the comfort and stability of profits when trading manually in the forex market, namely lack
experience, psychological pressure, overconfidence, impatience, not being patient looking for opportunities,
carried away emotions, and also traders who have to be constantly in front of the computer to maintain and
always control the market situation. The creation of software contains a trading system using moving average
indicators using the martingale system. This software is made in the Meta Editor application which uses the
MQL language as its programming language which tends to be similar to the C++ language. Later this
application can run on the MetaTrader4 application. The expert advisors applied are expected to help traders
and be useful to facilitate trader performance to make it more effective and efficient to carry out trading
activities on the forex market. The created Expert Advisor has been tested in 2021 in EURUSD currency in
the M30 timeframe. The created application can make a profit of 57% of the value of the initial deposit.
1 INTRODUCTION
Forex investment is one of the lucrative business
lands because the level of return is very high. In the
forex market, the turnover of money reaches 3.8
trillion USD every day. Fluctuating price movements
and high levels of liquidity make forex investment
one of the commodities that have the potential to get
profits or large and fast profits. However, just like the
promised profits, this business also has the same risk
of loss as the promised profit (Busman et al., 2017).
Large risks can be minimized by conducting an
analysis of the market. Analysis is an activity that
takes into account, weighs and measures past events
or data until now to predict the direction of future
price movements. There are two types of analysis
known in the world of trading, namely technical
analysis and fundamental analysis. Fundamental
a
https://orcid.org/0000-0001-5016-8600
b
https://orcid.org/0000-0001-9991-343X
analysis is an analysis based on economic, political
and security situations and conditions globally, while
technical analysis is more based on market
movements.
Based on the problems in the description above, it
can be concluded that a trader must have preparation
in carrying out trading activities including
psychology when trading where every current
transaction can bring profits and losses, than
management of the balance or money owned, time
that cannot be taken into account when carrying out
trading activities, as well as good analysis in
determining selling or buying. For this reason, this
thesis takes the title: "Designing and Making Expert
Advisors on Forex Based on Moving Average
Indicators Using the Martingale System". The
research made will produce an application that can be
used by forex traders, which can make it easier for
Andrijasa, M., Topadang, A., Tandi, D., Ismail, S. and Ahmad, N.
Designing and Creating Expert Advisor on Forex Based on Moving Average Indicator Moving Average Indicators Using Martingale System.
DOI: 10.5220/0011813900003575
In Proceedings of the 5th International Conference on Applied Science and Technology on Engineering Science (iCAST-ES 2022), pages 461-465
ISBN: 978-989-758-619-4; ISSN: 2975-8246
Copyright © 2023 by SCITEPRESS – Science and Technology Publications, Lda. Under CC license (CC BY-NC-ND 4.0)
461
traders to make transactions automatically which
makes trading easier and more efficient.
2 RESEARCH METHODS
There are three main processes, namely the Initial,
Ticking, and Close processes. The Initial process is
the initial stage by which the trader gives orders of
input values. While Ticking is a process where the
Expert Advisor monitors the movement of price
values, which causes floating loss or floating profit.
According to the conditions that occur, ea will run the
martingale method if there is a floating loss. And
finally the Closing process, the EA will end the
transaction according to the conditions reached where
it stops at the point of profit or loss (Dinata, H., 2018).
Initial process, the input needed includes the
period of the moving average indicator, stop loss
point, profit take point, slippage, and martingale point
lots. The ticking process is to let the EA run
automatically so that the EA always observes price
movements continuously. In this process, the EA will
be ready to use the martingale system, depending on
the ongoing price movement. The last stage of the
process is close, this stage calculates the profit or loss
of each completed transaction.
2.1 Moving Average
Average is an indicator that calculates the average
price of an asset in a certain period, then connects in
the form of a line. The average value can come from
the opening price (Open), close (Close), high (high),
lowest (Low), or mid (Median) of a chart candle for a
certain period.
Average is part of the lagging indicator. This
means that this calculation method is based on
previous events and explains information about
market history data. The use of the Moving Average
indicator is as a predictive tool, but rather provides
confirmation. The Simple Moving Average has the
simplest protection pattern and is often used by
traders. This method can be calculated by adding to
the current price series of a period, and then limiting
the number of periods.
Moving Averages can help traders recognize the
prevailing trend of market price values. If the price
currently occupies an area on the Moving Average
line, it means that the price tends to fall or be bearish.
Conversely, prices that are above the Moving
Average line provide bullish trend information or
tend to rise.
𝑆𝑀𝐴
𝑝𝑀 𝑝𝑀 1 ⋯𝑝𝑀𝑛1
𝑛
(1)
Information:
p = actual number
M = time or period
n = lots of actual data
2.2 Martingale Theory
Martingale is a strategy that existed since the 18th
century in France. This strategy was used by gamblers
at that time, where gamblers needed to double their
bets every loss. the goal is to recover the previous
losses coupled with the gains. Martingale is a
sequence of random variables or rather processes at a
given time in a realized order, the expectation of the
next value in its order is equal to the observed value.
The martingale system is a fairly interesting
probability system, which can be applied to various
aspects of life. There are some situations where in
order to be able to implement a martingale system, to
increase the knowledge of application about to real
situations not just theoretical propaganda. One of its
areas of application is a brief prediction of market
prices. The martingale concept can be known more
about the opportunities and possible outcomes of
future predictions. (Victor, O,O. 2015).
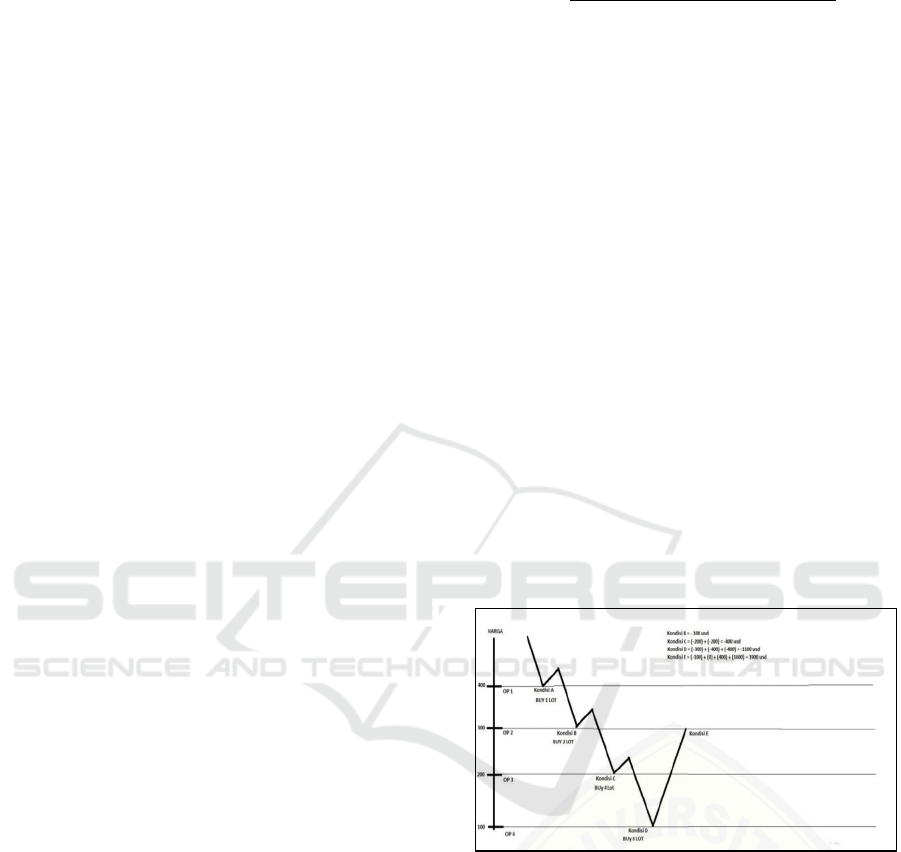
Figure 1: Martingale System.
Example:
It can be seen in figure 2.7 for example, a trader
opened an Open Buy eur/USD with lots of 0.1 at a
price of 2,100, but it turned out that the price moved
down to the level of 2,050 so that it experienced a
floating loss of -50. Then again open buy with lots of
0.2 at the price of 2,050 at that moment. That way, it
now means that there are 2 open postions. The first
position is a floating loss of -50 and the second
position is 0. If the price then rises towards 2,100 then
the first position rises to 0 (BEP) and the 2nd position
becomes a profit of 100 (lots 0.2 x 50 pips = 100|lots
0.2 then 1 pips = $2|).
iCAST-ES 2022 - International Conference on Applied Science and Technology on Engineering Science
462

2.3 Design of Expert Advisor
Figure 2: Flowchart Program Code.
Figure 2 illustrates the series of expert advisor
programs starting from the user or trader who inputs
the value in the parameters into the expert advisor,
where the value inputted on the MetaEditor platform
returns whether it is correct then the indicator is
appropriate then it is ready to run. After the program
is ready, the EA will wait where the parameters of the
moving average indicator line inputted earlier will cut
each other, then the EA will execute with an open
order, namely opening a sell or buy transaction
according to the intersection of the moving average
indicator line.
After the transaction occurs, if you get a loss, the
expert advisor will reopen a new transaction with a
larger lot value, after getting a profit, the lot value will
return to the initial lots value of 0.01 lots. In the Close
section, it serves to delete all objects contained in the
previous graphic chart when the expert advisor ran
before, when the expert advisor is turned off, the
objects that were previously will disappear into the
default view or to the default view.
3 RESULT EVALUATION AND
VALIDATION
3.1 Backtesting EA Martingale
Figure 3: Report EA Martingale.
Figure 3 is a report from the results of the EA
backtesting test martingale. That is done information
about the EURUSD currency market. With a period of
30 minutes (M30) with data in 2021. It uses the every
tick model which is an example of a test model that is
closest to the original market. The candlestick chart
bars that have been used in the test are as many as
13415. With an initial balance of $1000, use the current
spread. With such backtesting tests it yielded 570$.
Figure 4: Graphic Account Balance.
Figure 4 is information about the movement of the
user's balance since the beginning of the deposit. There
is a chart that shows a fairly deep decrease in the
balance and subsequently experienced a very drastic
increase. Which shows that martingale theory can
work according to the design of the program code.
Table 1: Transaction EA Martingale.
# Time T
yp
e Lo
t
Price Result Balance
1
4/1/21
21:30
Sell 0.01 1.2248 1000
2
4/1/21
21:30
Modify 0.01 1.2248
3
5/1/21
21:30
Buy 0.01 1.2251
4
5/1/21
21:30
Modify 0.01 1.2251
5
5/1/21
18:45
S/L 0.01 1.2298 -6.24 992.76
6
5/1/21
19:00
Sell 0.02 1.2294
7
5/1/21
19:00
modify 0.02 1.2294
8
5/1/21
19:07
T/P 0.01 1.2301 6.18 999.94
Designing and Creating Expert Advisor on Forex Based on Moving Average Indicator Moving Average Indicators Using Martingale System
463

The results of the martingale expert advisor test
that provides information about the current
transaction date which includes date and time
information. All tests had 699 transactions on the test.
With the type of transaski sell, modify, or buy. Size is
the amount of lots traded, price is the market price
when the transaction is carried out with stop losses or
takeprofit points that have been determined in writing
the program code. The profit column provides
information about losses or profits obtained, the
balance column is the user's balance information after
the transaction ends.
3.2 Backtesting EA Moving Average
Figure 5: Report EA Moving Average.
In the results of backtesting testing with moving
average expert advisors, it can be seen from the
information in the figure 5. Providing test information
was carried out on the EURUSD market, with a
period of 30 minutes from January 1, 2021, to
December 30, 2021. The test uses the every tick
model, with parameters corresponding to the written
program code.
Figure 6: Graphic Account Balance.
Figure 6 is information about the movement of the
user's balance from the beginning of the deposit. The
graph shows a continuous decline. This is because it
only uses moving averages as a reference for
transactions, without using theory martingale in the
program code flow. The difference in EA made
without the use of martingale theory is very obvious
in the movement of the user's balance in figure 6.
Table 2: Transaction EA Moving Average.
# Time T
yp
e Lot Price Result Balance
1
4/1/21
00:01
Sell 0.01 1.2280 1000
2
4/1/21
00:01
Modify 0.01 1.2280
3
4/1/21
11:16
S/L 0.01 1.2290 -6.25 993.75
4
4/1/21
11:16
Sell 0.01 1.2287
5
4/1/21
11:16
Modify 0.01 1.2287
6
4/1/21
21:30
Buy 0.01 1.2251
7
4/1/21
21:30
modify 0.01 1.2251
8
5/1/21
19:07
T/P 0.01 1.2301 6.18 999.93
9
5/1/21
19:07
Buuy 0.01 1.2304
10
5/1/21
19:07
Modify 0.01 1.2304
11
6/1/21
09:10
S/L 0.01 1.2237 -6.24 992.7
12
6/1/21
09:10
S/L 0.01 1.2301 -6.53 987.17
The results of the moving average expert advisor
test in table 2 provide information about the current
transaction date which includes date and time
information. All tests conducted using moving
average expert advisors resulted in 711 transactions.
With the type of transaction sell, modify, or buy. Size
is the number of lots traded, price is the market price
when the transaction is carried out with stop losses or
take profit points that have been determined in
writing the program code. The profit column provides
information about losses or profits obtained, the
balance column is the user's balance information after
the transaction ends. Table 2 only shows 12 of the
total transactions of 711
4 CONCLUSION
The conclusions that can be drawn after conducting
this study. Comparing the results of an Expert
Advisor who uses the Martingale system, it is more
profitable, but must have enough capital or deposit in
order to be able to run the program from the robot.
For Expert Advisors who only use the Moving
Average indicator, the results get a loss which can be
seen from the backtest test results in figure 5. The
results of the backtest test on the Expert Advisor
using the Martingale system are found in figure 3
which gets a profit of 57% of the deposit value or
initial capital.
The suggestions that the Expert Advisor made can
be even better at carrying out transactions with
additional features such as trailing stop, which is a
modification of an ongoing transaction whose value
iCAST-ES 2022 - International Conference on Applied Science and Technology on Engineering Science
464

is based on a certain percentage of the asset price in
the current market situation, to make losses more
minimized and profits can be maximized.
Furthermore, a feature can be added that can set the
value of Lots so that it can change according to the
balance or balance contained in the account of each
trader so that the expert advisor can be used without
the need for large capital.
REFERENCES
Busman, B., Nurhayati, N., Amali, F., & Muttaqin, Z.
(2017). Penerapan Big Data Pada Forex Trading
Menggunakan Analisa Statistik Dengan Breakout
Strategy. Pseudocode, 4(2), 137–143.
https://doi.org/10.33369/pseudocode.4.2.137-143
Dinata, H. (2018). Implementasi Expert Advisor Dengan
Algoritma Fibonacci Pada Analisa Teknikal Untuk
Perdagangan Forex. Journal on Information Systems,
Technology of Information and Communications, 1,
47–56. http://repository.ubaya.ac.id/32480/11/Jurnal
Nasional 2 Full Text-HENDRA DINATA.pdf
Victor, O. O. (2015). Martingale Theory. Eastern
Mediterranean University North Cyprus: Master of
Science in Applied Matheatics and Computer Science.
Alqodri, F., Lestari, S., & Wardani, N. E. (2015). Teknologi
Trading Berbasis Expert Advisor ( Ea ) Pada Pasar
Valuta Asing Dengan Teknik Kalender Ekonomi.
Seminar Nasional Teknologi Informasi Dan
Multimedia, 6–8.
Yudifera, S., Pattah, D., Santoso, L. W., & Santoso, M.
(2004). Pembuatan Aplikasi Perdagangan Valas
Dengan Metode Elman Neural Network. 1–6.
Lamperti, J. (1977). Martingale Theory. September, 234–
249. https://doi.org/10.1007/978-1-4684-9358-0_10
Widjiyati, N. (2022). Analisa Prediksi Algoritma Simple
Moving Average Dengan Pendekatan Multi Periode.
Smart Comp: Jurnalnya Orang Pintar Komputer, 11(1),
96–99.https://doi.org/10.30591/smartcomp.v11i1.3206
Designing and Creating Expert Advisor on Forex Based on Moving Average Indicator Moving Average Indicators Using Martingale System
465
