
Data-Driven Analysis for the Operation Status of the e-Commerce
Platform Based on Olist
Zhenyu Xu
1†
, Yimin Tan
2†
, Xinxue Wang
3†
and Xiang Li
4†
1
School of Chemistry and Materials, Jinan University, acronyms acceptable, Guangzhou, Guangdong, China
2
College of Science, University of Shanghai for Science and Technology, Shanghai, China
3
School of Mathematics and Statistics, Weinan Normal University, Weinan, Shanxi, China
4
College of Software, Henan University, Kaifeng, Henan, China
†
These authors contributed equally.
Keywords: Business Analysis, e-commerce Platform, Olist, Sales Condition, Customer Feedback.
Abstract: Based on the Olist sales data and user feedback from 2017 to 2018, this paper studies the sales situation of
Olist, and discusses how enterprises can further stimulate sales, strengthen cooperation between the platform
and merchants, and optimize the customer experience. The main method of this study is to use Python to
visualize the data and to conduct statistical analysis on the data. Through the analysis, we find that there is a
lack of customer loyalty for Olist. Platform services, cooperation with suppliers and product quality control
also should be improved. The products and services provided by the platform have not reached the level of
consumer satisfaction. The time difference between the platform and the supplier also exists. In this paper,
specific suggestions are given to solve the existing problems of Olist. These suggestions can also be applied
to other e-commerce platforms with similar operating conditions as Olist to increase sales and customer
satisfaction.
1 INTRODUCTION
With the development of business, statistics on
business results have become a very important part of
business activities. Any business can gain much profit
through scientific data analysis. For example,
enterprises can find various problems in the
development of enterprises. For managers, the scary
thing is not the emergence of a problem or crisis, but
the lack of a solution or control the various data of
products within a reasonable range, understand the
relationship between supply and demand, know which
products are popular and which products are not
profitable, and adjust business ideas in time to allow
enterprises to obtain more valuable information.
Business analysis and data science can be combined.
Although there are several definitions for the
concept of business analysis, it is difficult to define it
as a set of numerical tools, methodology, business
processes, and analytical modeling methods that allow
data-driven decision-making in modern companies
and organizations. To this end, it makes extensive use
of data and information science.
In this case, we collected some data from Olist,
which is the largest department store in Brazilian
marketplaces. Olist connects small businesses from all
over Brazil to channels without hassle and with a
single contract. Since we have seen the boss's needs to
process daily operational data on the Internet, we are
ready to use our capabilities to solve these problems,
and help them to make final decisions.
With the e-commerce platform’s development,
many pieces of literature studied different business
models. There are many factors that affect the
customer’s purchase. Kwahk and Kim (Kwahk & Kim
2017) analyze results show that social interaction ties
have significant positive effects on social impact
transfer factors and trust in online vendors, whereas
they do not directly influence visit intention. Social
media commitment plays a crucial role in increasing
social impact transfer factors and e-commerce
outcomes. Flanagin et al (Flanagin, Metzger, Pure,
Markov& Hartsell 2014) suggest that despite valuing
the web and ratings as sources of commercial
information, people use rating information
suboptimally by potentially privileging small numbers
of ratings that could be idiosyncratic. And the product
Xu, Z., Tan, Y., Wang, X. and Li, X.
Data-Driven Analysis for the Operation Status of the e-Commerce Platform based on Olist.
DOI: 10.5220/0011836600003607
In Proceedings of the 1st International Conference on Public Management, Digital Economy and Internet Technology (ICPDI 2022), pages 859-867
ISBN: 978-989-758-620-0
Copyright
c
2023 by SCITEPRESS – Science and Technology Publications, Lda. Under CC license (CC BY-NC-ND 4.0)
859

quality is shown to mediate the relationship between
user ratings and purchase intention. Buttle et al.
(Buttle 1997) carried out mail surveys on 4,250
certificated organizations; 1,220 (28.7 percent)
responded. Marketing considerations were secondary
in seeking registration, and outcomes related to
profitability and process improvement were more
highly valued than marketing benefits.
Logistics and transportation are also important for
e-commerce companies. Speranza et al. (Speranza
2018) propose that problems in transportation and
logistics had to be tackled long before computers and
Operational Research (OR) became available to
support decision making. After the first optimization
models were developed, OR has substantially
contributed to making transportation systems efficient
and companies with complex transportation and
logistics problems competitive. Gunasekaran and
Ngai et al. (Gunasekaran & Ngai 2003) analyze the
company, a small third‐party logistics (3PL) company
in Hong Kong, which has been successful in its overall
business performance and satisfying customers. This
company's strategic alliances with both clients and
customers have helped to improve the utilization of its
resources, such as warehouse space and transportation
fleets. Also, the company is in the process of
expanding its operations across greater China, to
become a full‐fledged 3PL company.
E-commerce is becoming more popular. Sarkis
and Talluri (Sarkis, Meade & Talluri 2004) realize that
a strong supporting logistics or electronic logistics (e‐
logistics) function is an important organizational
offering from both the commercial and the consumer
perspective. The implications of e‐logistics models
and practices cover the forward and reverse logistics
functions of organizations. They also have a direct and
profound impact from an environmental perspective.
Barnes et al. (Barnes 2002) analyze that fueled by the
increasing saturation of mobile technology, such as
phones and personal digital assistants (PDAs), m-
commerce promises to inject considerable change into
the way certain activities are conducted. Equipped
with micro-browsers and other mobile applications,
the new range of mobile technologies offers the
Internet ‘in your pocket’ for which the consumer
possibilities are endless, including banking, booking
or buying tickets, shopping, and real-time news.
Bichler and Zhao (Bichler, Segev & Zhao 1998)
component-based e-commerce technology is a recent
trend towards resolving the e-commerce challenge at
both system and application levels. Instead of
delivering a system as a prepacked monolith system
containing any conceivable feature, component-based
systems consist of a lightweight kernel to which new
features can be added in the form of components.
Jing Dong is one of the giants in the Chinese
market. Li Mei and Guo Chen (Li & Guo 2015)
research the issue of self- logistics in Jing Dong under
the background of the rapid development of e-
commerce. The analysis of the advantages and
disadvantages and the comparison of the third-party
logistics proved that self- logistics enjoyed significant
advantages. However, there exist potential risks of too
large investment, difficult management of staff, and
distraction from core business. Sun and Zhou (Sun,
Liu, Higgs & Zhou 2017) consider the research status
of the Internet of Things as applied to supply chain
management. A supply chain analysis model is built
under the Internet of Things environment using Jing
Dong Mall as a case study. The results show that the
Internet of Things improved the quality of information
available to Jing Dong, enhanced its management
efficiency, and improved customers' satisfaction; it
also reduced the cost of supply chain management
whilst creating more new value.
In this paper, we mainly analyze the e-commerce
orders of Olist Store in Brazil from 2017 to 2018
focused on four dimensions: monthly sales, order
confirmation time, scores of reviews, and the number
of regular customers.
Firstly, we can see that sale volume has been
increasing throughout 2017 and reached the highest
level of the year in November. The decline was
significant in December. Sales have declined every
month since 2018, but overall sales are higher than
2017. Due to the last few months of 2018 being
missing, we do not know how the sales are going in
the rest of the months. Therefore, we guess it will hit
a new high. Secondly, we analyze the order time. We
know that the confirmation time for each quarter was
less than 5 minutes, but similar to the previous
analysis, due to the autumn and winter demand being
high, the confirmation time for spring and summer
was higher than autumn and winter. Thirdly, due to the
user evaluation, it is one of the indicators used to
evaluate the quality of goods, so we analyze the user
evaluation. 59% of users gave a 5 score and 13% gave
a 1-2 score. Overall, customer satisfaction at Olist
stores is not very high. As a result, the total number of
user reviews dropped significantly in August 2017.
We speculate that the reason influencing this factor is
product quality or platform service. Because the
repurchase rate is the key to the sustainable operation
of Olist stores. In the end, we analyze the number of
regular customers. 90% of customers buy once a
month, and less than 13% of customers buy more than
three times a month. For this purpose, the Olist Store
ICPDI 2022 - International Conference on Public Management, Digital Economy and Internet Technology
860

needs to think about how to increase the short-time
repurchase rate.
By analyzing we discuss the following ways: (1)
We need to improve the efficiency of order
confirmation in spring and summer; (2) it is suggested
that Olist needs to strengthen its quality control; (3) it
is suggested that Olist may collect customer's email
and other information, and hold activities such as
recommending and promoting products.
In this article, we first explained the background of
the data. we will first conduct business analysis, and
then combine customer data to analyze customer
behavior on the basis of business analysis. Finally, we
will summarize all the above analyses, draw our own
conclusions and corresponding recommendations.
2 DATA BACKGROUND
In this paper, we used the data as a Brazilian e-
commerce public dataset of orders made at Olist
Store. The dataset has information of 100k orders
from 2017 to 2018 made at multiple marketplaces in
Brazil. Its features allow viewing order from multiple
dimensions: from order status, price, payment, and
freight performance to customer location, product
attributes and finally reviews written by customers.
We also released a geography dataset that relates
Brazilian zip codes to let/lng coordinates. Next, we
mainly study four aspects, such as monthly sales,
order confirmation time, scores of reviews, and the
number of regular customers.
In this picture, we can see that there are four
variables that affect orders. These four factors are
monthly sales, order confirmation time, scores of
reviews, and the number of regular customers. They
restrict each other. And these factors also have their
own restricting factors. The reason for affecting order
confirmation time is a customer's location, freight
performance and order statues. Monthly sales and the
number of regular customers have the same restricted
factors. It is about price and product attributes. Scores
of reviews have only affected reasons for reviews
written by customers.
3 BUSINESS ANALYSIS
In this section, we selected some data from the
homepage of Olist. After that, we used these data to
do sales analysis, delivery time analysis and order
time analysis.
3.1 Sales Analysis
We first created a table to look at the total sales of
each month. We found that each month's sales were
increasing. However, due to the missing data in the
last few months of 2018, we were unable to make a
judgment. As we can see from the Table 1, the
maximum sale is in November, which is 7544.Then
we take a graph for the sales amount from 2017 to
2018.
From the total sales (Figure 1), it can be seen that
regardless of the lack of data, the sales volume showed
Figure 1: Variable diagram.
Data-Driven Analysis for the Operation Status of the e-Commerce Platform based on Olist
861

Table 1: Total sales for each month in 2018 and 2017.
Month Jan Feb Ma
r
Ap
r
May Jun
2017 800 1780 2682 2404 3700 3245
2018 7269 6728 7211 6939 6873 6167
Month Jul Aug Sep Oct Nov Dec
2017 4028 4331 4285 4631 7544 5673
2018 6292 6512
/
/
/
/
Figure 2: Total sales from 2017 to 2018 sales.
Table 2: Delivery Time Information (Excerpt).
Customer date Deliver
y
date Season
1 2017-10-10 2017-10-18 autumn
2 2018-08-07 2018-08-13 summer
3 2018-08-17 2018-09-04 summer
4 2017-12-02 2017-12-15 autumn
5 2018-02-16 2018-02-26 winter
Time difference Difference float
1 8days+21:25:13 -7.107488
2 6days+15:27:45 -5.355729
3 18days+18:06:29 -17.245498
4 13days+00:28:42 -12.980069
5 10days+18:17:02 -9.238171
a rapid upward trend in 2017 and reached its peak in
November. After that, it has remained stable and
fluctuates at around 6,500. It can be seen from this that
2017 was the peak period of Olist’s development, and
the order volume increased sharply. By 2018, the sales
volume stabilized and the development entered the
stabilizer. Data to speculate how to design marketing
strategies.
3.2 Delivery Time Analysis
We counted the logistics speed of each season. The
method of analysis is to make the difference between
the estimated delivery date provided by the store and
the actual delivery date, and finally get the difference
date. The time difference column is obtained by
subtracting the second column (delivery date) from
the first column (customer date), the last column
(difference float) is the number that turns the date into
decimal Part of the whole table is shown in table 2.
Afterward, we plotted the difference (Figure 2) in
days in different seasons and found that no matter
what season, the customer's delivery time was much
earlier than the expected delivery time, about a week
earlier on average. According to the distribution of the
histogram, the logistics rate in autumn and winter is
significantly higher than that in spring and summer.
The reason may be that the demand in spring and
summer is larger, while the demand in autumn and
winter is less.
ICPDI 2022 - International Conference on Public Management, Digital Economy and Internet Technology
862

Figure 3: Time difference between estimated and actual delivery time.
Table 3: Order Time Information (Excerpt).
Order
p
urchase timestam
p
Order a
pp
roved at
1 2017-10-02 10:56:33 2017-10-02 11:07:15
2 2018-07-24 20:41:37 2018-07-26 03:24:27
3 2018-08-08 08:38:49 2018-08-08 08:55:23
4 2017-11-18 19:28:06 2017-11-18 19:45:59
5 2018-02-13 21:18:39 2018-02-13 22:20:29
season Time difference Time difference float
1 autumn 0 days 00:10:42 0.007431
2 summe
r
1 da
y
s 06:42:50 1.279745
3 summe
r
0 days 00:16:34 0.011505
4 autumn 0 da
y
s 00:17:53 0.012419
5 winte
r
0 days 01:01:50 0.042940
3.3 Order Time Analysis
We then compared the difference between the
payment time and the merchant's approval time in
different seasons. The time difference column is
obtained by subtracting the second column (delivery
date) from the first column (customer date), the last
column (time difference float) is the number that turns
the date into decimal.
According to Figure 4, we found that the approval
time for each season is within five minutes. Similar to
the project analyzed in the previous analysis, the
approval time for the spring and summer seasons is
higher than that for the autumn and winter seasons.
The reason may also be due to the large number of
orders in the spring and summer seasons. In the
autumn and winter seasons, more than 80% of the
response time was within one day. In the spring and
summer seasons, due to the large sample size and
network delays caused by many orders, the response
time within one day dropped to 70%.
Through the above analysis, we can summarize
that it can be seen from the sales volume that the
overall Olist is still developing, but the speed of
development is slowing down. This is a problem
worth thinking about, and a strategy needs to be
devised to solve this problem. Turning our attention to
logistics and response time, it can be seen that
although the overall is still within an acceptable time
range, there is still a lot of room for improvement,
because, with the development of the times, people's
tolerance for waiting time will decline, so a method to
increase the speed of logistics is very necessary.
4 CUSTOMER’S ANALYSIS
In this part, through the analysis of customer’s review
scores and the change of customers repurchases. We
can figure out how the public praise of Olist’s products
changed and give Olist the corresponding future
development plans.
Data-Driven Analysis for the Operation Status of the e-Commerce Platform based on Olist
863

Figure 4: Order Validation Time.
Table 4: Customer’s Review Scores.
month score Review numbers
1 January 1-2 1032
2 January 3-4 1806
3 January 5 3695
4 February 1-2 1170
5 February 3-4 2114
Figure 5: Customer’s Review Scores.
4.1 Score Evaluation
In order to observe customers’ response to the project,
according to the Olist’s data source, we counted the
number of costumer’s review scores and made a
corresponding table. In the Table 4, we can find that
no matter what month it is, the number of customers
who give 5 points is the largest, then followed by
customers who give 3 to 4 points. And customers who
give 1 to 2 scores are the least.
It is widely known that the scores given by
customers have a great relationship with the quality of
goods and clearly reflects the feelings of customers
after they purchase commodities. Besides, users’
review rating is the most critical index to evaluate the
quality of goods and services provided by e-commerce
platforms.
We can see clearly in the Figure 5 that Olist's
overall customer satisfaction is not satisfactory. Only
59% of customers gave a rating of 5 points out of 5
points. 13% of users gave negative reviews of one or
two points. In the first eight months, we can see a
steady change in the data. In August, the number of
five-point positive reviews suddenly dropped sharply.
Then it became smooth after September and then
steadily increased again after November.
In August, there was an unusual drop in users’
ratings. Such an abnormal situation may be due to
ICPDI 2022 - International Conference on Public Management, Digital Economy and Internet Technology
864
large-scale quality problems of the products being
sold, or serious service errors of the platform.
Considering the abnormal decline of both sales and
reviews in August, it is suggested that Olist should
strengthen its quality control. For Olist, ensuring the
quality of products should be the top priority. Only by
improving the quality of goods can customers'
satisfaction after purchase be increased.
4.2 Regular Customers
At last, we counted the number of the customers'
repurchases. Attracting customers to spend repeatedly
on the platform is the key point of the sustainable
business of e-commerce because whether it can attract
customers to repurchase is also an important indicator
of the electronic commercial success.
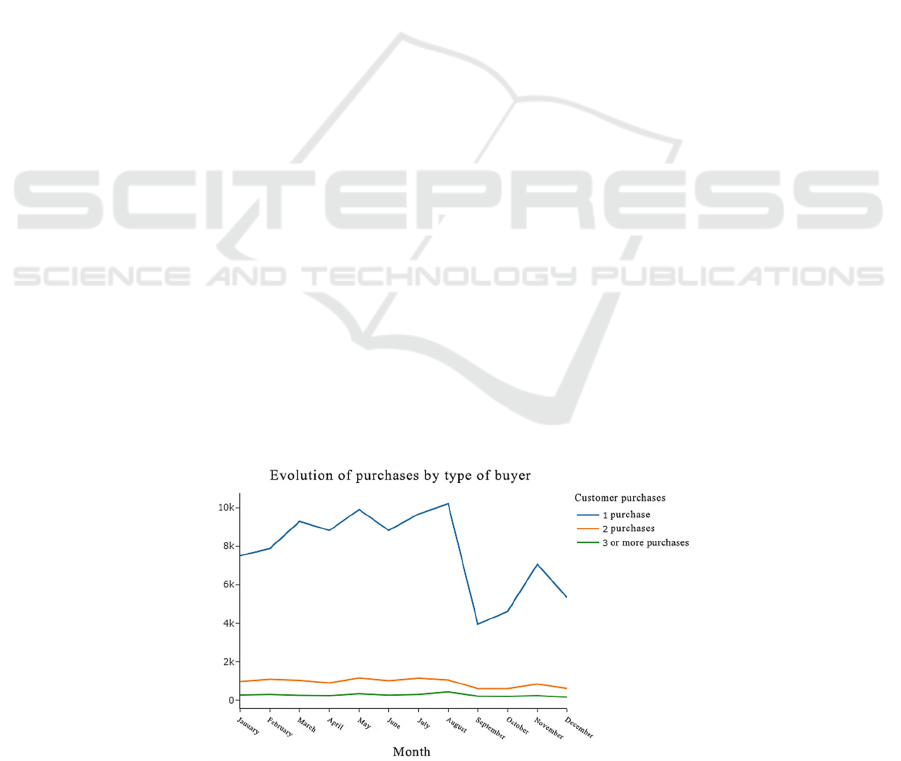
In order to observe the changes of the data more
easily, we still make the data into a line chart. In the
chart, the blue line means customer buy this product
for the first time, the orange line means customer buy
it the second time and the green line means customer
purchases three or more times.
According to the Figure 6, we can draw the
conclusion that before August, the volume of
customers' first purchase increased steadily at a slow
and steady pace. However, in August there was a
sharp decline due to some specific reasons. After
September, there has been a significant rebound in the
amount of data of customer purchase. Meanwhile, we
can find a problem that during the whole period of the
year, the number of second and third purchases
remained steadily at a lower level above 1,000,
without drastic changes, and even did not change with
the data of first purchases.
According to the data of regular customers, Olist
had a bad performance in getting customers to make
orders again. In 2017, more than 90% of Olist's users
placed only one order per month, and less than 3% of
customers spent three or more orders per month on
Olist. Olist needs to think about how to motivate users
to make multiple purchases in a short period of time.
According to the marketing strategy, it is suggested
that Olist may collect customers' email and other
information, recommend products and promotion
activities regularly, and develop different activities
according to different themes throughout the year, so
as to attract customers to repeat shopping on the
platform within a short period of time.
By comparing the number of customer’s first
purchases and the scores given by customers. We can
find that they were inextricably linked. The trend was
roughly the same between them both. It suggesting
that there is a huge connection between the customers'
purchase and the public praise of the products.
According to the above conclusion, we suggest
that Olist should increase the logistics speed in the
spring and summer seasons because this is greatly
related to customer satisfaction and the time from
order to confirmation can be maintained cause this
time is within an acceptable range. Otherwise, Olist is
not doing well in terms of the repeat customers, they
should take appropriate actions to recall regular
customers, such as discounts on products and so on, to
attract customers to repeat purchases. It also can be
seen from the discount chart that the quality of
products in August and September may decline, which
leads to a decline in repurchases. It is necessary to
strengthen the quality control to make customers most
satisfied. And the public praise of products will also
improve accordingly.
Figure 6: Customers repurchases.
Data-Driven Analysis for the Operation Status of the e-Commerce Platform based on Olist
865

5 DISCUSSION
5.1 Extension
Due to the lack of some data in this study, there is a
certain deviation between the actual sales situation of
Olist and the analysis and prediction. In the absence of
valid review content data, it is impossible to pinpoint
the reason for the sudden drop in ratings in August
2017. Further customer feedback data needs to be
collected and its trend needs to be analyzed to
determine whether Olist's products and services were
incorrectly provided, or whether competitors had
produced a large number of malicious low ratings.
For sales, two years’ data was not enough to make
accurate predictions. With the growing popularity of
online consumption, Olist's sales are likely to grow
even more sharply after 2018. To judge whether Olist
is competitive among enterprises of the same type at
the same time, more data of competing businesses and
itself are needed for comparative analysis before more
accurate and effective suggestions can be given.
5.2 Recommendation
Considering the operating condition of Olist, we have
three recommendations:
(1) To improve the order validation efficiency,
Olist should strengthen the contact with cooperative
merchants and shorten the time of order processing. It
is suggested that Olist introduce a policy that requires
general merchants to process orders within 24 hours,
and merchants selling customized goods should also
process orders within 48 hours, so as to ensure
consumers' shopping efficiency.
(2) To handle the problems with product quality,
Olist should strengthen its quality control. Olist can
also require suppliers to pay customers the double
value of the product and a certain amount of penalty to
the platform when quality problems emerge.
(3) To attract Regular customers, Olist may collect
customers' email and other information to recommend
products and promotion activities regularly. Also,
Olist should develop different activities according to
different themes throughout the year, so as to attract
customers to repeat shopping on the platform within a
short period of time.
6 CONCLUSION
Olist is a Brazilian e-commerce platform. According
to more than 10,000 pieces of public sales data from
2017 to 2018, the marketing status and existing
problems of Olist were analyzed in terms of sales,
service condition and customers’ satisfaction. In this
article, we used Python to visualize the data, and we
can clearly see the annual sales trend, the distribution
of order confirmation time, the change of customer
rating, and the distribution of consumption frequency.
First, based on the annual sales trend, we get into
the result that the holiday effects such as Thanksgiving
Day and Christmas have a significant stimulus to the
sales of Olist. The sales trend in the first half of the
year was slightly weaker than in the second half due to
the lack of effective motivation. Second, the time of
order confirmation and delivery efficiency indicates
that Olist, as an e-commerce platform, still has
problems in cooperation with suppliers. Although the
overall order confirmation time is less than 24 hours,
there are still some orders that take more than a day to
confirm. As a platform, consumers' shopping
experience should be more taken into account, and
time should be reduced to improve order efficiency.
The last point is that customer rating and consumption
frequency are inseparable indicators of the two boxes.
According to the data, a considerable number of
customers are not satisfied with Olist's services or
products, and only a small number of consumers are
accustomed to shopping on Olist. We suggested that
Olist introduce relevant policies to improve the quality
control of platform services and suppliers' products. At
the same time, increased marketing efforts to promote
the penetration of online shopping in Olist consumer
life habits.
While writing this thesis, we realized that there are
still many deficiencies as follows: (i) The whole
analysis of this paper is based on the data of Olist. So,
the data analyzed has great limitations. Besides, the
data is only limited to one year's sales, which cannot
possess enough universal. The resulting data changes
are also applicable to Olist and cannot cover all aspects
of online sales. (ii) The commercial data analysis
based on Olist makes us lack some innovation and it is
difficult for us to innovate the data analysis that
belongs to our own creation. (iii) The limitation of data
makes the number of references we can use is too
small and not authoritative enough.
Based on the defects in the above data analysis, we
need to improve our analysis framework in future
studies. firstly, we could find out reasons for data
changes more clearly and enhance the accuracy of data
analysis. Then, the data sources we analyze should
also include broader aspects to enhance the
universality of our data analysis. Last but not least, we
should also add some innovative data analysis
ICPDI 2022 - International Conference on Public Management, Digital Economy and Internet Technology
866

methods in the article to help us make an analysis, so
that we can draw some more valuable conclusions.
ACKNOWLEDGEMENT
First and foremost, we would like to express our
sincere gratitude to Professor Noah Gift and mentor
Amandeep from University of California Berkeley,
who let us into the world of data analysis. Professor
Gift used his exquisite technology to show us the
charm of data analysis, which aroused our interest in
data analysis. Mentor Amandeep carefully answered
our questions during the learning process and offered
constructive suggestions and guidance for the
completion of the project.
Secondly, we would like to express our gratitude
to Mr. Yuxiang Cheng, our project supervisor, who
was always patient during the paper-writing process
and gave us great help. Before starting the paper, he
explained to us about the structure of paper in detail.
And he pointed out all of the matters needed to be
corrected during lessons. We were deeply touched by
his patience. Also, we would like to thank Ms. Sun Ke
for her valuable advice on our final stage. These
suggestions make our paper better.
Last but not least, we would like to express our
gratitude to our family and friends for their support
and understanding during our study and writing.
Thanks again to everyone who has been giving us
guidance and help. We will continue to explore and
advance in the academic field.
REFERENCES
Buttle, F. (1997). ISO 9000: marketing motivations and
benefits. International journal of quality & reliability
management.
Barnes, S. J. (2002). The mobile commerce value chain:
analysis and future developments. International journal
of information management, 22(2), 91-108.
Bichler, M., Segev, A., & Zhao, J. L. (1998). Component-
based e-commerce: assessment of current practices and
future directions. ACM SIGMOD Record, 27(4), 7-14.
Flanagin, A. J., Metzger, M. J., Pure, R., Markov, A., &
Hartsell, E. (2014). Mitigating risk in ecommerce
transactions: perceptions of information credibility and
the role of user-generated ratings in product quality and
purchase intention. Electronic Commerce Research,
14(1), 1-23.
Gunasekaran, A., & Ngai, E. W. (2003). The successful
management of a small logistics company. International
Journal of Physical Distribution & Logistics
Management.
Kwahk, K. Y., & Kim, B. (2017). Effects of social media
on consumers’ purchase decisions: evidence from
Taobao. Service Business, 11(4), 803-829.
Li-mei, Q. I., & Guo, C. H. E. N. (2015). Research on Self-
Logistics and Distribution System of Jingdong Mall.
Journal of Shandong Institute of Commerce and
Technology, 02.
Speranza, M. G. (2018). Trends in transportation and
logistics. European Journal of Operational Research,
264(3), 830-836.
Sarkis, J., Meade, L. M., & Talluri, S. (2004). E‐logistics
and the natural environment. Supply Chain
Management: An International Journal.
Sun, L., Liu, J., Higgs, R., & Zhou, L. (2017, July). Analysis
on the Application of the Internet of Things Technology
to Jingdong Mall's Supply Chain Management. In 2017
IEEE International Conference on Computational
Science and Engineering (CSE) and IEEE International
Conference on Embedded and Ubiquitous Computing
(EUC) (Vol. 2, pp. 437-442). IEEE.
Data-Driven Analysis for the Operation Status of the e-Commerce Platform based on Olist
867
