
Determination of Bank Capacitor Size as Power Factor Improvement
in Inductive Loads Using Lab View Interface
Donny Dupang Sitorus, A. Tossin Alamsyah and Asrizal Tatang
Electrical Engineering Department State Polytechnic of Jakarta Jakarta, Indonesia
Keywords: Labview, Capacitor Bank, KHA, MCCB.
Abstract: The development of the housing, hotel, and mall sectors has resulted in an ever-increasing demand for
electrical energy. Therefore, the electrical energy distribution is fast, precise, and accurate. Calculating the
quality of the power factor, conductors, and safety is necessary. This is because it involves the reliability of
the system. The quality of the power factor must be maintained by the standards given by PLN to reduce the
cost of electric power used, increase system capacity, increase voltage, and reduce losses to the system.
Calculating the KHA is also essential to make it easier to determine the cross-sectional area of the cable that
will be used correctly, safely, and by predetermined standards. At the same time, calculating the magnitude
of the breaker capacity is essential for safety and the current breaker when there is a short circuit (short circuit)
or overload (overload), which can cause damage to the electric motor and fire due to sparks. In this study, we
will design and calculate the value of the capacitor bank, the calculation of the value of the cable KHA, and
the capacity of the MCC breaker using the LabVIEW interface so that it can make it easier for the industry to
do calculations quickly just by entering load data.
1 INTRODUCTION
Electrical energy is one of the most vital energy roles
in everyday life. This fact triggers the demand for
electrical energy from year to year to increase with the
development of the housing sector, hotels, malls, and
so on. This increase must be followed by a good and
efficient distribution of electrical energy to obtain
electrical energy with high continuity of supply
(E. Ridwan, M. I. Arsyad, A. Razikin, 2018).
In Indonesia, electric power consumers comprise
various groups ranging from households to businesses
to industries. This load variation causes fluctuations in
the power quality of distribution network buses.
Power quality is determined by the bus's high and low
power factors. The decrease in the value of the PF
power factor (cosϕ) is a problem that must be
minimized. Because with a decrease in PF, consumers
and suppliers of electrical energy will experience
losses(B. S. Fauzan, F. Danang Wijaya,). For
consumers, the disadvantages include decreased
system voltage, and the electric power supply cannot
be maximized. The factor that affects the decrease in
PF is the use of inductive loads. The problem is the
low power quality caused by inductive loads (Lisiani,
A. Razikin, and Syaifurrahman, 2020). The inductive
load is a type of load with a wire wound element. An
increase in inductive load results in an increase in the
use of reactive power, which affects the quality of
electric power, especially the power factor. The
comparison between active power (W) and visible
power (VA) will result in a low PF power factor (cosϕ)
as a result of the use of inductive loads(A. Dani and
M. Hasanuddin,(2014)).
One of the efforts made to reduce reactive power
due to using inductive loads is to compensate for
reactive power,(V.B.Rizqiya,(2019)).The reactive
power compensation will reduce the inductive load's
reactive power(S. T. Listrik,). Bank capacitors are
capacitive loads that can reduce reactive power in
inductive loads A. B. Ar Rahmaan,(2017)). So the use
of capacitor banks as reactive power compensators
can correct poor power factors in the load so that the
use of electrical power to the needs of the load is more
appropriate.
The correct cable selection also needs to be
considered because it functions to see the smooth
distribution of electrical energy from the source to the
load,( S. A. Gunawan(2000)). To ensure the system is
safe, a breaker is also required. Breakers such as
MCCB function as safety and current breaker when
726
Sitorus, D., Alamsyah, A. and Tatang, A.
Determination of Bank Capacitor Size as Power Factor Improvement in Inductive Loads Using Lab View Interface.
DOI: 10.5220/0011875600003575
In Proceedings of the 5th International Conference on Applied Science and Technology on Engineering Science (iCAST-ES 2022), pages 726-731
ISBN: 978-989-758-619-4; ISSN: 2975-8246
Copyright © 2023 by SCITEPRESS – Science and Technology Publications, Lda. Under CC license (CC BY-NC-ND 4.0)

there is a short circuit (short circuit) or overload
(overload), (W. P. Azhari, 2019).
Therefore, the calculation of capacitor banks,
cable calculations, and efficient safety are needed to
maintain the quality of the power produced for
consumers. This research will focus on developing an
interface using LabView for this calculation so that it
will make it easier for developers to perform
calculations for the needs of the power system system.
2 METHODS
2.1 Capacitor Bank
Capacitor banks are used to improve the power factor
in a system by entering reactive power into the system
(
V. B. Rizqiya.2019). The capacity of the capacitor
entered into the system depends on the VAR
requirement. Calculation of the need for
compensation VAR can be calculated using the
formula (P. Kebutuhan and K. Daya, 2006)
=.(tan
(
−
)
−tan
(
−
)
)
(1)
Keterangan:
P = Active power
= initial power factor value
= target power factor value
At this stage, several steps must be taken to
determine the value of the capacitor bank to improve
the PF value. Before looking for the PF value, the first
thing to do is to record or measure the existing PF of
a plan. After knowing the PF value and power,
determine how much new PF you want so that the
system is much better than before. Several inputs
must be known so the system can work automatically
for the desired PF repair. We can see in the LabVIEW
display in Figure 2 below.
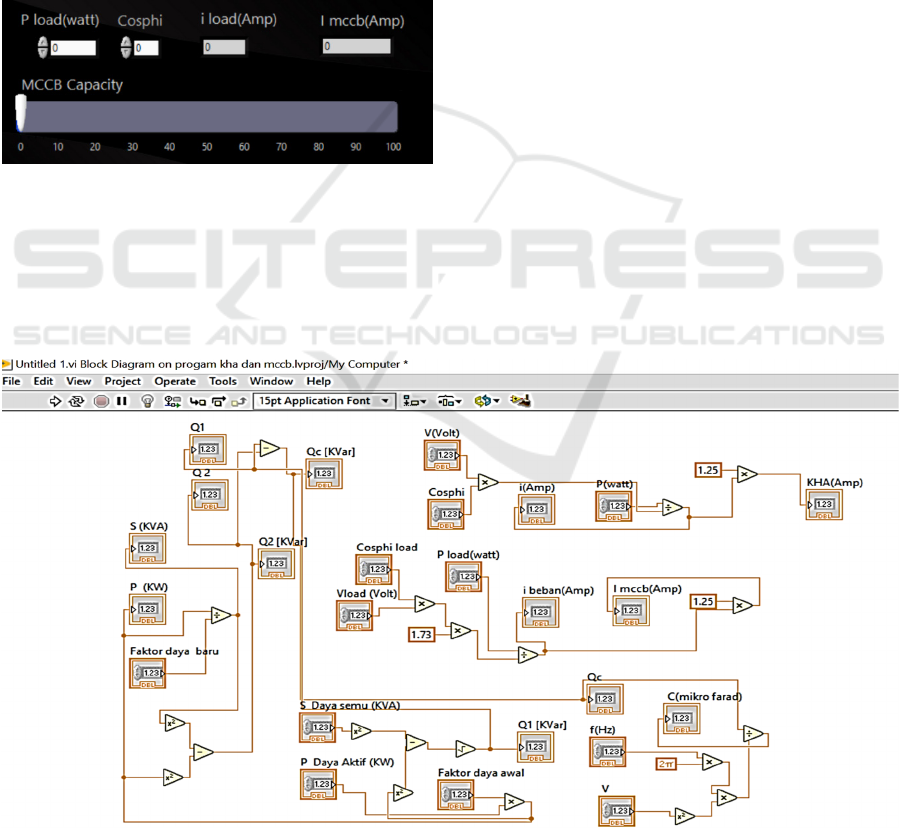
Figure 1: Interface image of the stages of determining the
value of the capacitor.
From Figure 1 above, we can understand that several
output options are presented to calculate the value of
the capacitor bank and how many sizes of capacitor
capacity are needed to meet the installed capacitor
bank.
2.2 Determining the Cable Size
In determining the cable type, you must first consider
the current-carrying strength (KHA) that will pass
through the cable. After the KHA value has been
determined, it will be compared with the PUIL 2000
standard to determine the required cross-sectional
area. The following is the calculation of CRC based
on the rules in PUIL 2000:
= 125% (2)
where:
KHA: Strong Current Conduct
FLA: Full Load Ampere
Moreover, the calculation of the correction factor on
the attached cable is as follows:
=
()
(3)
= Load current (A)
K1= Room temperature correction factor
K2=Group reduction correction factor
At this stage, the interface is made for calculating
the cable size in LabView. Input in power and
voltage, power factor, and current. The LabVIEW
program will perform calculations automatically
based on the input so that the value of KHA is
obtained. After obtaining the KHA value, the cable
size selection is based on the datasheet available in
LabView.
Figure 2: Initial Interface Image Determination of Cable
Size.
2.3 Determining MCCB
In determining the capacity of the circuit breaker, it
must first consider the maximum setting of the short
circuit protection device on the circuit breaker. The
calculation is based on the applicable standard, PUIL
2000, where the maximum setting of the short circuit
protection device on the cage motor circuit breaker
does not exceed 250% of the total load current of the
Determination of Bank Capacitor Size as Power Factor Improvement in Inductive Loads Using Lab View Interface
727
motor. The following is the calculation of the
maximum setting of the protective device.
Maximum protective device= 250% x FLA
where:
FLA: Full load ampere
At this stage, the interface is made for calculating
the cable size in the LabView software. The inputs are
load power, source voltage, and cos phi. The
LabVIEW program will automatically calculate the
nominal value and the installed MCCB capacity. By
determining the correct MCCB value, the system is
expected to be able to overcome any sudden
disturbances.
Figure 3: Initial Interface Image Determination of MCCB.
3 RESULTS AND DISCUSSION
In this sub-chapter, we will discuss the results of
the simulation of the operation of the LabVIEW
that has been made to find the KHA value of a
cable, the MCCB value, and the capacitor value
for a better PF change from the existing system of
a plan.
3.1 Identify the Crc Value Search
Process Using the Labview
Interface
In this research, several input and output components
are needed in the initial process series related to each
other. Figure 5 above is a block diagram that will be
run to determine the three values, namely the cable
KHA, the MCCB quantity, and the capacitor value.
The front panel has been arranged as described in
chapter 3.
Each simulation process will be run together.
Before the simulation is run, the block diagram will
check the wire connections between the indicators
and whether they are connected correctly or not. If
there is a wired connection, there is an incorrect block
diagram, the program automatically cannot be run,
and a cross appears on the error section. For the start
or stop button, only one control can start and stop the
calculation of the three components. Figure 5 is an
image of the button for simulating the three
calculations.
Figure 4: Overall block diagram drawing of the simulator.
iCAST-ES 2022 - International Conference on Applied Science and Technology on Engineering Science
728
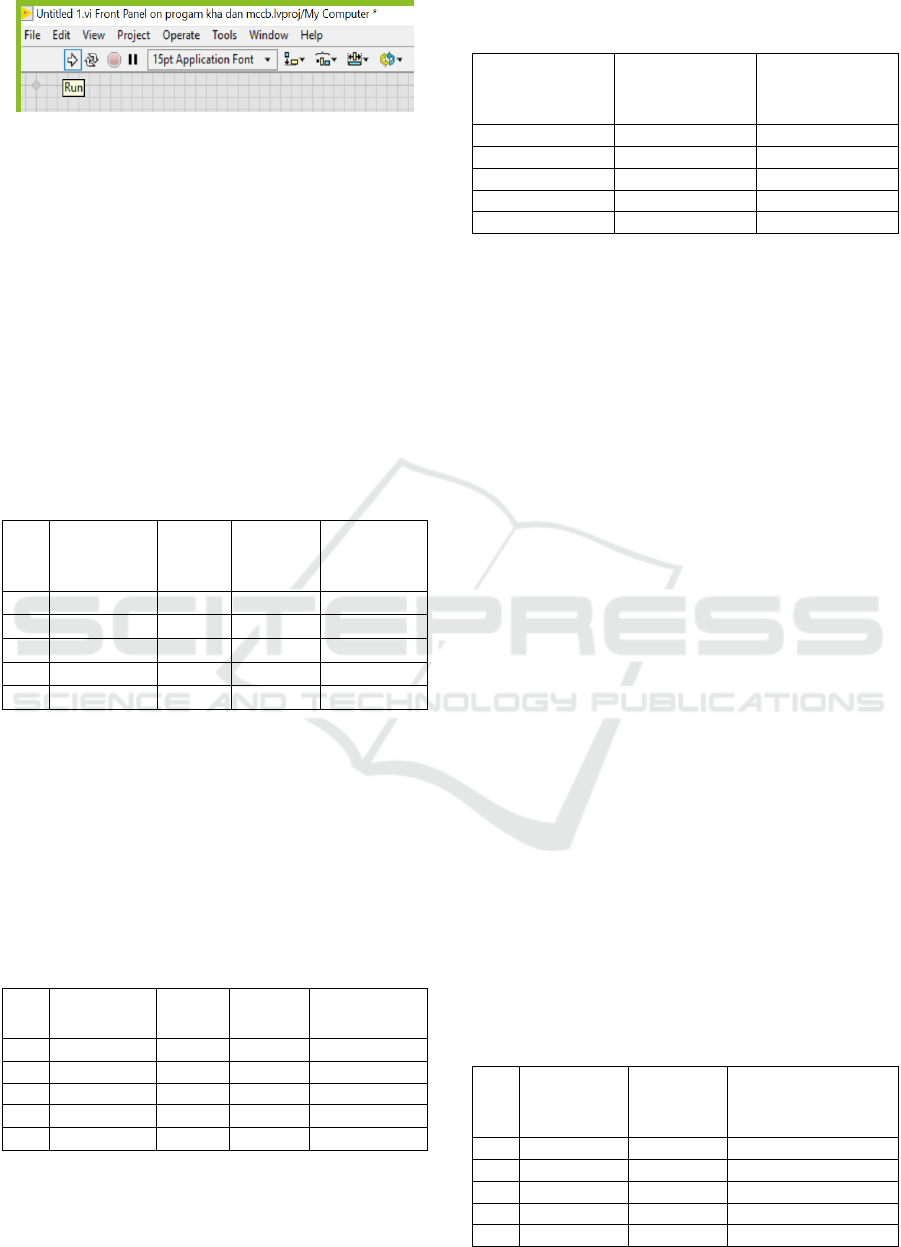
Figure 5: Image of the running and stop buttons on the
simulator.
The simulation results are in the form of numbers
according to the desired output. The search for the
KHA value is in the form of amperes and has been
carried out several times by trial and error. The
simulation results have been confirmed to be the same
as the results of manual calculations. To prove
whether the simulator can be used, a case study is
taken with the following input values: Power
Capacity, Source Voltage, and Power Factor
The following is a Table of the results of the
calculation of KHA using LabView simulation:
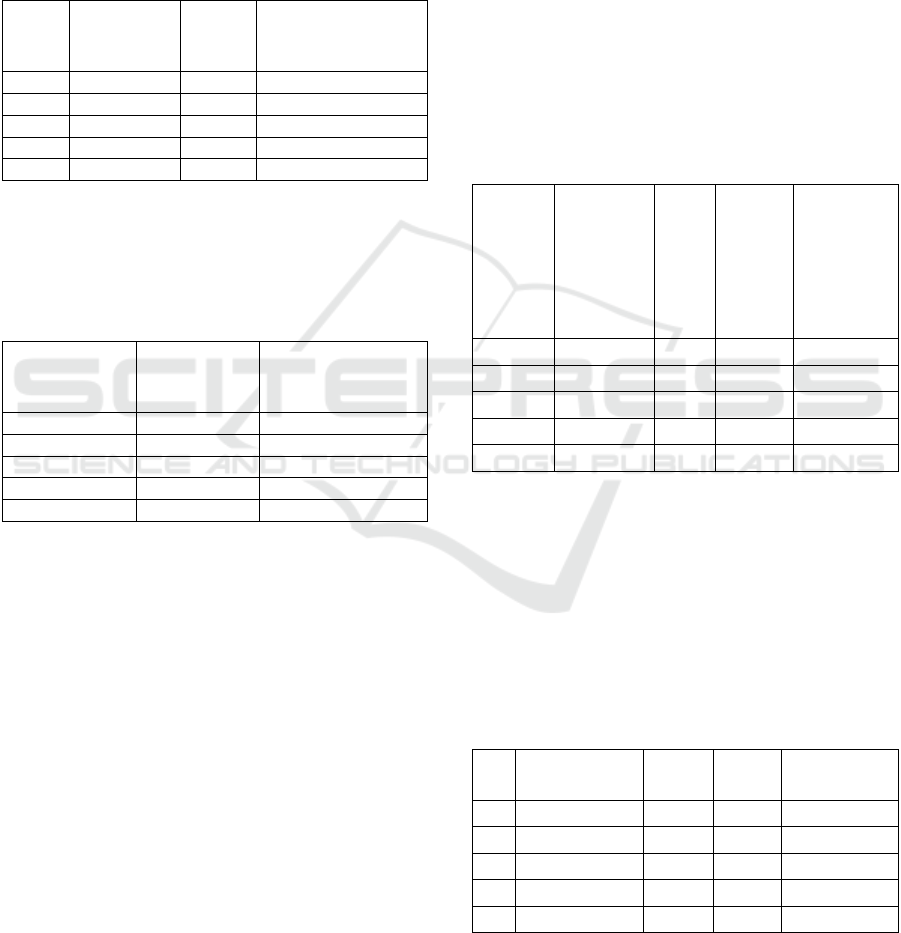
Table 1: The results of the calculation of the CRC value
using the LabVIEW simulator.
No
Active
Power
(Watt)
Cos
Phi
I (A)
CRC
Labview
(A)
1 25560 0.786 49,4662 61,8328
2 25850 0.793 49,5858 61,9823
3 23590 0.773 46,4215 58,0268
4 24950 0.786 48,2857 60,3571
5 21630 0.786 41,8605 52,3256
From Table 1 above can be seen the results of the
simulation of the first experiment onwards.
To compare the LabVIEW simulation results,
manual calculation data is needed with direct
measurement data in the field. The input data used in
the manual calculations are compared to the case
studies for the simulation. The results of manual
calculations can be seen in Table 2.
Table 2: The results of calculating the CRC value using
manual field measurement.
No
Active
Power (W)
Cos
Phi
I (A)
CRC
Labview (A)
1 25560 0.786
49,46 61,82
2 25850 0.793 49,57 61,96
3 23590 0.773 46,41 58,01
4 25950 0.786
48,28
60,35
5 21630 0.786
41,85
52,32
Table 2 above shows the results of the calculation of the
first experiment onwards.
Table 3: Comparison of manual field measurement
determining the value of CRC and the LabView simulator.
Trial and error
simulation data
retrieval
LabVIEW
simulation
results
Field
Measurements
1 61,8328 61,82
2 61,9823 61,96
3 58,0268 58,01
4 62,7762 60,35
5 52,3256 52,32
From the results of Table 3 above, it can be seen
the results of the simulation of the first experiment
onwards. There is no significant change in value
between LabVIEW simulation and manual
calculation. The difference in the simulation results
with manual calculations only lies in the value of the
number behind the comma. As we can see in data
retrieval 1, the LabVIEW simulation results are
61,8328, while the field measurements is 61,82. It can
be concluded that there is no difference in the central
values between the simulation results and the manual.
3.2 Identification of the Mccb Value
Search Process Using the Labview
Interface
To change the power factor value that is better than
the existing system. Similarly, after coding the block
diagram for finding the MCCB value is complete, the
simulation can be done by pressing the running button
on the control bar icon. At this stage of finding the
value of the capacitor, many inputs and outputs are
described. The simulation results that have been
carried out several times can be interpreted as the
resulting value following the calculation. In Table 4.4
below are the record results from the final simulation
results using LabVIEW. To prove whether the
simulator can be used, a case study is taken with the
input values for the mccb of a motor as follows:
The following is a Table of the results of the
calculation of MCCB value using LabView
simulation:
Table 4: The results of the calculation of the MCCB value
using the LabVIEW simulator.
No
Active
Power
(Watt)
Cos Phi
MCCB Value
simulation results
on LabVIEW
1 84720 0,77 209,207
2 88570 0,793 212,37
3 84940 0,773 208,936
4 91660 0,794 219,503
5 87910 0,799 209,205
Determination of Bank Capacitor Size as Power Factor Improvement in Inductive Loads Using Lab View Interface
729
From Table 4. above, the simulation results of the
first experiment onwards can be seen. To compare the
LabVIEW simulation results, manual calculation data
is needed with direct measurement data in the field.
The input data used in the manual calculations are
compared to the case studies for the simulation. The
results of manual calculations can be seen in Table 5.
Table 5: The results of calculating the MCCB value using
field measurement.
No
Active
Power
(Watt)
Cos
Phi
Field Measurement
of MCCB value
results (A)
1 84720 0,77 209,16
2 88570 0,793 212,31
3 84940 0,773 208,87
4 91660 0,794 219,46
5 87910 0,799 209,16
From table 5. above, the results of the calculation
of the first experiment onwards can be seen.
Table 6: Comparison of calculations to determine the
MCCB value with the LabVIEW simulator and manual
calculations.
Trial and error
simulation data
retrieval
LabVIEW
simulation
results
MCCB value field
measurement (A)
1 209,207 209,16
2 212,37 212,31
3 208,936 208,87
4 219,503 219,46
5 209,205 209,16
From the results of table 6 above, it can be seen the
results of the simulation of the first experiment
onwards. There is no significant change in value
between LabVIEW simulation and manual calculation.
The difference in the simulation results with field
measurement only lies in the value of the number
behind the comma. As we can see in data retrieval 1,
the LabVIEW simulation result is 209,207 A, while the
field measurement is 209,16 A. It can be concluded
that there is no difference in the central values between
the simulation results and field measurement.
3.3 Interface Labview Identify the
Process of Finding the Capacitor
Bank Value for Power Factor
Improvement Using the Labview
Interface
After the coding of the block diagram for finding the
capacitor value has been completed, the simulation
can be done by pressing the running button on the
control bar icon. At this stage of finding the value of
the capacitor, many inputs and outputs are described.
To change the power factor value that is better than
the existing system. The simulation results that have
been carried out several times can be interpreted as
the resulting value by the calculation. In Table 7
below are the recorded results of the final simulation
results using LabView To prove whether the
simulator can be used, a case study is taken with the
following input: Active Power, Cos Phi before PF
repair, and target Cos Phi
The following is a table of the results of the
calculation of Capacitor needed value using LabView
simulation:
Table 7: Capacitor needed value calculation results using
the LabView simulator.
No
Active
Power
(KW)
Q1 Q2
Capacitor
needed
value (Qc)
simulation
results
(KVar) on
LabView
1 542,08 0,786 0.99 349,13
2 531,38 0,793 0.99 332,515
3 482,48 0.773 0.98 298,003
4 495,22 0,786 0.99 318,949
5 512,62 0.786 0.99 330,156
Table 7 above shows the simulation results of the
first experiment onwards.
To compare the LabVIEW simulation results,
manual calculation data is needed with direct
measurement data in the field. The input data used in
the manual calculations are compared to the case
studies for the simulation. The results of manual
calculations can be seen in table 8.
Table 8: The results of calculating the value of the capacitor
needed using manual field measurement.
No
Power Active
(KW)
Q1 Q2
Qc (KVAR)
measurement
1 542,08 0,786 0.99 349,13
2 531,38 0,793 0.99 332,52
3 482,48 0.773 0.99 298,00
4 495,22 0,786 0.99 318,95
5 512,62 0.786 0.99 330,16
Table 8 above shows the results of the calculation
of the first experiment onwards.
iCAST-ES 2022 - International Conference on Applied Science and Technology on Engineering Science
730

Table 9: Comparison of manual field measurement
capacitor needed values and LabVIEW simulator.
Trial and error
simulation
data retrieval
Capacitor
needed
simulation
results (KVar)
with LabView
Capacitor
needed
manual field
measurement
results (KVar)
1 349,13 349,13
2 332,515 332,52
3 298,003 298,00
4 318,949 318,95
5 330,156 330,16
From the results of table 9 above, it can be seen
that the changes in the simulation result from the first
experiment onwards. There is no significant change
in value between LabVIEW simulation and manual
field measurement. As we can see in the data retrieval
of Labview simulation results, it is 349,13 KVar, and
the results of manual field measurements are also
349,13 KVar. The LabView simulation results and
the manual field measurement are the same.
4 CONCLUSION
Ensure that the conclusion is related to the paper's title,
purpose, and contribution. The Labview application
can calculate the VALUE of KHA, the value of
capacitors of banks, and the value of MCCB as
appropriate to automatically protect the working
system of electricity flow.
REFERENCES
E. Ridwan, M. I. Arsyad, A. Razikin, ) Program, S. T.
Elektro, and J. T. Elektro, “Analisis Perencanaan
Pembagian Beban Dan Instalasi Listrik Pada Hotel
Golden Tulip Di Kota Pontianak,” pp. 1–8, 2018.
B. S. Fauzan, F. Danang Wijaya, “Studi Perbaikan Faktor
Daya Beban Induktif Dengan Kompensator Reaktif
Seri Menggunakan Sakelar Pemulih Energi Magnetik,”
Tek. Elektro FT UGM, pp. 125–147.
Lisiani, A. Razikin, and Syaifurrahman, “Identifikasi dan
Analisis Jenis Beban Listrik Rumah Tangga Terhadap
Faktor Daya ( Cos Phi ),” J. Untan, vol. 1, no. 3, pp. 1–
9, 2020.
A. Dani and M. Hasanuddin, “Perbaikan Faktor Daya
Sebagai Kompensator Daya Reaktif ( Studi Kasus STT
Sinar Husni ),” Semin. Nas. R., vol. 998, no. September,
pp. 673–678, 2018.
V. B. Rizqiya, Analisis Perencanaan Perbaikan Faktor
Daya Sebagai Upaya Optimasi Daya Listrik Di Gedung
E5 Fakultas Teknik Universitas Negeri Semarang.
2019.
S. T. Listrik, “Simulasi biaya penyaluran daya listrik
dengan metode,” Univ. Stuttgart, pp. 1–9.
A. B. Ar Rahmaan, “Optimalisasi Penempatan Kapasitor
Bank Untuk Memperbaiki Kualitas Daya Pada Sistem
Kelistrikan Pt. Semen Indonesia Aceh Menggunakan
Metode Genetic Algorithm (Ga),” J. Tek. ITS, vol. 5,
no. 2, 2016.
S. A. Gunawan, “Analisis Penghantar dan Pengaman Pada
Gedung Admisi Universitas Muhammadiyah
Yogyakarta ( Analysis of Conductor and Protection on
Admission Building Universitas Muhammadiyah
Yogyakarta ),” 2000.
W. P. Azhari, “Tugas akhir evaluasi perencanaan
kebutuhan daya pada instalasi listrik kantor pimpinan
daerah muhammadiyah kota medan,” Tek. Elektro,
2019.
P. Kebutuhan and K. Daya, “Keywords: capasitor bank,”
pp. 63–72, 2006.
Determination of Bank Capacitor Size as Power Factor Improvement in Inductive Loads Using Lab View Interface
731
