
Application of LSTM Machine Learning to Prediction Precipitation
in Beijing Area
Jincheng Yuan and Zhongmu Li
Institute of Astronomy, Dali University, Dali, 671003, China
Keywords: Machine Learning, EEMD-LSTM, Precipitation Prediction.
Abstract: Machine learning plays a vital role in climate prediction. In this study, we apply a mixed model (EEMD-
LSTM) combining Ensemble Empirical Mode Decomposition (EEMD) and Long Short-Term Memory
Network (LSTM) to predict precipitation in Beijing. EEMD divides the input precipitation data into multiple
subseries. We use the LSTM to predict the subsequences separately and combine the forecasting of each
subsequence to acquire the end results. By establishing the conventional LSTM model, EEMD-BP model,
and BP model for comparison, Root Mean Square Error (RMSE), Mean Absolute Error (MAE), and
Coefficient of Determination (𝑅
) are used as evaluation indicators. The RMSE, MAE, and 𝑅
of the EEMD-
LSTM model are 1.3337mm, 0.7221mm, and 0.8170, respectively. The EEMD-LSTM model optimizes
RMSE by 53.22% and MAE by 56.72% comparing to the conventional LSTM model. It optimizes RMSE by
15.28% and MAE by 16.20% comparing to the EEMD-BP model and optimizes RMSE by 54.10% and MAE
by 53.72% comparing to the BP model. 𝑅
of EEMD-LSTM is closest to 1. The study outcomes confirm that
the EEMD-LSTM model can obtain the precipitation forecast result of Beijing with higher prediction accuracy.
1 INTRODUCTION
In recent years, machine learning has evolved.
Researchers have found that machine learning can
process earth system data more efficiently, opening
up new directions for predicting precipitation
(Sachindra et al., 2018; Reichstein et al., 2019).
World Meteorological Organization (WMO) pointed
out that in 2018, about 108 million people worldwide
were affected by floods and other disasters, and this
number will increase by nearly 50% in 2030 (Wei et
al., 2020). Flooding caused by extreme precipitation
has become an essential factor affecting urban
development and safety (Zuo, 2022). As the capital
and cultural center of China, Beijing has a large
population. We should pay more attention to
preventing disasters caused by extreme precipitation
(Li, 2022).
As an important algorithm in machine learning,
LSTM is widely used in time series prediction. LSTM
can store information for a long time, connect
different time points, and it is suitable for dealing
with problems with multiple variables. LSTM was
first proposed in 1997 (
Hochreiter et al., 1997), and
it has many advantages. Many types of research have
shown that LSTM can predict time series data well.
For example, Cheng et al. (2022) constructed a
bidirectional multi-scale LSTM model to predict
short-term temperature. Ban et al. (2022) predicted
tide levels based on LSTM model. Shen et al. (2020)
predicted summer precipitation in China. Ensemble
Empirical Mode Decomposition (EEMD) is
considered to be a useful tool for analyzing highly
complex and irregular data (Huang et al., 2010).
EEMD combined with LSTM can predict time series
more accurately (Chen et al., 2022). In the field of
climate prediction, EEMD method is rarely used (Wu,
2019). EEMD method can combine with the LSTM
to expand the application in the field of climate
prediction. We should take advantage of EEMD. This
paper combines EEMD with machine learning
(LSTM) to predict better Beijing precipitation data
that fit the time series. The experimental results
demonstrate that machine learning can successfully
predict the precipitation in Beijing and provide a
reference for establishing the Beijing climate model.
Yuan, J. and Li, Z.
Application of LSTM Machine Learning to Prediction Precipitation in Beijing Area.
DOI: 10.5220/0011917500003612
In Proceedings of the 3rd International Symposium on Automation, Information and Computing (ISAIC 2022), pages 191-195
ISBN: 978-989-758-622-4; ISSN: 2975-9463
Copyright
c
2023 by SCITEPRESS – Science and Technology Publications, Lda. Under CC license (CC BY-NC-ND 4.0)
191

2 DATA
2.1 Study Area
In this paper, we choose Beijing (China's capital) as
the research area. The center of Beijing is located at
longitude 116°20′ East and latitude 39°56′ North.
Beijing has an essential position in Chinese history.
The amount of precipitation will straightforwardly
affect the manufacturing and livelihood of residents
and affect the economic development of China
seriously. Therefore it is imperative to forecast the
precipitation in Beijing.
2.2 Data
The data of this study are selected from the daily
meteorological data set of basic meteorological
elements (V3.0) of the National Meteorological
Information Center, with the starting time of January
1951 and the ending time of January 2020. The data
are obtained from the field measurement of the
weather station, and the following quality control is
carried out: Station extremum inspection; Climate
limit value check; Check of the internal consistency
between fixed time value and daily average value, etc.
After quality control, the completeness and quality of
the data are notable improvements compared to
parallel data products published in the past. The
completeness of the data for per element item is
usually above 99%, and the correct rate of data is
close to 100%. The data are real and reliable and can
represent the actual precipitation. We exclude the
interference caused by observation errors in the
results (Xu et al., 2019). Precipitation is one of the
most important climatic factors. Climate is defined as
the average condition of the weather and its extremes
in a particular region of the earth during a specific
time period due to the interaction of radiation and the
climate system. We use the definition of climate to
select precipitation data. We calculated the 10-day
average rainfall of Beijing as the data set (
Figure 1
).
Ten days is a relatively short time scale in the climate.
We choose the "10-day average" to get as much
precipitation data as possible. In this study, the
training and test sets are divided into 85% and 15%
(Chen et al., 2022).
Figure 1: Ten-day average precipitation sequence.
3 METHODS
3.1 LSTM
LSTM improves RNN without gradient dissipation
and long-term dependence problems (Guo et al.,
2019). LSTM has the following three gates. The role
of the input gate is to identify essential inputs. The
forget gate commands how much info will stream
from memory. The role of the output gate is to
determine the value of the next hidden state. When
the time series is processed by the first two gates, the
LSTM structure can decide whether the information
is retained or forgotten.
At time t, the input is x
. h
is the output at the
previous moment. c
and c
are the states of the
current moment and the previous moment,
respectively. 𝑤
is the parameter matrix. In this paper,
z, i, f, and o specify the state value, input gate, forget
gate, and output gate, respectively. The output values
and input values are calculated by 1-6.
ztanh𝑤
ℎ
,𝑥
(1)
isigmoi
d
𝑤
ℎ
,𝑥
(2)
fsigmoid𝑤
ℎ
,𝑥
(3)
osigmoi
d
𝑤
ℎ
,𝑥
(4)
𝑐
f∗𝑐
+i∗z (5)
ℎ
o∗tanh𝑐
)
(6)
ISAIC 2022 - International Symposium on Automation, Information and Computing
192
3.2 Principles of Ensemble Empirical
Modal Decomposition
EEMD is based on Empirical Mode Decomposition
(EMD). EMD method was constructed by Huang et
al. (1998) to deal with non-smooth nonlinear signals.
It obtains a range of Intrinsic Mode Functions (IMFs)
and a signal residual by decomposition. The results of
decomposition are as follows.
xt
∑
imf
t
rest
(7)
In equation 7, t is time. x(t) and res(t) are the raw
data and residuals, respectively.
Mixing the results of decomposition is the defect
of EMD. EEMD solves this problem and preserves
the decomposition effect on nonlinear and non-
stationary time series data. It has been gradually
applied to time series forecasting in recent years. The
EEMD decomposition steps are as follows.
Step 1, add white Gaussian noise to the
primitive input signal.
Step 2, implement EMD decomposition to
acquire each IMF subsequence.
Step 3, repeat steps 1 and 2 using altered noise
every time.
Step 4, the final value is the average of all IMF.
After the EEMD, we can accurately restore the
fluctuation characteristics of the time series on
different periods and improve the prediction
accuracy (Wu et al., 2019).
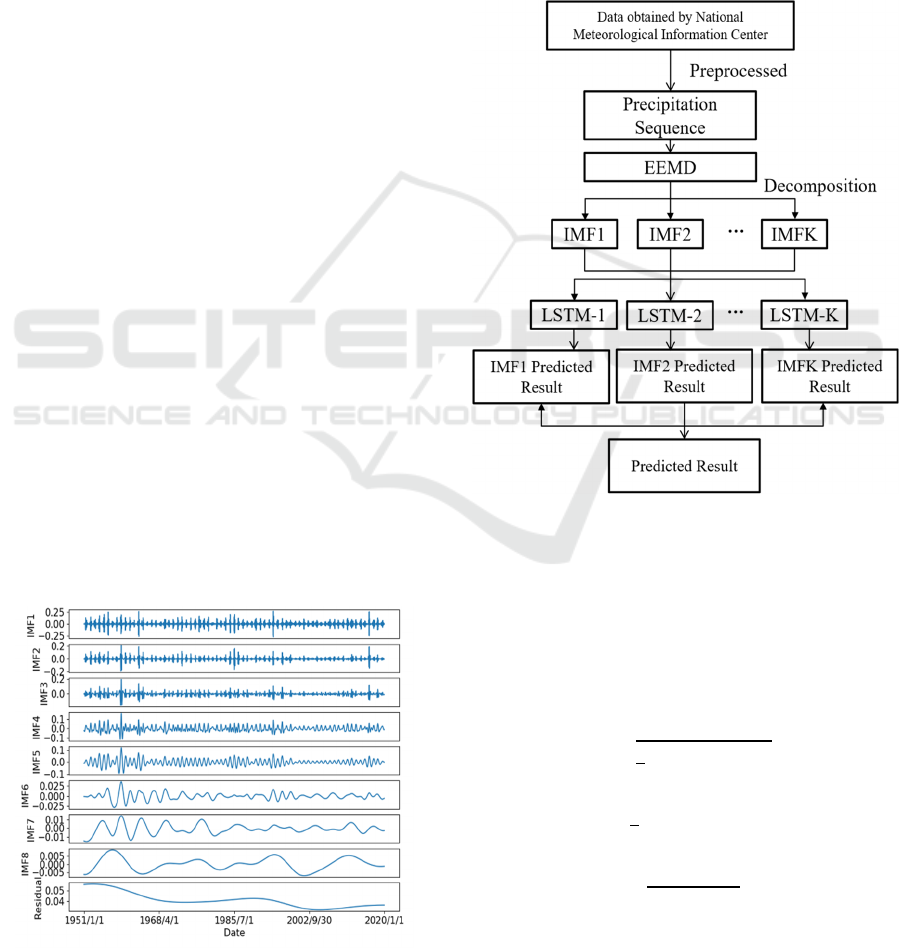
3.3 Model Construction
Pre-processing of original precipitation time series
data is performed normalization. EEMD decomposes
the processed data into 8 IMF subsequences and 1
residual. The decomposition results are shown in
Figure 2.
Figure 2: EEMD decomposition results.
We established LSTM models for each
subsequence. The EEMD-LSTM model is built based
on Keras and python3.9. EEMD-LSTM with 50
neurons in per layer is used to predict the high and
low-frequency subsequences obtained after
decomposition. The activation function is tanh.
Epochs are 100, and batch_size is 16. The lookback
window is 6. This means that we use the rainfall data
for the past 6 days to predict the rainfall for day 7.
The final result is the prediction result of combining
each subsequence. Figure 3 shows the flow chart of
the model applied in this paper.
Figure 3: Model Flowchart.
3.4 Evaluation Criteria
Three evaluation indicators are selected to judge the
forecast capacity of the model. They are RMSE,
MAE, 𝑅
. The greater the value of 𝑅
, the higher the
forecast accuracy, while the opposite is true for
RMSE and MAE.
RMSE=
∑
𝑦
𝑦
(8)
MAE=
∑|
𝑦
𝑦
|
(9)
𝑅
1-
∑
∑
(10)
Application of LSTM Machine Learning to Prediction Precipitation in Beijing Area
193

In equation 8-10, n,
𝑦
,
𝑦
, and
𝑦
specify the
number of samples, actual value, forecast value, and
average value of sample, respectively.
4 COMPARISON OF MULTIPLE
METHODS
In this paper, we get the forecast result of EEMD-
LSTM model for January 2017 to January 2020
(Figure 4). We use the LSTM model, EEMD-BP
model, and BP model to compare with the EEMD-
LSTM model. We define the prediction error as the
prediction value minus the true value. Figure 5 shows
the prediction errors obtained by different models.
Figure 4: Forecast result of the EEMD-LSTM model.
Figure 5: Error comparison graph.
According to Figure 5, we can see that the EEMD-
LSTM model has the slightest prediction error at
multiple moments and the error value is closer to 0.
The prediction results of EEMD-LSTM are
significantly better than the three remaining models.
The RMSE, MAE, and 𝑅
of different models are
shown in Table 1.
Table 1: Experimental results of model error.
EEMD-
LSTM
EEMD-
BP
LSTM BP
RMSE/mm 1.3337 1.5742 2.8509 2.9058
MAE/mm 0.7221 0.8617 1.6684 1.5603
𝑅
0.8170 0.7452 0.1570 0.1242
According to table 1, we can see that compared
with BP model, EEMD-LSTM model optimizes
54.10% RMSE and 53.72% MAE. Compared with
conventional LSTM model, EEMD-LSTM model
optimizes 53.22% RMSE and 56.72% MAE.
Compared with EEMD-BP model, EEMD-LSTM
model optimizes 15.28% RMSE, and 16.20% MAE.
𝑅
of EEMD-LSTM is closest to 1. In summary, the
EEMD-LSTM model is optimal in all three
evaluation indicators and has higher prediction
accuracy.
5 CONCLUSION
In this study, we apply the mixed model (EEMD-
LSTM) to predict precipitation in Beijing. Firstly, we
use EEMD decompose the processed data into 8 IMF
subsequences and 1 residual. Secondly, we establish
LSTM models for each subsequence and combine the
prediction results of each subsequence. Finally, we
get the forecast results of precipitation in Beijing. We
used three models for comparison with the EEMD-
LSTM model. The results of the experiment show that
the forecast error of EEMD-LSTM model is the
smallest, RMSE is 1.3337mm, MAE is 0.7221mm,
and 𝑅
is 0.8170. The EEMD-LSTM model can
predict the trend of precipitation time series well with
the best results. We compare the model using EEMD
with the model not using EEMD, and we know that
the prediction accuracy can be greatly improved with
EEMD. The results prove machine learning method
(EEMD-LSTM) applied in this paper can
successfully predict precipitation in Beijing. EEMD-
LSTM model can obtain more accurate prediction
results. The applied model in this paper can be
extended to predict spatially distributed precipitation
data and contribute to the establishment of climate
prediction models.
ACKNOWLEDGEMENTS
This work is supported by Yunnan Academician
Workstation of Wang Jingxiu (202005AF150025),
the National Natural Science Foundation of China
ISAIC 2022 - International Symposium on Automation, Information and Computing
194

(No. 11863002), and Sino-German Cooperation
Project (No. GZ 1284).
REFERENCES
Ban, W., Shen, L., Lu, F., et al., 2022. Research on tide
level prediction based on neural network LSTM model.
Journal of Zhejiang Ocean University (Natural Science
Edition), 41(04):315-321+365.
Chen, W., Li, X., Shi, L., et al., 2022. Research on
integrated RF module temperature prediction based on
LSTM Network. Computer Measurement & Control,
30(07):84-90.
Chen, Z., Yuan, C., Wu, H., et al., 2022. An improved
method based on EEMD-LSTM to predict missing
measured data of structural sensors. Applied Sciences,
12(28):9027.
Cheng, P., Zhao, J., Han, L., et al., 2022. The short-term
temperature prediction based on bidirectional multi-
scale LSTM. Journal of Jiangxi Normal University
(Natural Science Edition), 46(02):134-139.
Gao, R., Huo, Y., Bao, S., et al., 2019. Distanced LSTM:
time-distanced gates in long short-term memory models
for lung cancer detection. International Workshop on
Machine Learning in Medical Imaging, 2019:310-318.
Hochreiter, S., Schmidhuber, J., 1997. Long short-term
memory. Neural Computation, 9(8):1735-80.
Huang, N., Shen, Z., Long, S., et al., 1998. The empirical
mode decomposition and the Hilbert spectrum for
nonlinear and non-stationary time series analysis.
Proceedings of the Royal Society of London. Series A:
Mathematical, Physical and Engineering Sciences,
454(1971): 903-995.
Huang, N., Wu, M., Qu, W., et al., 2010. Applications of
Hilber-Huang transform to non-stationary financial
time series analysis. Applied Stochastic Models in
Business & Industry, 19(3):245-268.
Li, Y., 2022. "Beijing Cultural Industry Development
White Paper (2022)" released. Beijing City Deputy
Center News, 1(2):11-314.
Reichstein, M., Camps-Valls, G., Stevens, B., et al., 2019.
Deep learning and process understanding for data-
driven earth system science. Nature, 566(7743):195-
204.
Sachindra, D., Ahmed, K., MamunurRashid, M., et al.,
2018. Statistical downscaling of precipitation using
machine learning techniques. Atmospheric Research,
212(2018):240-258.
Shen, J., Luo, Y., Zhao Z., et al., 2020. Research on summer
precipitation prediction in China based on LSTM
network. Progress in Climate Change Research,
16(03):263-275.
Wei, K., Ouyang, C., Duan, H., et al., 2020. Reflections on
the catastrophic 2020 Yangtze River Basin flooding in
southern China. The Innovation, 1(2):1-2.
Wu, Y., Wu, Q., Zhu, J., 2019. Improved EEMD-based
crude oil price forecasting using LSTM networks.
Physica A: Statistical Mechanics and its Applications,
516:114-124.
Xu, W., Sun, C., Zuo, J., et al., 2019. Homogenization of
monthly ground surface temperature in China during
1961–2016 and performances of GLDAS reanalysis
products.
Journal of Climate, 32(4):1121-1135.
Zuo, H., 2022. Scientific understanding of urban rainstorm
and flood disasters system construction of flood control
and disaster reduction system. China Water Resources,
2022(13):30-31.
Application of LSTM Machine Learning to Prediction Precipitation in Beijing Area
195
