
The Time-Varying of Topological Characteristics: Analysis Based on
the Temporal Network on Public Bikes
Wang Li-Na
1,2 a
and Shen Jiang-Long
1
1
College of Sciences, Inner Mongolia University of Technology, Hohhot 010051, China
2
Inner Mongolia Key Laboratory of Statistical Analysis Theory for Life Data and Neural Network Modelling,
Hohhot 010051, China
Keywords: Temporal Network, Multilayer Network, Complex System, Public Bike.
Abstract: Most networks evolve in time. We study the structure of interaction with time. Compared with the tradition-
al public transport, the flexibility of public bikes and the randomness of users' riding behaviours make the
riding route and riding time full of uncertainty. It is the task of scientific research to explore the regularities
behind these uncertainties. By mining the data of user's riding trajectories; we construct the temporal net-
work and the 24-layer multilayer network respectively. The topological characteristics of network presents
double peak. There is a strong correlation between the topological parameters, including positive and nega-
tive correlations. Furthermore, bike ridings among stations distribute heterogeneously and the hourly flow
of stations distributes heterogeneously. Transport system is a typical complex system. This research pro-
vides new evidence for empirical research on temporal network, multilayer network and transport network.
a
https://orcid.org/0000-0001-6422-5709
1 INTRODUCTION
In recent years, researches on transport networks
have been receiving close attention by the physics
community. Transport system is a typical complex
system. Scientists use the thoughts and methods of
network to study traffic problems. For example, traf-
fic congestion problems (Jang et al., 2019), invul-
nerability research (Zhang et al., 2018; Cats et al.,
2020) and key road identification (Feng et al., 2019).
Traditional public transport systems, composed
of buses and subways, have fixed routes, fixed
mileage, fixed running time, and fixed running
interval. We study the public transport system
composed of bikes in this paper. Compared with
traditional public transport systems, the randomness
of individual users' riding behavior makes the riding
routes, riding mileage and riding durations full of
uncertainty. It is the task of scientific research to
explore the regularities behind these uncertainties.
Traditional studies on complex network
consider time-independent structures, but most
networks evolve in time (Porter, 2020). In this paper,
we study the temporal network, structure of
interaction with time. The time-dependent nature of
the network reflects the nature of system, and these
time-dependent behaviors are manifestations of
human behavior. Citi Bike of New York is a public
bikes system. Based on user's riding data, the flow
information among stations and the time information
of user's riding are excavated. We analyze the flow-
weighted temporal network and the 24-layer
multilayer network respectively, to capture the
unobservable characteristics of networks under the
static model.
The paper is arranged as follows. We introduce
related works on transport networks in the second
part. In the third part, we introduce the public bike
system of Citi Bike, and the modeling method of the
temporal network and the definition of the 24-layer
multilayer network are given. Then the topological
characteristics of the networks are analyzed in the
fourth part. Finally, we summarize the conclusion.
2 RELATED WORKS
Recent years, the application of network ideas to the
study of public transport has become a research
422
Li-Na, W. and Jiang-Long, S.
The Time-Varying of Topological Characteristics: Analysis Based on the Temporal Network on Public Bikes.
DOI: 10.5220/0011949800003612
In Proceedings of the 3rd International Symposium on Automation, Information and Computing (ISAIC 2022), pages 422-427
ISBN: 978-989-758-622-4; ISSN: 2975-9463
Copyright
c
2023 by SCITEPRESS – Science and Technology Publications, Lda. Under CC license (CC BY-NC-ND 4.0)

hotspot. Sienkiewicz et al. established the public
transport network of Polish cities, and found the
small world and hierarchical characteristics (Sien-
kiewicz et al., 2005). Ferber et al. studied the public
transport systems in major cities such as Los Ange-
les, and found that: the networks show the character-
istics of small world or scale free (Ferber et al.,
2009). Derrible et al. analyzed the urban subway
system and found that most of the subway networks
are scale free (Derrible et al., 2010). Taking streets
of London and highways of American for instance,
Viana et al. applied multidimensional scaling meth-
ods to visualize the small world characteristics of the
network (Viana et al., 2011). Xu et al. analyzed the
public transport of Chinese cities and found that
these public transport networks have small world
features (Xu et al., 2013). Gallotti et al. studied the
public transport in Britain from the perspective of
multi-layer network (Gallotti et al., 2015). Using
methods of network, Bona et al. analyzed the public
transport of Curitiba in Brazil, and found the charac-
teristics of small world and scale free (Bona et al.,
2016). Using the network approach, Ren et al. ana-
lyzed the public transport of Shenyang and found
that the network is scale free (Ren et al., 2016).
Candelleri et al. analyzed the public transport of
Florence in Italy and Attica in Greece, and the net-
works were found to be potentially vulnerable (Can-
delleri et al., 2019). Yang et al. developed a network
analysis model to study the accessibility of public
transport (Yang et al., 2019). Using smart card data,
they examined the association between public
transport in Wuhan and urban accessibility. Ma et al.
established a bus-subway network, constructed a
vulnerability operator, and studied the impact of
rainstorm on urban public transport (Ma et al.,
2019). Based on the network model, Yu et al. stud-
ied the spatial and temporal distribution of the metro
passenger flow in Nanjing (Yu et al., 2020). Wang et
al. analyzed the bus systems in Hohhot by using
network modelling, and the network has the charac-
teristics of small world and robustness (Wang et al.,
2020). Cao et al. analyzed the public transport in
Changsha and found that the network has scale-free
characteristics but does not satisfy the small world
characteristics (Cao et al., 2020).
The researches on the above mentioned public
transport networks are mainly focused on the bus
and subway systems. These traditional public
transport systems have fixed routes, fixed mileage,
fixed running time, and fixed running interval. Un-
like them, bikes are more convenient. Public bikes
have recently entered the field of public transport as
a new sharing tool. The public bikes take on the
functions of public transport, enrich the types of
public transport, and enhance the efficiency of pub-
lic transport.
In the past years, scientists have used thoughts
of networks to study the public bike system in Lon-
don and some cities of China. Munoz et al. studied
the London public bike system from the perspective
of network (Munoz et al., 2018). Communities were
regarded as nodes. If there were public bike riding
trajectories between communities, the corresponding
nodes were connected. Saberi et al. regarded public
bike stations as nodes of the network. If there was
riding behaviour between stations, the nodes were
connected. They found that the cumulative degree
distribution of London public bike network is power
law (Saberi et al., 2018). Using the same modelling
method, Wei et al. studied public bike system of
Yixing city, and found that the degree distribution
and strength distribution of the network obeys nor-
mal distribution (Wei et al., 2019). Yao et al. con-
structed a public bike network of Nanjing, with sta-
tions as nodes and the number of rides between sta-
tions as the edge weight. They found that the degree
distribution of the network is power law (Yao et al.,
2019). In addition, Shi et al. used the same method
to build the public bike network of Hangzhou. They
divided the network community by different modu-
lar algorithm (Shi et al., 2019).
Citi Bike is the largest bike sharing program in
the United States. The existing literature on the Citi
Bike system is mainly on traffic flow prediction.
Based on clustering and geographically weighted
regression, Bao et al. constructed the relationship
between traffic flow and various factors. They found
that the split riding model gave a better prediction
(Bao et al., 2018). Wang et al. predicted bike de-
mands based on the feature model with contextual,
correlation and user features (Wang et al., 2018).
Using graph convolution neural network, Lin et al.
(Lin et al., 2018) and Yang et al. (Yang et al., 2018)
predicted the bike demands per hour.
3 DATA AND METHODS
3.1 Data
The Citi Bike is designed for quick trip, and it is a
fun and affordable way. From the Citi Bike official
website (https//www.citibikenyc.com), download the
user's riding trajectory data of October 3, 2017. The
format of the initial data in the Citi Bike system is
shown in Figure 1. Each column represents a com-
plete riding trajectory, including the riding duration,
The Time-Varying of Topological Characteristics: Analysis Based on the Temporal Network on Public Bikes
423

the start time and start location, and the end time and
location. The time information is accurate to sec-
onds, and the location information contains the lon-
gitude and latitude of the station. In addition, user
types include subscriber and non-subscriber. The
subscriber records gender characteristic, and gender
tags include 1 (male) and 2 (female). While the non-
subscriber does not record gender characteristic and
tag 0 is used to indicate.
For instance, the second column of Figure 1
shows a riding trajectory of a male subscriber. At
00:00:00 on October 1, 2017, he rented a public bike
with ID 30951 at station "9 Ave & W 45 St". After
riding for 457 seconds, he returned to the station "11
Ave & W 41 St". Delete trajectories with too short
riding durations, considering the abnormal ridings
caused by vehicle failure or other reasons. Delete the
trajectories with riding duration less than one mi-
nute. Delete trajectories with too long riding dura-
tions, considering the abnormal ridings caused by
vehicle theft, user forgetting or other reasons. Delete
the trajectories with riding duration longer than six
hours. After data preprocessing, 69066 valid data of
the riding trajectories are retained.
Figure 1: Examples for the data of user's riding trajectories
in Citi Bike.
3.2 Methods
Based on user's riding data, the flow information of
users among stations and the time information of us-
er's riding are excavated. The flow information will
be used to build the weight of the edge. The time in-
formation of user's riding will be the basis for con-
structing the time layer. Taking the riding time as
the hierarchical label, the flow-weighted temporal
network and the 24-layer multilayer network are
constructed respectively.
The network modelling method is illustrated by
taking the data of four riding trajectories as an ex-
ample. Assume that there are four riding trajectories,
as shown in Figure 2(a). There are two riding trajec-
tories from station A to station B. One riding trajec-
tory from station A to station C, and the other one
from station B to station C. The bike station is re-
garded as the node of the network. An edge will be
linked between the nodes if the riding behaviour oc-
curs between the stations. The direction of the edge
is from the start station to the end station. The traffic
flow between the stations is taken as the weight of
the edge. A flow-weighted directed network is con-
structed. According to the time information of riding
behaviour, the temporal network is established, as
shown in Figure 2(b).
(a)
(b)
Figure 2: The modelling diagram of temporal network.
When t = 6, there are two riding trajectories gen-
erated from station A to station B and to station C.
Thus, the network at t = 6 is composed of three
nodes A, B and C. While, at time t = 7, there is only
one riding trajectory generated from station B to sta-
tion C, thus the network at t = 7 consists of node B
and node C. Compared with the static network,
nodes in the temporal network change dynamically
with time. In addition, edges between nodes in the
temporal network are not persistent. For example,
there is no edge between nodes B and C at t = 6, but
directed edges exist between nodes B and C when t
= 7. The temporal network enables understanding of
network changes over time.
Through the above modelling method, each time
layer network can be obtained, and we can study
changes of the network over time. In addition, all
time layers are coupled into a network without con-
sidering the inter-layer links. That is, the adjacency
matrix of each layer is coupled in a hyper-adjacency
matrix. Suppose that the adjacency matrix of each
layer network is A
(t)
, t = 0,1,...,23. A
(t)
is an n
t
-order
square matrix. Where n
t
represents the number of
nodes per time layer network. They are different
from layer to layer. Without considering the inter-
layer links, the hyper-adjacency matrix is defined as
ISAIC 2022 - International Symposium on Automation, Information and Computing
424

()
()
()
=
23
1
0
00
00
00
A
A
A
A
(1)
Hyper-adjacency matrix A is an n
t
-order square
matrix. It corresponds to a 24-layer multilayer net-
work.
4 NETWORKS
4.1 Temporal Networks
The temporal network dynamically displays the
changes in the system twenty-four hours a day. Ac-
cording to the above method, the temporal network
is established, as shown in Figure 3. Obviously, the
network is time-varying. At t = 3, the network is
sparse. However, at t = 8 and t = 17, the network is
obviously dense, and the naked eye can no longer
count the number of nodes and edges. In addition,
the hub nodes (red colour) have also changed with
time. Through the visualization of these 24 net-
works, we can intuitively find that the network is
denser during the day and sparse at night. The dy-
namic change of the network with time is related to
the law of human behaviour. During rush hours on
and off work, a large number of riding behaviours
occur, which change the topology of the network.
In temporal network, the number of nodes and
the number of edges are time-varying. The time se-
ries of changes is shown in Figure 4. On the left and
right sides of the ordinate, the number of nodes and
the number of edges are identified respectively. The
number of edges shows bimodal feature. The first
peak appeared at 8 o'clock and the second peak ap-
peared at 17 o'clock, which indicate that a large
number of riding trajectories occurred during these
two periods. This is related to the law of human be-
haviour. More users use public bikes during rush
hours. During the period from t = 6 to t = 20, the
number of nodes in the network is stable. In the sys-
tem, there are about 600 stations with bike rental.
When t = 3, the number of nodes and the number of
edges are the least. At this time, there are only less
than one hundred stations with bike rental.
Figure 3: The temporal network.
In a network, the number of connected edges is
called the degree of the node; in a weighted network,
the sum of the edges weights is called the strength of
the nodes. In our flow-weighted temporal network,
the degree k
i
of node i indicates that there are riding
trajectories between the station i and other k
i
stations,
and the strength s
i
represents the total traffic flow be-
tween station i and other k
i
stations. The time-series
changes of the topological characteristic parameters
of the temporal network are shown in Figure 5. The
The Time-Varying of Topological Characteristics: Analysis Based on the Temporal Network on Public Bikes
425
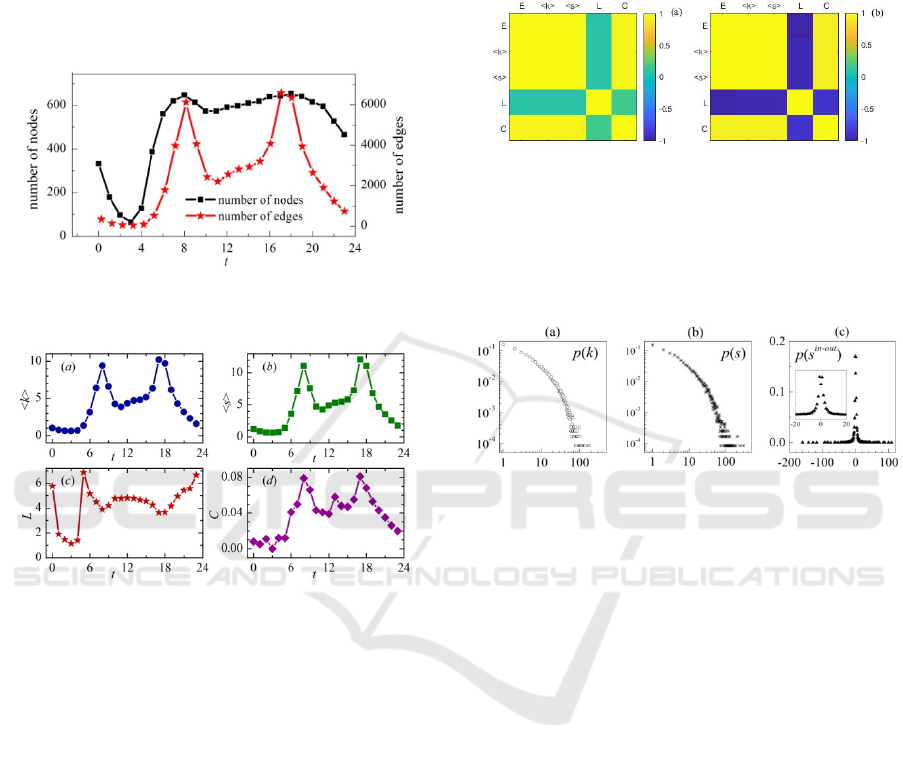
average degree <k>, the average strength <s>, and
the clustering coefficient C show obvious bimodal
characteristics. The two peaks appeared at 8 a.m. and
17 p.m. respectively. This is consistent with the bi-
modal feature of the number of edges in the temporal
network. When studying the time-varying nature of
temporal network, we find that some topological pa-
rameters are strongly correlated.
Figure 4: The number of nodes and edges of the temporal
network.
Figure 5: The topological characteristics of temporal net-
works: average degree, average strength, average smallest
path length and average clustering coefficient.
In fact, by analyzing correlations of topological
parameter time series, it can be found that: the num-
ber of edges, average degree, average strength and
clustering coefficient show strong positive correla-
tion (as shown in Figure 6); when the number of
nodes is stable (from t = 6 to t = 20), the average
shortest path length shows a strong negative correla-
tion with other topological parameters (as shown in
Figure 6(b)). When the number of nodes is fixed, the
average degree of the network will be larger if there
are more connected edges. More edges will bring
more total edge weights, so the average strength will
be greater. The existence of more edges will make it
easier to form triangles, and then the average cluster-
ing coefficient will be larger. In addition, more edges
increase the accessibility of the network, which re-
sults in a smaller average shortest path length. It can
be found that the average shortest path length of the
network is smaller at 8 a.m. and 17 p.m. Therefore,
from 6:00 to 20:00, the number of nodes is stable,
and the number of edges, the average degree, the av-
erage strength and the clustering coefficient show a
highly similar time-series trends. While the average
shortest path length exhibits the opposite trends.
Figure 6: Diagram for the correlation matrix of topological
parameters. The analysis object of (a) is the whole time
series of five topological parameters; and (b) is for frag-
ments of time series, from t = 6 to t = 20.
4.2 The 24-Layer Multilayer Network
Figure 7: The degree distribution p(k), the strength distri-
bution p(s) and the strength-difference distribution p(s
in-
out
) of the 24-layer multilayer network.
The time-varying characteristics of network topolo-
gy are found through the temporal network. On the
other hand, according to Equation (1), all the time
layers are coupled, and the 24-layer multilayer net-
work is used to analyze the Citi Bike system as a
whole. The network has 11988 nodes and 60786
edges. The degree distribution and the strength dis-
tribution are all power law distribution, as shown in
Figure 7(a) and Figure 7(b). Eighty percent of nodes
have a degree value less than 15. Only one thou-
sandth of the nodes has a degree value greater than
100. Bike ridings among rental stations distribute
heterogeneously. Furthermore, ninety percent of
nodes have a strength value less than 30. Nodes with
strength value greater than 100 account for three
thousandth. At bike rental stations, the hourly bike
flow distributes heterogeneously.
Strength-difference of a node is equal to the in-
strength minus the out-strength, which can measure
the net flow of information at the node. In the 24-
layer multilayer network, the strength-difference s
i
in-
out
of node i represents the net bike flow at the rental
station i. When s
i
in-out
≈ 0, the inflow and outflow of
bikes are in balance and the site is called a balanced
ISAIC 2022 - International Symposium on Automation, Information and Computing
426

station. When s
i
in-out
>0, the inflow is large and the
outflow is small. For this type of site, we need to
consider the transfer out of bikes when scheduling.
When s
i
in-out
<0, the inflow is small and the outflow
is large. Such site needs to transfer in bikes to meet
larger rental demands of bikes. The strength-
difference distribution p(s
in-out
) of the 24-layer multi-
layer network obeys Gaussian distribution, as shown
in Figure 7(c). The mean of the distribution is 0.045
and the standard deviation is equal to 2. In general,
at most sites, the number of rental bikes and the
number of returned bikes can maintain a balance.
5 CONCLUSIONS
Transport system is a typical complex system. We
study the structure of networks evolving with time.
In the temporal network, the number of edges, the
average degree, the average strength, and the cluster-
ing coefficient present obvious bimodal characteris-
tics. The two peaks appeared at 8 a.m. and 17 p.m.,
which is consistent with rush hours on and off work.
The time-dependent nature of the network reflects
the nature of system, and these time-dependent na-
ture are manifestations of human behaviour. In the
24-layer multilayer network, the degree distribution
is power law, the strength distribution is power law,
and the strength-difference distribution obeys Gauss-
ian. In the system, bike ridings among stations dis-
tribute heterogeneously and the hourly flow of the
station distributes heterogeneously. In most stations,
the number of rental bikes and returned bikes main-
tain balance. Furthermore, in temporal network, we
found strong correlations of topology parameters.
The research provides evidence for empirical re-
searches on temporal network, multilayer network
and transport network.
ACKNOWLEDGEMENTS
This work was supported by the Natural Science
Foundation of Inner Mongolia (Grant No.
2022LHMS01005) and the Fundamental Research
Funds for the Directly Affiliated Universities of In-
ner Mongolia (Grant No. JY20220095).
REFERENCES
Bao J, Shi X M, Zhang H, 2018. IEEE Access 6(11)
76049.
Bona D A A, Fonseca K, Rosa M O, Luders R, Delgado M
R, 2016. Mathematical Problems in Engineering
2016(6) 3898762.
Candelieri A, Galuzzi B G, Giordani I, Archetti F, 2019.
Public Transport 11(1) 27.
Cao N, Cao H Q, 2020. Chinese journal of Physics 65(3)
389.
Cats O, Krishnakumari P, 2020. Physica A 549(13)
124317.
Derrible S, Kennedy C, 2010. Physica A 389(17) 3678.
Feng H F, Bai F S, Xu Y J, 2019. Physica A 535(23)
122337.
Ferber C O, Holovatch T, Holovatch Y, Palchykov V,
2009. European Physical Journal B 68(2) 261.
Gallotti R, Barthelemy M, 2015. Scientific Data 2(1) 1.
Jiang X R, Wen X X, Wu M G, Song M, Tu C L, 2019.
Physica A 523(11) 364.
Lin L, He Z B, Srinivas P, 2018. Transport Research Part
C 97(12) 258.
Ma F, Liu F, Yuen K F, Lai P, Sun Q P, Li X D, 2019.
International Journal of Environmental Research and
Public Health 16(3) 329.
Munoz M F, Han k, Klemmer K, Jarvis S, 2018. ACM In-
ternational Joint Conference on Pervasive and Ubiq-
uitous Computing Singapore 1015.
Porter M A, 2020. Emerging Frontiers in Nonlinear Sci-
ence 32(NSCH) 131.
Ren T, Wang Y F, Liu M M, Xu Y J, 2016. Chinese Phys-
ics B 25(2) 5.
Saberi M, Ghamami M, Gu Y, Shojaei M H, Fishman E,
2018. Journal of Transport Geography 66(1) 154.
Shi X Y, Wang Y, Lv F S, Liu W H, Seng D W, Lin F,
2019. Journal of Visualization 22(6) 1177.
Sienkiewicz J, Holyst J A, 2005. Phys. Rev. E 72(4)
046127.
Viana M P, Costa L F, 2011. Physics Letters A 375(15)
1626.
Wang K L, Gulsah A, Chen Y J, 2018. Transport Re-
search Part A 116(10) 1.
Wang L N, Wang K, Shen J L, 2020. Physica A 545(9)
123498.
Wei S, Xu J G, Ma H T, 2019. Transport Planning and
Technology 42(3) 293.
Xu Q, Zu Z H, Xu Z J, Zhang W D, Zheng T, 2013.
Transport Systems Engineering Information Techno-
logy 13(1) 193.
Yang H, Xie K, Ma Y F, Wang Z Y, 2018. Transport Re-
search Record 2672(36) 92.
Yang R Q, Liu Y L, Liu Y F, Liu H, Gan W X, 2019. Sus-
tainability 11(20) 5634.
Yao Yi, Zhang Yifang, Tian Lixin, Zhou Nianxing, Li,
Zhilin, Wang Minggang, 2019. Sustainability 11(19)
5425.
Yu W, Ye X F, Chen J, Yan X C, Wang T, 2020. Sustain-
ability 12(3) 1113.
Zhang H, Zhuge C X, Zhao X, Song W B, 2018. Interna-
tional Journal of Modern Physics C 29(1) 1850004.
The Time-Varying of Topological Characteristics: Analysis Based on the Temporal Network on Public Bikes
427
