
Analysis of the Change of Tidal Flat Area in Jiangsu in the Past 20
Years Using Hydrodynamic Model and Landsat Data
Kaizheng Wang
1
, HuanLi
1
, Zeyu Han
1
, Jin Wang
1
and Weibo Lin
2
1
College of Harbour, Coastal and Offshore Engineering, Hohai University, Nanjing, China
2
Tidal Flat Research Center of Jiangsu Province, Nanjing, China
Keywords: Landsat, Delft3D, Coastline Change, Tidal Flat Area.
Abstract: Based on the Landsat series data, this paper interprets the remote sensing images of the coastal areas of Jiangsu
in 2001, 2011, and 2021, cooperates with the hydrodynamic model and the measured slope, calculates the
average spring tide line, and defines the area between the coastline and the average spring low tide line as a
tidal flat. Area, and analyze the changes in the Jiangsu coastline and tidal flat area in the past 20 years. The
results show that from 2001 to 2021, the coastline of Jiangsu has increased by nearly 17%, with an average
annual growth rate of 6 km/a, and the tidal flat area has decreased by nearly 10%, with an average annual
decrease rate of 17.31 km
2
/a.
1 INTRODUCTION
In recent years, with the rapid development of the
global economy, coastal cities have made
unprecedented efforts to develop and utilize coastal
areas. Especially in the context of global climate
change and rising sea levels, coastlines have
undergone drastic changes. More than half of the
world's coastlines have been eroded and retreated(Dar
& Dar, 2009). It has an enormous impact on ecology,
the environment, and the economy of society. For the
coast of China, due to tidal tides, storm surges, and
super-intensive reclamation, the position of the
coastline is constantly changing, and the tidal flat area
is reduced(Murray, 2014; Wu, Hou, & Xu, 2014; Y.
et al., 2022). Therefore, the monitoring and protection
of coastal zones are becoming more and more
important, which has important practical significance
for ecological protection and national development.
There are generally two methods for obtaining
information on coastal areas: field measurement and
remote sensing technology monitoring. The
traditional field survey is to use various instruments
and means to directly obtain tidal flat information
through the field survey(Allen & Duffy, 1998;
Lawler, 2006; R. et al., 2002). Remote sensing
technology can obtain information quickly and in a
large area, and it has an advantage that cannot be
underestimated for the difficulty of obtaining
information in the complex and changeable coastal
zone(Liu, Li, Zhou, Yang, & Mao, 2013; Lohani,
1999; Mason, Davenport, Robinson, Flather, &
McCartney, 1995; Ryu et al., 2008; Samuel, Huan,
Ebenezer, Temitope, & Zheng, 2022; Weiqi et al.,
2021; Xuhui et al., 2021). Previous studies on tidal
flat area changes only used low-tide images to extract
tidal flat areas. Due to differences in tidal levels, there
is no unified benchmark for tidal flat extraction, and
it is difficult to compare.
This paper intends to use a combination of field
measurement, remote sensing technology, numerical
simulation, and GIS technology to visually interpret
the remote sensing images of the coastal areas of
Jiangsu in 2001, 2011, and 2021, and extract the
Jiangsu coastline and instantaneous water edge in
each time phase. By establishing the Jiangsu coastal
hydrodynamic model to obtain the instantaneous tidal
level value of the waterside line, and synergistically
with the slope prediction analysis method, the average
spring tide low tide line is calculated. The area
between the coastline and the average spring and low
tide line is defined as the tidal flat area, and we
162
Wang, K., Li, H., Han, Z., Wang, J. and Lin, W.
Analysis of the Change of Tidal Flat Area in Jiangsu in the Past 20 Years Using Hydrodynamic Model and Landsat Data.
DOI: 10.5220/0011952300003536
In Proceedings of the 3rd International Symposium on Water, Ecology and Environment (ISWEE 2022), pages 162-168
ISBN: 978-989-758-639-2; ISSN: 2975-9439
Copyright
c
2023 by SCITEPRESS – Science and Technology Publications, Lda. Under CC license (CC BY-NC-ND 4.0)
analyze the changes in the Jiangsu coastline and tidal
flat area in the past 20 years.
2 MATERIALS AND METHODS
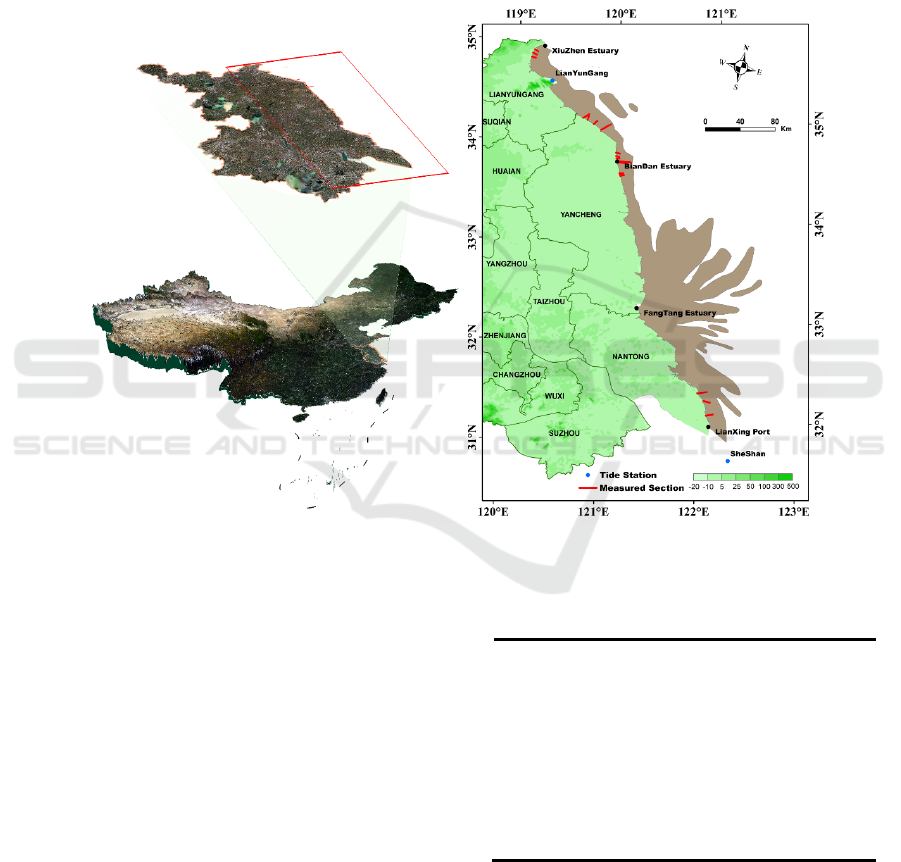
2.1 Study Area
This paper selects the coastal flat of Jiangsu as the
study area. The coast of Jiangsu starts from the mouth
of Xiuzhen River in the north and reaches Lianxing
Port in the east of Qidong in the south. For the
convenience of statistics, according to the
characteristics of the coastline of Jiangsu Province,
the coastline of Jiangsu Province is divided into three
sections: the northern section (Xiaozhen River
Estuary - Biandan River Estuary), the middle section
(Biandan River Estuary - Tuanjie Port), and the
southern section (Tuanjie Port - Lianxing Port).
Figure 1: Location of the study area.
2.2 Data Acquisition and Processing
The remote sensing data selected Landsat-7 ETM+
and Landsat-8 OLI images with low cloud content and
high definition in 2001, 2011, and 2021, a total of 9
images, and performed geometric correction and
image enhancement preprocessing on the remote
sensing images. The measured section data adopts the
topographic data of 22 sections along the coast of
Jiangsu Province obtained in April and September
2021 (Figure 1).
Table 1: Remote sensing image information
Region Sensor Year
North Landsat 7 ETM+ 2001、2011
North Landsat 8 OLI 2021
Middle Landsat 8 OLI 2021
Middle Landsat 7 ETM+ 2001、2011
South Landsat 7 ETM+ 2001、2011
South Landsat 8 OLI 2021
Analysis of the Change of Tidal Flat Area in Jiangsu in the Past 20 Years Using Hydrodynamic Model and Landsat Data
163

2.3 Methods
2.3.1 Shoreline Extraction
The artificial coastline is subject to seawall, and the
natural coastline is discussed in the following
situations.
Bedrock shoreline: A bedrock shoreline refers to a
coastline composed of exposed bedrock. The location
of the bedrock shoreline is defined as the trace line of
the sea-land boundary or the base of the cliff at the
average spring tide level for many years; Sandy
shoreline: Sandy shoreline refers to the shoreline
composed of sandy and gravelly sandstone. The
sandy shoreline is generally relatively straight, and
the upper part of the beach is often piled up into
ridged sandy sediment parallel to the shore, called a
beach ridge. The coastline is generally defined on the
seaward side of the top of the beach ridge; Muddy
shoreline: the muddy coast is mainly a low and flat
coast shaped by tidal action, and the intertidal width
is wide and gentle. The coastline should be defined
according to the comprehensive analysis of the trace
line of the sea-land boundary at the average high tide
level of the spring tide for many years, as well as the
trace line of the distribution of coastal vegetation,
plant debris, shell fragments, etc. Estuary shoreline:
The tidal gate (dam) outer boundary line or the first
bridge is used as the estuary shoreline. If the tidal
sluice (dam) or the first bridge is too deep inland, the
prominent point where the estuary suddenly widens is
selected as the estuary shoreline.
2.3.2 Hydrodynamic Model Establishment
To obtain the tidal level values of discrete points in a
typical area, a hydrodynamic model is established.
This time, Delft3D software was used for
hydrodynamic simulation. The tidal level data of
Lianyungang and Sheshan stations were collected for
model verification, and the root mean square errors
(RMSE) of tidal levels were 0.32m and 0.29m
respectively. The distribution of the stations is shown
in Figure 1, and the model verification results are
shown in Figure 2.
(a) Lianyungang
(b)Sheshan
Figure 2: Tide level verification result.
2.3.3 Average Spring Tide and Low Tide
Line Projection
(1) Instantaneous Waterline Discretization
The water's edge is the boundary between the water
body and the tidal flat at the time of remote sensing
image imaging. The low tide remote sensing image is
selected, and the visual interpretation method is used
to extract the instantaneous waterline. Due to the large
spatial range covered by the image, different locations
on the waterline at the same time have different tide
levels, so it is necessary to divide the instantaneous
waterline for assignment. In this paper, we first use
the ArcGIS buffer tool to draw a baseline of 800m
from the water's edge to the seaside and then use the
DASA tool to draw a vertical line every 500 meters
on the baseline as split lines. There is a total of 707
split lines in Jiangsu Province, and the intersection of
the waterline and the split lines, discrete points, is
extracted through ArcGIS.
(2) Tide Level Assignment and Slope
Calculation
Based on the established hydrodynamic model, the
tide level is extracted at the time of image imaging,
and then the tide level is assigned to the
corresponding discrete points.
ISWEE 2022 - International Symposium on Water, Ecology and Environment
164

The slope calculation of discrete points is to
calculate the slope by selecting the measured data of
22 sections along the coast of Jiangsu Province. The
data includes the measured points' longitude, latitude,
and elevation information. The formula is as follows
( 𝑖: Average slope; 𝐿: The distance between two
adjacent measuring points; 𝑧 : Elevation of two
adjacent measuring points;𝑥, : Coordinates of two
adjacent measuring points)
Through the above formula, the slope of each
section is calculated. According to the geographical
location, sections 1-8 are classified as the northern
area, sections 9-18 are classified as the central area,
and sections 19-22 are classified as the southern area.
The average value of the slopes of all sections in the
region is taken as the slope of the region, and finally,
the slopes of the northern, middle and southern
regions are 6.20‰, 1.42%, and 8.73‰, respectively.
(3) Average Spring Tide and Low Tide Line
Projection
The average spring tide low tide line is calculated
based on the tide level assignment results and the
slope calculation results. The calculation formula is as
follows:
In the formula: 𝛼
、𝛼
are the projected angles
of the slope in the longitude and latitude directions,
𝛼 is the slope assigned by discrete points, (𝑎
,𝑏
)(𝑎
,𝑏
)are the longitude and latitude coordinates
of the two points on the dividing line, 𝑥,𝑦 are the
longitude and latitude coordinates of the discrete
points on the average spring tide and low tide line, and
ℎ
,ℎ
are the tidal heights and the average spring
tide and low tide levels at the discrete points.
Figure 3: Calculation of discrete points of Multi-year
average low tide line
According to the results of the hydrodynamic
model, the low tide level of the spring tide is extracted
in each discrete point area. According to the above
formula, the latitude and longitude coordinates of the
discrete points of the average low tide level of the
spring tide are calculated, and the calculated discrete
points are connected in sequence to form a line, that
is, the average low tide line of the spring tide is
obtained.
3 RESULTS AND ANALYSIS
3.1 Coastline Change
The coastlines are classified into artificial coastlines,
natural coastlines, and estuary coastlines.
The results show that (Table 2), from 2001 to
2021, the coastline of Jiangsu Province as a whole
was mainly advancing to the sea, and the length of the
coastline increased from 728.69km to 849.67km.
Among them, the natural coastline decreased from
526.51km to 301.03km. It has increased from
197.92km to 542.40km, and the estuary line has
increased from 4.25km to 6.23km.
𝑖
𝑖
𝑖
⋯𝑖
𝑖
𝑛
(1)
𝑖
𝑧
𝑧
𝐿
𝑗 1,2,⋯,𝑛
(2)
𝐿
𝑥
𝑥
𝑦
𝑦
(3)
𝑡𝑎𝑛𝛼
𝑡𝑎𝑛𝛼
𝑎
𝑎
𝑏
𝑏
𝑎
𝑎
(4)
𝑡𝑎𝑛𝛼
𝑡𝑎𝑛𝛼
𝑎
𝑎
𝑏
𝑏
𝑏
𝑏
(5)
𝑥𝑎
ℎ
ℎ
𝑡𝑎𝑛𝛼
(6)
𝑦𝑏
ℎ
ℎ
𝑡𝑎𝑛𝛼
(7)
Analysis of the Change of Tidal Flat Area in Jiangsu in the Past 20 Years Using Hydrodynamic Model and Landsat Data
165

Table 2: Coastline length in Jiangsu Province in 2001, 2011,
and 2021 (km).
Region Year Natural Artificial Estuary All
North
2001 83.79 122.02 2.00 207.81
2011 82.41 127.62 2.23 212.26
2021 81.41 176.89 2.33 260.64
Middle
2001 219.69 42.47 1.97 264.13
2011 204.96 63.27 2.54 270.76
2021 148.54 167.73 2.62 318.88
South
2001 223.03 33.43 0.29 256.75
2011 131.57 143.12 0.86 275.55
2021 71.09 197.78 1.56 270.43
All
2001 526.51 197.92 4.25 728.69
2011 418.93 334.28 5.37 758.58
2021 301.03 542.40 6.23 849.67
Figure 4: Coastline of Jiangsu Province in 2001, 2011 and
2021.
The northern coastline increased from 207.81km to
260.64km from 2001 to 2021, of which the natural
coastline decreased from 83.79km to 81.41km, the
artificial coastline increased from 122.02km to
176.89km, and the river port line increased from 2km
to 2.33km.
Figure 5: Variation of coastline length in Jiangsu Province.
During 2001-2021, the central coastline increased
from 264.13km to 318.88km, of which the natural
coastline decreased from 219.69km to 148.54km, the
artificial coastline increased from 42.47km to
167.73km, and the river port line increased from
1.97km to 2.62km.
The southern coastline increased from 256.75km
to 270.43km during 2001-2021, of which the natural
coastline decreased from 223.03km to 71.09km, the
artificial coastline increased from 33.43km to
197.78km, and the river port coastline increased from
0.29km to 1.56km.
3.2 Changes in the Area of Tidal Flats
The upper boundary of the tidal flat is the coastline,
and the lower boundary is on the calculated average
spring and low tide line. The final calculation of the
tidal flat area along the Jiangsu coast in 2001 is
3447.22 km
2
, and the tidal flat area along the Jiangsu
coast in 2021 is 3100.94 km
2
.
Figure 6: Tidal flats in Jiangsu Province in 2001 and 2021.
ISWEE 2022 - International Symposium on Water, Ecology and Environment
166

The area of tidal flats in Jiangsu Province has
decreased by nearly 10% from 2001 to 2021, with an
average annual decrease rate of 17.31 km
2
/a.
Figure 7: Overlay map of tidal flats in Jiangsu Province in
2001 and 2021.
4 CONCLUSIONS
Based on multi-temporal remote sensing image data
and topographic survey data, combined with
numerical simulation technology, the evolution
characteristics of the coastline in Jiangsu Province
and the distribution of monitoring tidal flat resources
are analyzed. The main conclusions are as follows:
(1) From 2001 to 2021, the length of the coastline
shows an overall increasing trend, in which the
artificial coastline has increased significantly and the
natural coastline has decreased.
(2) From 2001 to 2021, the area of coastal tidal flats
in Jiangsu Province has decreased significantly, and
active measures should be taken to maintain the
stability of tidal flat resources.
ACKNOWLEDGEMENTS
National Natural Science Foundation of China
(NSFC, grant no. 41976156)
This work was supported in part by the Marine
Science and Technology Innovation Project of
Jiangsu Province under Grant JSZRHYKJ202214, in
part by the Carbon Peak Carbon Neutral Science and
Technology Innovation Projects of Jiangsu Province
under Grant BK20220020, and in part by the National
Natural Science Foundation of China under Grant
41401371.
REFERENCES
Allen, J.R.L., & Duffy, M.J. (1998). Medium-term
sedimentation on high intertidal mudflats and salt
marshes in the Severn Estuary, SW Britain: the role of
wind and tide. Marine Geology, 150(1).
Dar, Imran A., & Dar, Mithas A. (2009). Prediction of
Shoreline Recession Using Geospatial Technology: A
Case Study of Chennai Coast, Tamil Nadu, India.
Journal of Coastal Research, 25(6).
Lawler, D.M. (2006). Advances in the continuous
monitoring of erosion and deposition dynamics:
Developments and applications of the new PEEP-3T
system. Geomorphology, 93(1).
Liu, Yongxue, Li, Manchun, Zhou, Minxi, Yang, Kang, &
Mao, Liang. (2013). Quantitative Analysis of the
Waterline Method for Topographical Mapping of Tidal
Flats: A Case Study in the Dongsha Sandbank, China.
Remote Sensing, 5(11).
Lohani, B. (1999). Construction of a Digital Elevation
Model of the Holderness Coast using the waterline
method and Airborne Thematic Mapper data.
International Journal of Remote Sensing, 20(3).
Mason, D. C., Davenport, I. J., Robinson, G. J., Flather, R.
A., & McCartney, B. S. (1995). Construction of an
inter‐tidal digital elevation model by the ‘Water‐Line’
Method. Geophysical Research Letters, 22(23).
Murray, N. J., Clemens, R. S., Phinn, S. R., Possingham, H.
P., & Fuller, R. A. (2014). Tracking the rapid loss of
tidal wetlands in the Yellow Sea. Frontiers in Ecology
and the Environment, 12(5).
R., Cahoon D., C., Lynch J., P., Hensel, R., Boumans, C.,
Perez B., B., Segura, & W., Day J. (2002). High-
Precision Measurements of Wetland Sediment
Elevation: I. Recent Improvements to the
Sedimentation-Erosion Table. Journal of Sedimentary
Research, 72(5).
Ryu, Joo-Hyung, Kim, Chang-Hwan, Lee, Yoon-Kyung,
Won, Joong-Sun, Chun, Seung-Soo, & Lee, Saro.
(2008). Detecting the intertidal morphologic change
using satellite data. Estuarine, Coastal and Shelf
Science, 78(4).
Samuel, Daramola, Huan, Li, Ebenezer, Otoo, Temitope,
Idowu, & Zheng, Gong. (2022). Coastal evolution
Analysis of the Change of Tidal Flat Area in Jiangsu in the Past 20 Years Using Hydrodynamic Model and Landsat Data
167

assessment and prediction using remotely sensed front
vegetation line along the Nigerian Transgressive Mahin
mud coast. Regional Studies in Marine
Science(prepublish).
Weiqi, Dai, Huan, Li, Zheng, Gong, Zeng, Zhou, Yuan, Li,
Lizhu, Wang, Hongyang, Pei. (2021). Self-organization
of salt marsh patches on mudflats: Field evidence using
the UAV technique. Estuarine, Coastal and Shelf
Science, 262.
Wu, Ting, Hou, Xiyong, & Xu, Xinliang. (2014). Spatio-
temporal characteristics of the mainland coastline
utilization degree over the last 70 years in China. Ocean
and Coastal Management, 98.
Xuhui, Zhang, Huan, Li, Zheng, Gong, Zeng, Zhou, Weiqi,
Dai, Lizhu, Wang, & Samuel, Daramola. (2021).
Method for UAV-based 3D topography reconstruction
of tidal creeks. Journal of Geographical Sciences,
31(12).
Y., Pan, S., Yin, Y.P., Chen, Y.B., Yang, C.Y., Xu, & Z.S.,
Xu. (2022). An experimental study on the evolution of
a submerged berm under the effects of regular waves in
low-energy conditions. Coastal Engineering, 176.
ISWEE 2022 - International Symposium on Water, Ecology and Environment
168
