
Water Quality Analysis and Health Risk Assessment of Reservoir in
Qilian Mountain
Kai Ma
1,2,† a
, Huidong Shen
1,2
, Rui Min
1,2
, Guozhen Zhang
1,2
and Tianhong Zhou
1,2,*
1
School of Environmental and Municipal Engineering, Lanzhou Jiaotong University, Lanzhou 730070, China
2
Key Laboratory of Yellow River Water Environment in Gansu Province, Lanzhou,730070, China
Keywords: Qilian Mountain, Water Environmental Quality, Health Risk Assessment.
Abstract: Qilian Mountain is an essential ecological security barricade in China, but the research on water quality
investigation and health and safety evaluation of Qilian Mountain is currently blank. In this essay, the
environment health of the water were assessed using the Nemero index technique and the health risk
assessment method. The findings revealed that the reservoir's overall water quality in the national park was
satisfactory, and the Nemerow index was between 2.142 and 3.548. Chromium (Cr), which accounted for
more than 78% of the health risk value of chemical carcinogens, was the primary contributor to the
carcinogenic risk. Ammonia nitrogen, fluorine, and mercury account for the majority of the health effects of
non-carcinogenic substances, representing 60.01%~79.10% of the non-carcinogenic risk value. Chemical
carcinogens were primarily responsible for the overall health risks. Afterward, on the basis of strict control of
pollutant discharge standards, the government should focus on rehabilitating mines to ensure that heavy metal
levels in the water were kept low. Research on the health hazards and quality of the water environment in
Qilian Mountain National Park can help management and conservation of the water environment in this region.
1 INTRODUCTION
Due to their abundance, ease of bioaccumulation,
persistence, and toxicity even at low concentrations,
the heavy metals were considered serious
environmental pollutants in aquatic environments.
(Wang, et al. 2017, Zhao et al. 2020). Through the
food chain, heavy metals can enter humans and cause
health problems in some way, either directly or
indirectly (Gaofeng et al. 2008). There are three
primary means that people can be exposed to trace
metals: directly intake, inhaling them through the
mouth and nose, and absorbing them through exposed
skin, and the main ways were through drinking water
and the skin absorbing. (Giri et al. 2014). Chemical
carcinogens account for 90% of cancers, according to
previous studies, and drinking water was a major
contributor (Giri et al. 2015, Smith et al. 1992). The
high level concentration of heavy metal water
pollution is strongly corresponded with the health risk
posed by chemical carcinogens (Smith et al. 1992).
Furthermore, a low dose and prolonged exposure to
heavy metals can cause harm to the human body.
a
https://orcid.org/ 000001-5384-8652
It should be pointed out that in the past,
management and estimation of drinking water
sources by individuals were often evaluated by
comparing traditional water quality indicators. This
comparison has some shortcomings and singleness,
which minimizes or disregards the possibility of toxic
and harmful causes having some effects on human
health (Li et al. 2016a). At this stage, China's water
quality estimation is mainly based on the surface
water environment quality standard (China.
Environment Protection Department, 2002). The
method is simple and intuitive, and the evaluation
conclusion is single. With the advancement of science
and technology at home and abroad and the
continuous progress of China's water environmental
protection policies, it has been challenging to meet
the current requirements for water environmental
management with the current water quality standards
(Ranran et al. 2016a). In 1980s, the National
Academy of Sciences and the US Environmental
Protection Agency (EPA) first introduced the health
risk assessment model into their research (US.
Emergency and Response, 1989). Some
300
Ma, K., Shen, H., Min, R., Zhang, G. and Zhou, T.
Water Quality Analysis and Health Risk Assessment of Reservoir in Qilian Mountain.
DOI: 10.5220/0012024200003536
In Proceedings of the 3rd International Symposium on Water, Ecology and Environment (ISWEE 2022), pages 300-307
ISBN: 978-989-758-639-2; ISSN: 2975-9439
Copyright
c
2023 by SCITEPRESS – Science and Technology Publications, Lda. Under CC license (CC BY-NC-ND 4.0)
achievements have been made, and some evaluation
guidelines and guidelines have been established,
which makes the threat of water environmental safety
to human health have a clear research direction.
Based on the existing research, some scholars have
studied the environmental health risks of surface
water and drinking water from the perspectives of
pharmacy and pathology (Lim et al. 2012, Robu et al.
2015).
In China's western region, Qilian Mountain serves
as an essential ecological security barricade, which is
located in the Yellow River Basin and Hexi Corridor.
In addition, this region is a priority for China's
conservation of biodiversity and a vital water source.
Due to the important ecological safety position, for
the water security of the Qilian Mountain National
Park in China, heavy metal contamination in the
surface water has been a significance issue.
Currently, research on water quality assessment
methods focuses on the pros and cons, improving and
applying the single-factor strategy, the Nemerow
index strategy and the fuzzy all-inclusive strategy
(Ranran et al. 2016b). Presently, in the estimation of
the reservoir water environment in Qilian Mountain
National Park, there is currently no research on
combining water quality and health risk valuation. An
all-inclusive awareness of reservoir water
environment quality can be gained by combining
water quality estimation with health risk valuation,
understand the water environment status, and help
strengthen the management and control of reservoir
water risk, and formulate and implement
corresponding pollutant control strategies. In
addition, the environmental problem in Qilian
Mountain National Park has always been a national
key problem, and the closed mines have always been
a major risk source due to historical reasons.
Therefore, this study uses Nemerow index and EPA
health risk evaluation strategy to estimate the water
environment quality and water quality health risk of
five reservoirs in Qilian Mountain, aiming at
comprehensively understanding the current water
quality situation in Qilian Mountain and providing
reference for the restoration and management of
Qilian Mountain.
2 MATERIAL AND METHODS
The water quality in the reservoir of Qilian Mountain
National Park was evaluated using the Nemerow
index, and the EPA health risk evaluation model was
applied to study the health risk from drinking water.
2.1 Research Design
In this study, 99°30 '21 "E-102°40' 38" E, 37°30 '41
"N-39°9' 11" N in Qilian Mountain National Park
were selected as the study areas, which are located in
Zhangye and Wuwei cities of Gansu Province with a
large population. It is a temperate continental climate
with an annual average rainfall of 300~400mm and
an altitude of 1640m~2470m. The typical reservoirs
selected in this paper were D1 (Xiying
Reservoir,102°40 '38 "E, 37°30' 41" N), D2
(Bailanghe Reservoir,99°30 '21 "E, 39°9" 11 "N), D3
(Longqu Reservoir,100°11 '44 "E, 56 38°33" N), D4
(Shuangshusi Reservoir,100°41 40 "E, 38°19 38" N),
D5 (Dayekou Reservoir,100°44 "E, 38°31 25 "N),
conducted water quality survey sampling from 10 to
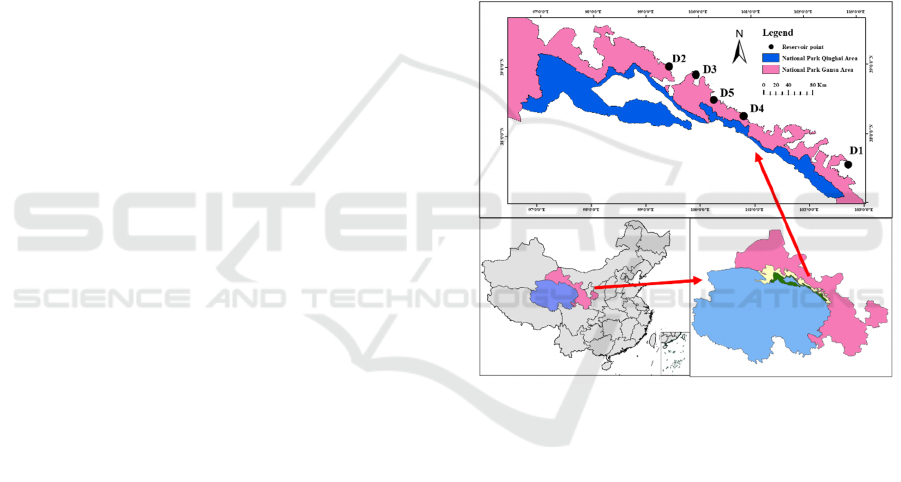
15 August 2020. The study area is shown in Figure 1.
Figure 1: Map of sampling sites in the Qilian Mountain
National Park. The insets show the Qilian Mountain
National Park within the Gansu Province and Qinghai
Province(lower left), and the position of the Gansu
Province and Qinghai Province within China(lower right)
2.2 Physico-Chemical Analyses
In this paper, the conventional indexes stipulated in
the surface water environmental quality standards
were selected for testing. Considering that the fecal
coliform was not included in the calculation of
Nemero index method, the fecal coliform was
excluded from the detection data. In addition, sulfides
and anionic surfactants were not included in the
detection index, mainly because the Qilian Mountain
National Park was mainly dominated by mineral
activities, animal husbandry and so on, and human
domestic sewage discharge has little impact.
Water Quality Analysis and Health Risk Assessment of Reservoir in Qilian Mountain
301
At the sampling point, ACH-HQ30D(America)
was used to detect Water temperature (WT) and
dissolved oxygen (DO) in the field. PHS-3C(LeiCi,
Shanghai, China) acidity meter was used to detect pH.
Chemical oxygen demand (COD), ammonia (NH
3
-N),
nitrate (NO
3
-), total nitrogen (TN) and total
phosphorus (TP) were measured in the laboratory, and
measured by UV-visible spectrophotometer (UV-
2800, UNICO,US). For the measurement of iron (Fe),
copper (Cu), selenium (Se), manganese (Mn),
mercury (Hg), arsenic (As), lead (Pb), cadmium (Cd),
chromium (Cr), petroleum oil, volatile phenol,
fluoride, cyanide, we send water samples to qualified
companies for testing.
2.3 Correlation Analysis
Pearson correlation analysis was carried out in this
study to test the relationship between the properties
and occurrence of detected heavy metals and between
heavy metals and other components. The correlation
is deemed statistically significant if the significance
level (P) is less than 0.05. SPSS (Version 22) was
used for all statistical analyses.
2.4 Nemerow Index Method
Nemerow Index method is a weighted multi-factor
environmental quality assessment method, which
uses additional annotations and considers extreme
values or significant maximum values. The surface
water quality is determined according to the
comprehensive assessment score F and the surface
water quality classification (table 1)(Chen et al. 2012,
Silva et al. 2019). The F is calculated according to
formulas (1) and (2):
Table 1: Surface water quality classification
Grade Excellent Preferable Good
F <0.80 0.80-2.50 2.50-4.25
Worse Worst
F 4.25-7.20 >7.20
(1)
(2)
In the formula, 𝐹
is the average value of the score
F of each individual component; 𝐹
is the Single
component score value of surface water (table2);
𝐹
is the maximum value of the individual
component average𝐹
; n is the number of items.
Table 2: Single component scores of surface water
Water quality category Ⅰ Ⅱ Ⅲ Ⅳ Ⅴ
F
i
0 1 3 6 10
2.5 Health Risk Assessment
Health risk estimation is to evaluate the risk of
individual health being affected by harmful factors by
estimating the probability of adverse effects of
harmful factors on human health (Zhao et al. 2018).
According to the classification of chemicals by the
International Center for Cancer Research, chemicals
in Class 1 (with sufficient evidence of human body
cancer) and Class 2 Group A (with limited evidence
of human body cancer but sufficient evidence of
animal body cancer) are chemical carcinogens, while
others are non-chemical carcinogens(US. Emergency
and Response, 1989).
The health risk assessment models of chemical
carcinogenic and non-carcinogenic metal elements
are different.
2.5.1 Chemical Carcinogens Health Risk
Assessment Model
(3)
(4)
(5)
Where R
c
ig
is the average annual personal
carcinogenic risk (a
-1
) of chemical carcinogen i
through food route; D
ig
is the daily average exposure
dose of chemical carcinogen i per unit body weight
(mg (kg·d)
-1
); Q
ig
is the carcinogenic intensity
coefficient (mg (kg·d)
-1
) of chemical carcinogen i
through food route, their intensity coefficients are
shown in table 3.; L is the average life span of human
beings (a, take 70); Q is the average daily drinking
water for adults (L·d
-1
, taking 2.2 L·d
-1
); 𝐶
is the
mass concentration of chemical carcinogen i (mg·L
-
1
); W is the per capita weight (kg, calculated as 70 kg).
2.5.2 Non-Carcinogen Health Risk
Assessment Model
(1)
(7)
(8)
ISWEE 2022 - International Symposium on Water, Ecology and Environment
302
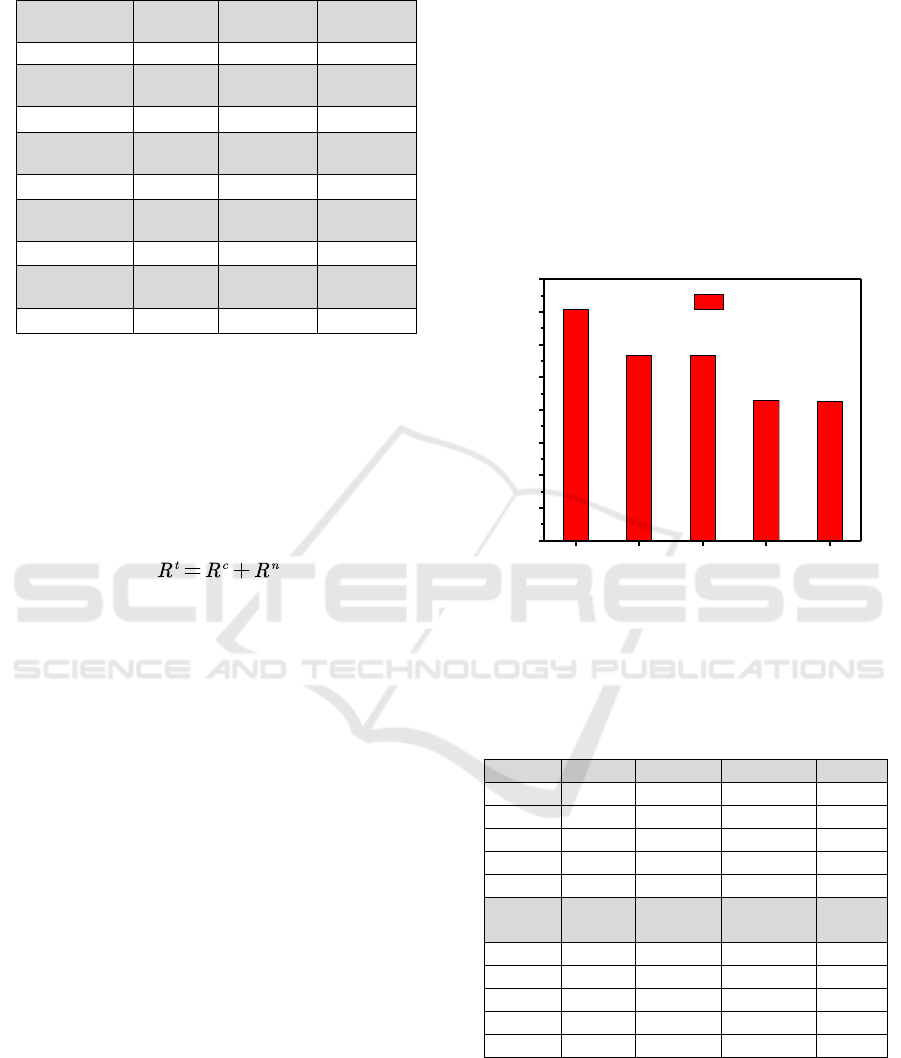
Table 3: The values of Q
ig
and RfD
j
Chemical
carcinogen
Cr(Ⅵ) Cd As
Q
ig
41 6.1 15
Non-
carcino
g
en
NO
3
-
NH
3
-N
Volatile
Phenol
𝑅𝑓𝐷
1.6 9.7×10
-1
1.0×10
-1
Non-
carcinogen
Fluoride Cyanide Hg
𝑅𝑓𝐷
6.0×10
-2
3.7×10
-2
3×10
-4
Non-
carcino
g
en
Pb Cu Zn
𝑅𝑓𝐷
1.4×10
-3
5×10
-3
3×10
-1
Non-
carcino
g
en
Fe Mn Se
𝑅𝑓𝐷
3×10
-1
1.4×10
-1
5×10
-3
Where R
n
jg
is the average annual personal
carcinogenic risk of non-carcinogen j via the edible
route (a
-1
); RfD
j
is the reference dose of the non-
carcinogen j via the edible route (mg·(kg·d)
-1
, and
their reference measurement values are shown in
table 3; 𝐶
is the mass concentration of the chemical
carcinogen j (mg·L
-1
).
The overall health hazard risk 𝑅
of water
environment is:
(9)
At present, the public acceptable risk levels
recommended by different institutions are different.
Some European countries recommend 1×10
-6
a
-1
, the
International Commission on Radiation Protection
recommends 5×10
-5
a
-1
, and the US Environmental
Protection Agency recommends 1×10
-4
a
-1
.
3 RESULTS AND DISCUSSION
Nemerow index method was used to evaluate the
water quality of each reservoir, and USEPA health
risk assessment model was used to evaluate the health
risks of each reservoir. The results are as follows:
3.1 Water Quality Estimation
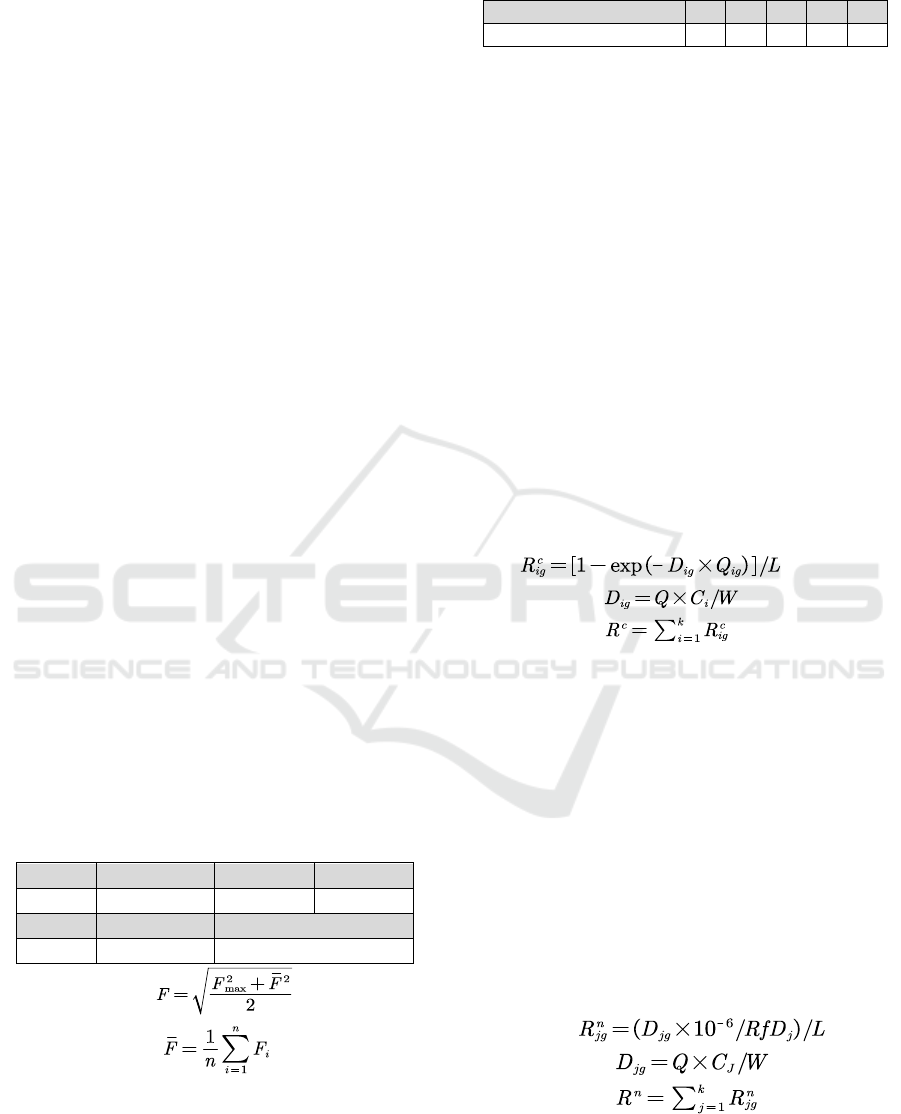
Figure 2 depicted the water quality evaluation scores
of various reservoirs, which were used to conduct a
comprehensive estimation of the water quality of five
reservoirs in the Qilian Mountain Nature Reserve by
the Nemerow index (F). The F values of Xiying
reservoir, Bailanghe reservoir and Longqu reservoir
are 2.837~3.548, and the corresponding evaluation
results are good. The F values of Shuangshusi
reservoir and Dayekou grottoes are 2.142 and 2.129,
and the corresponding evaluation results were good.
Average concentrations of total phosphorus,
mercury and cadmium in Xiying reservoir, Bailanghe
reservoir and Longqu reservoir are 0.04, 0.00053 and
0.0011mg/L,0.03, 0.00037 and 0.0011mg/L,0.03,
0.00027 and 0.0011mg/L. The concentrations of total
phosphorus, mercury and cadmium exceed the
standard limits specified in the surface water
environment quality standard, which leads to the
reservoir evaluation performances being worse than
other reservoirs. Therefore, the discharge of total
phosphorus, mercury and cadmium pollutants in
rivers and lakes should be strictly controlled.
Figure 2: Comprehensive evaluation of the water quality of
each reservoir
3.2 Correlation Analysis
Table 4: The correlation between reservoir elements and
other components
(1)
.
Item Fe Cu Se Mn
WT
(2)
0.443 -0.615 -0.44 0.711
DO -0.818 0.683 -0.499 -0.575
pH 0.291 -0.182 0.916* -0.595
NH
3
-N 0.158 0.545 0.258 0.242
NO
3
-
0.176 -0.961** 0.267 0
Item Hg As
petroleum
oil
Pb
WT
(2)
0.865 -0.678 -0.497 0.66
DO -0.236 0.559 -0.387 -0.754
pH -0.635 0.601 0.128 -0.409
NH
3
-N -0.497 -0.032 0.940* 0.279
NO
3
-
0.471 -0.382 -0.28 0.154
(1) ** shows that the correlation is significant when the confidence
level (two-sided) is 0.01; * shows that the correlation is significant
when the confidence level (two-sided) is 0.05, the same below.
Pearson correlation coefficient is used to express
the strength of correlation among various factors.
According to the correlation between elements and
D1 D2 D3 D4 D5
0.0
0.5
1.0
1.5
2.0
2.5
3.0
3.5
4.0
2.129
2.142
2.840
2.837
Nemerow index (F)
Reservoirs
Nemerow index (F)
3.548
Water Quality Analysis and Health Risk Assessment of Reservoir in Qilian Mountain
303
other components in Qilian Mountain National Park
Reservoir (table 4), it can be seen that Cu and NO
3
-
indicated a significant relationship, with a correlation
coefficient of -0.961, showing a strong negative
correlation. The concentration of Cu will decrease
with the increase of NO
3
-
. The positive correlation
between pH and Se was extremely significant, with a
correlation coefficient of 0.916. The concentration of
Se will increase with pH. Petroleum oil is positively
correlated with NH
3
-N with a correlation coefficient
of 0.940. Petroleum oil concentration increases with
the increase of NH
3
-N concentration. Except for this,
there is no clear connection between the listed
elements and their components. Elements such as Fe,
Mn, Hg, As and Pb in Qilian Mountain Reservoir are
not obviously affected by other components.
3.3 Health Risk Assessment
According to carcinogenicity of risk factors, health
risks are divided into carcinogenic health risks and
non-carcinogenic health risks.
3.3.1 Health Risks of Chemical Carcinogens
From the chemical carcinogenic health risk
evaluation model, the health risk values of chemical
carcinogens in reservoirs in Qilian Mountain National
Park are calculated, and the results are shown in
figure 3.
The mass concentration of metal Cr in each
monitoring point is lower than the value of machine
detection line, so the risk of chemical carcinogens is
calculated with the value of machine detection line as
its mass concentration. According to figure 3, the
health risk value of chemical carcinogens in
reservoirs in Qilian mountain national park is
between 3.01×10
-6
and 7.344×10
-5
a
-1
, which is lower
than the public maximum acceptable risk value
recommended by us environmental protection
agency. The health risk of chemical carcinogens is
mainly caused by Cr (Ⅵ), accounting for 78.17%-
80.47% of the risk value, followed by Cd, accounting
for 16.23%-18.63%. The health risk value of
chemical carcinogens at each monitoring point is
D3=D5>D2= D4>D1. Although the Cr, the main
chemical carcinogenic health risk element, has
reached the Class III water quality standard of surface
water in five reservoirs, it still has a high carcinogenic
risk, which is primarily attributable to the
carcinogenic risk associated not only with the content
of Cr but also with the carcinogenic intensity
coefficient, the per-capita water consumption, the
exposure frequency, the average body weight and the
average life span of human beings.
However, due to a large number of mining
activities in Qilian Mountain in early years
(centralized remediation has been carried out in
recent years, and all of them have been shut down for
restoration and remediation), when rainfall causes
natural disasters, chemical carcinogenic metals may
enter the water body and enter the reservoir, so there
is still a great risk of metal Cr. Once it is detected in
the reservoir, its risk value will be 10 times higher
than the current risk value. Because of paying
attention to Cr element, it is necessary to do a good
job in mine restoration and soil vegetation protection.
Figure 3: Health risks of chemical carcinogens in reservoirs
in Qilian Mountain National Park
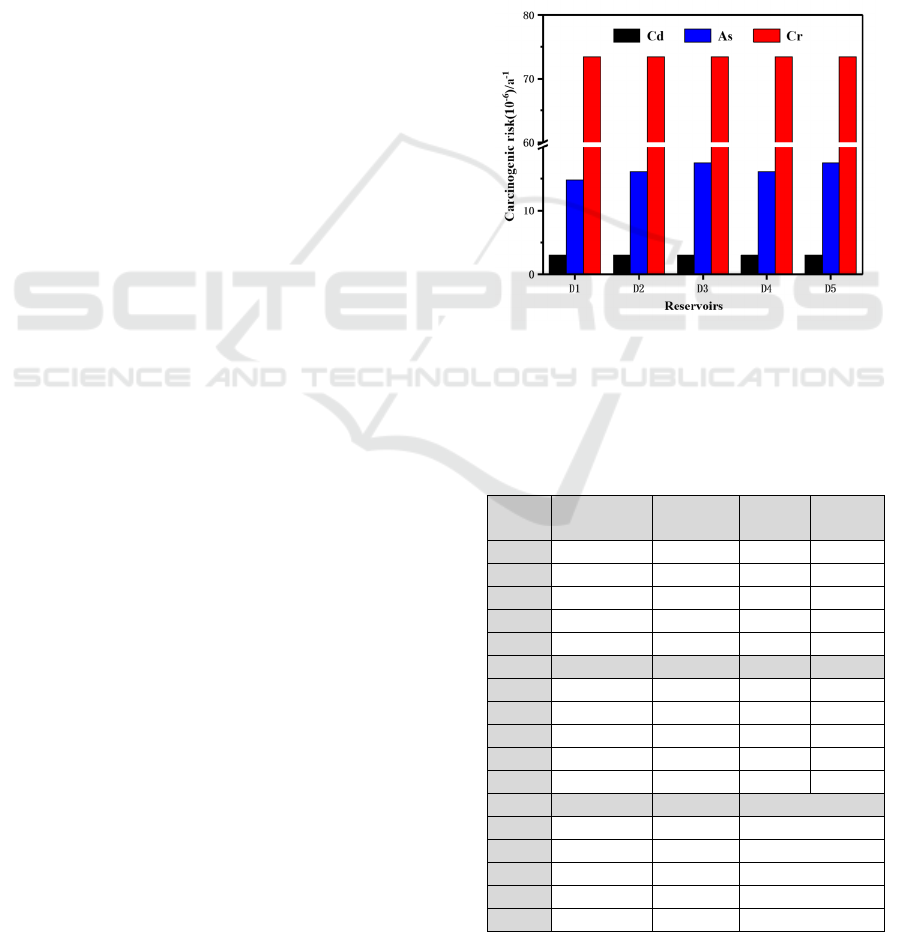
3.3.2 Health Risks of Non-Carcinogens
Table 5: Non-carcinogen health risk value of Qilian
Mountain National Park Reservoir(×10
-10
)
Name
R
n
(NH
3
-
N)
R
n
(NO
3
-
)
R
n
(F) R
n
(Hg)
D1 2.722 0.370 7.483 7.932
D2 2.497 0.463 7.483 5.537
D3 2.133 0.417 7.483 4.041
D4 3.339 0.417 7.483 2.993
D5 3.339 0.185 7.483 1.946
Name R
n
(Pb) R
n
(Cu) R
n
(Zn) R
n
(Fe)
D1 0.609 1.167 0.012 0.958
D2 0.224 0.988 0.012 0.659
D3 0.224 1.347 0.012 0.943
D4 0.417 1.167 0.012 1.063
D5 0.224 5.478 0.012 0.763
Name R
n
(Mn) R
n
(Se) R
n
D1 1.379 1.257 23.890
D2 0.048 1.706 19.618
D3 0.077 2.065 18.742
D4 0.673 2.604 20.168
D5 0.212 1.706 21.348
ISWEE 2022 - International Symposium on Water, Ecology and Environment
304

Many researchers believe that non-carcinogens
include NH
3
-N, NO
3
-
, fluoride, volatile phenol,
cyanide, mercury, lead, copper, zinc, iron,
manganese, selenium, etc(Chai et al. 2021, Wu et al.
2021). According to the non-carcinogen health risk
assessment model, the non-carcinogen health risk
values of each reservoir monitoring point in Qilian
Mountain National Park are calculated, among which
volatile phenol and cyanide are lower than the
instrument detection line values, so they are not listed
in the table 5. The non-carcinogenic health risks
caused by various pollutants are quite different.
Among them, the health risks caused by ammonia
nitrogen, fluoride, and mercury are relatively large.
The health risks caused by these three pollutants
account for 60.01%-79.10 of the non-carcinogenic
risk values. the health risk value caused by other
pollutants accounts for 20.90%-39.99% of the non-
carcinogenic risk value. Among the three main health
risk pollutants, fluoride has the highest risk value,
followed by mercury and ammonia nitrogen.
According to table 5, the non-carcinogenic health
risks of the monitoring points of reservoirs in Qilian
mountain range from 1.874×10
-9
to 2.389×10
-9
a
-1
,
and the order of non-carcinogenic health risks of the
monitoring points of reservoirs is
D1>D5>D4>D2>D3. The risk's value were less than
the Royal Society's negligible risk level(10
-7
a
-1
) and
the Netherlands Construction and Environment
Agency's negligible risk level(10
-8
a
-1
), respectively.
As a result, non-carcinogens pose no significant
threat to human health through drinking water.
3.3.3 Total Health Risk
The total health risk of water environment is the sum
of risks caused by chemical carcinogens and non-
carcinogens, which reflects the potential risks of
water environment to human health, animals and
plants(Zhao et al. 2016, B et al. 2019), and long-term
accumulation will lead to cancer, genotoxicity, etc.
The overall health risk of each reservoir monitoring
point in Qilian Mountain National Park is shown in
figure 4.
As depicted in figure 4, each monitoring site in the
Qilian Mountain National Park has a similar total
health risk value, ranging from 9.136×10
-5
to
9.402×10
-5
a
-1
, and the health risk value is mainly
caused by the health risk of chemical carcinogens. As
we all know, there used to be many mineral
enterprises in Qilian Mountains, which were rich in
mineral resources, resulting in serious illegal mining
and serious environmental damage. Heavy metals
have caused serious pollution to water bodies. In
recent years, the state and local governments have
taken many strict measures, shut down all mining
activities in national parks, and carried out mine
remediation and centralized restoration, with
remarkable results.
The health risks of non-carcinogens ranged from
1.874×10
-9
to 2.389×10
-9
a
-1
, and those of chemical
carcinogens ranged from 3.01×10
-6
to 7.344×10
-5
a
-1
.
It can be seen that the health risks of non-carcinogens
were significantly lower than those of carcinogens,
which is similar to the research findings of many
researchers (Rahman et al. 2020, A et al. 2020).
Therefore, as a management department, we should
be mindful of the health risks of chemical carcinogens
and changes in the concentration of chemical
carcinogens in water.
Figure 4: Total health risks of various reservoirs in Qilian
Mountain National Park.
4 CONCLUSION
(1) The F value of each reservoir ranges from 2.142
to 3.548, and the overall water quality is stable at a
good and better level. Because the Hg content of
Xiying reservoir is the highest among the five
reservoirs, the F value of Xiying reservoir is the
highest, reaching 3.548, which should be paid
attention to by relevant departments. Through
correlation analysis, NO
3
-
, pH and NH
3
-N
concentrations have a certain correlation with Cu, Se
and Petroleum oil, and their changes affect each
other.
(2) The health risks of chemical carcinogens in
five typical reservoirs ranged from 3.01×10
-6
to
7.344×10
-5
a
-1
, mainly produced by Cr (Ⅵ),
accounting for more than 78% of the health risks of
chemical carcinogens. The health risk value of
chemical carcinogens in Longqu Reservoir is slightly
Water Quality Analysis and Health Risk Assessment of Reservoir in Qilian Mountain
305

higher than other monitoring points. The non-
carcinogen health risk of the five typical reservoirs is
between 1.874×10
-9
~2.389×10
-9
a
-1
, mainly caused by
ammonia nitrogen, fluoride, and mercury, It accounts
for 60.01%~79.10% of the non-carcinogenic risk
value.
(3) The total health risk values are little
difference, ranging from 9.136×10
-5
to 9.402×10
-5
a
-1
.
The health risk values are mainly caused by the health
risks of chemical carcinogens. From now on, we
should pay attention to the restoration of mines on the
basis of strict control of pollutant discharge standards
to ensure that the heavy metal content in water
remains low.
ACKNOWLEDGEMENTS
This work was financially supported by the National
Key R&D Program of China (Grant No.
2019YFC0507405) and Gansu Natural Science
Foundation(22JR5RA316) and the Key Research
Program of Gansu (Grant No. 20ZD7FA005) and
Lanzhou Jiaotong University Youth Fund (2018005).
REFERENCES
A, R. S., S. S. D. B, V. K. C, R. S. A, S. S. K. B & B. P. A
(2020) Impact assessment of metal contamination in
surface water of Sutlej River (India) on human health
risks. Environmental Pollution, 265: 114907.
B, D. X. A., B. G. A. B, W. P. A. B, L. G. B & Y. L. B (2019)
Geochemical and health risk assessments of antimony
(Sb) in sediments of the Three Gorges Reservoir in
China. Science of The Total Environment, 660, 1433-
1440.
Chai, N., X. Yi, J. Xiao, T. Liu, Y. Liu, L. Deng & Z. Jin
(2021) Spatiotemporal variations, sources, water
quality and health risk assessment of trace elements in
the Fen River. Science of The Total Environment, 757:
143882.
Chen, H. & K. Ju (2012) Surface water quantity and quality
assessment in Xi'an moat river, China. In International
Symposium on Geomatics for Integrated Water
Resources Management, 2012:1-5
China. Environment Protection Department(GB3838-
2002), 2002. The Surface Water Environment Quality
standard. China Environment Science Press, Beijing.
Emergency, E. P. A. O. o. & R. Response. (1989) Risk
Assessment Guidance for Superfund (RAGS) Part A.
Saúde Pública, 804, 636–640.
Gaofeng, Jiang, and, Lei, Xu, and, Shizhen, Song, and &
Changcai (2008) Effects of long-term low-dose
cadmium exposure on genomic DNA methylation in
human embryo lung fibroblast cells. Toxicology,
244(1): 49-55.
Giri, S. & A. K. Singh (2014) Risk assessment, statistical
source identification and seasonal fluctuation of
dissolved metals in the Subarnarekha River, India.
Journal of Hazardous Materials, 265, 305-314.
Giri, S. & A. K. Singh (2015) Human health risk assessment
via drinking water pathway due to metal
contamination in the groundwater of Subarnarekha
River Basin, India. Environmental Monitoring
&Assessment, 187(3): 1-14.
Li, R., Z. Zou & Y. An (2016a) Water quality assessment in
Qu River based on fuzzy water pollution index method.
Journal of Environmental Sciences, 50: 87-92.
Lim, S. S., T. Vos, A. D. Flaxman, et al. (2012) A
comparative risk assessment of burden of disease and
injury attributable to 67 risk factors and risk factor
clusters in 21 regions, 1990–2010: a systematic
analysis for the Global Burden of Disease Study 2010.
The Lancet, 380: 2224-2260.
Rahman, M. M., S. M. O. F. Babu, A. S. S. Ahmed & M. B.
Hossain (2020) Human Health Risk Assessment of
Heavy Metals in Water from the Subtropical River,
Gomti, Bangladesh. Environmental Nanotechnology
Monitoring & Management, 15: 100416.
Ranran, Zou, Zhihong & Yan (2016) Water quality
assessment in Qu River based on fuzzy water pollution
index method. Journal of environmental sciences, 50:
87-92.
Robu, B., O. Jitar, C. Teodosiu, S. A. Strungaru & G. Plavan
(2015) Environmental impact and risk assessment of
the main pollution sources from the Romanian black
sea coast. Environmental Engineering and
Management Journal, 14, 331-340.
Silva, D. P. d., D. P. D. S. Pitaluga, P. S. Scalize & H. O.
Santos (2019) Seasonal evaluation of surface water
quality at the Tamanduá stream watershed (Aparecida
de Goiânia, Goiás, Brazil) using the Water Quality
Index. Open Engineering, 9(1): 90-98.
Smith, A. H., C. Hopenhayn-Rich, M. N. Bates, H. M.
Goeden, I. Hertz-Picciotto, H. M. Duggan, R. Wood,
M. J. Kosnett & M. T. Smith (1992) Cancer risks from
arsenic in drinking water. Environmental Health
Perspectives, 97, 259-267.
Wang, T., J. Pan & X. Liu (2017) Characterization of heavy
metal contamination in the soil and sediment of the
Three Gorges Reservoir, China. J Environ Sci Health
A Tox Hazard Subst Environ Eng, 52, 201-209.
Wu, J., J. Bian, H. Wan, Y. Ma & X. Sun (2021) Health risk
assessment of groundwater nitrogen pollution in
Songnen Plain. Ecotoxicology and Environmental
Safety, 207, 111245.
Zhao, M. M., Y. P. Chen, L. G. Xue, T. T. Fan & B.
Emaneghemi (2018) Greater health risk in wet season
than in dry season in the Yellow River of the Lanzhou
region. Science of The Total Environment, 644, 873-
883.
Zhao, X., B. Gao, D. Xu, L. Gao & S. Yin (2020) Heavy
metal pollution in sediments of the largest reservoir
(Three Gorges Reservoir) in China: a review.
ISWEE 2022 - International Symposium on Water, Ecology and Environment
306

Environmental Science and Pollution Research, 24, 1-
15.
Zhao, X., L. Ting-Yong, T. T. Zhang, W. J. Luo & J. Y. Li
(2016) Distribution and health risk assessment of
dissolved heavy metals in the Three Gorges Reservoir,
China (section in the main urban area of Chongqing).
Environmental Science and Pollution Research, 24(3):
2697-2710.
Water Quality Analysis and Health Risk Assessment of Reservoir in Qilian Mountain
307
