
Research and Analysis on Stock Investment of Liaoning Chemical
Industry Based on Geometric Brownian Motion
Yanling Li
*
a
, Yuhan Song
b
, Yuting Ha
c
, Ruotong Sun
d
, Yuzhe Zhang
e
, Yue Chen
f
and Dandan Chen
g
Dalian University of Finance and Economics, China
Keywords: Geometric Brownian Motion Model, Simulation Analysis, Stock Investment.
Abstract: This paper examines the feasibility of using Geometric Brownian motion models to simulate prices and how
to use Geometric Brownian motion models to invest in stocks. Based on the historical closing prices of stocks
from September 1, 2019, to September 1, 2022, the Geometric Brownian motion model is built using Python,
based on Geometric Brownian motion 2023 prices from September 1 to October 1, future trends in Liaoning
chemical industry stocks were analyzed. To verify the accuracy of the model, we used historical prices from
January to February 2022 to simulate prices from February to March 2022 using a Geometric Brownian
motion model. Comparing the predicted value with the real value, the error rate is less than 20%, which
indicates that the model is feasible. The visualization results and data from the Geometric Brownian motion
simulation data show that under the assumptions of the Geometric Brownian motion model, the future
development of the Liaoning chemical industry’s stock is relatively stable, the share price of Fengguang
shares is on an upward trend, so investment may be considered.
1 INTRODUCTION
Chemical industry plays an important role in the
national economy of many countries and is the basic
industry and pillar industry of many countries. With
the rapid development of science and technology,
Liaoning 's chemical industry has made a qualitative
leap, which also makes today 's chemical enterprises
in full swing (Zhang, 1999). At the same time, some
enterprises also stand out. This paper selects several
enterprise stocks for analysis and prediction.
Some scholars predict the future development of
the real estate industry through the simulation of the
real estate stock price, which provides a certain
direction for our research (Liu, 2018).This paper
introduces the Geometric Brownian motion model
into the research and analysis of stock investment in
Liaoning chemical industry, and selects the stock data
of representative companies of Liaoning chemical
industry from 2019 to 2022 for simulation
analysis.The results show that the stock investment
a
https://orcid.org/0000-0002-7787-3104
b
https://orcid.org/0000-0002-1581-7756
c
https://orcid.org/0000-0002-5652-4685
d
https://orcid.org/0000-0002-6147-853X
behavior of the chemical enterprises in Liaoning
province conforms to the characteristics of the
geometric Brownian motion, and the proposed model
can be used to simulate the development direction of
the stock investment.
This paper provides data support for investors on
how to investment goals such as maximizing returns
under established risks or maximizing cumulative
returns. According to this data analysis, we can
effectively allocate existing funds, so as to avoid the
huge risks in the financial market, maximize the
benefits, and allow investors to have a clear vane
when buying stocks, so as to optimize investment and
make proper trade-offs.
e
https://orcid.org/0000-0001-5327-6025
f
https://orcid.org/0000-0003-4671-0780
g
https://orcid.org/0000-0002-0096-733X
522
Li, Y., Song, Y., Ha, Y., Sun, R., Zhang, Y., Chen, Y. and Chen, D.
Research and Analysis on Stock Investment of Liaoning Chemical Industry Based on Geometric Brownian Motion.
DOI: 10.5220/0012036000003620
In Proceedings of the 4th International Conference on Economic Management and Model Engineering (ICEMME 2022), pages 522-528
ISBN: 978-989-758-636-1
Copyright
c
2023 by SCITEPRESS – Science and Technology Publications, Lda. Under CC license (CC BY-NC-ND 4.0)

2 RESEARCH AND ANALYSIS OF
GEOMETRIC BROWNIAN
MOTION MODELS
In order to simulate the stock price and analyze the
future development trend of Liaoning chemical
industry stock, we chose the geometric Brownian
motion model for numerical simulation. We collected
the stock closing price data from 2019 to 2022, and
then we built a geometric Brownian motion model
using Python. A method to simulate the exponential
evolution of the stock market in 2020 with geometric
Brownian motion is proposed in the literature, where
the drift and diffusion are determined by taking into
account two economic connection states (economic
states), namely, the non-crisis state and the financial
crisis. Based on this result, we find that the GBM
model can very well describe the future evolution
process of the stock index, and it is a suitable model
for the prediction of the stock index value(Brătian,
2022). After evaluating the model, we simulated the
stock price using the historical data from 2019 to
2022.
2.1 Data Preparation
In order to analyze the stocks of Liaoning Chemical
Industry, we selected five representative stocks for
research. We refer to the literature and choose to use
Python to collect data through the tushare data
interface and then we process the data because the
closing price is the standard of the current market and
the basis of the next trading day's invoicing price (Si,
2020). The closing price can predict the future stock
market, so we choose the closing price of the stock as
the data of the model.
The ticker codes are as follows: '301100',
'300758', '300082', '000818', '000881'. We obtained
the data of five stocks from September 1, 2019 to
September 1, 2022. Finally, after importing the data
into an excel sheet, the original data collection is
complete.
2.2 Establishment of Geometric
Brownian Motion Model
2.2.1 The Introduction of GBM
GBM is a continuous-time stochastic process in
which the logarithm of a random variable follows
English surname’s Geometric Brownian motion. This
Geometric Brownian motion has applications in
financial mathematics. The purpose of our research is
to study the future trend of the stock investment of
Liaoning chemical industry. Considering the
simulation of the future stock price, we choose to use
Python to realize the future trend of the stock price
based on the Geometric Brownian motion model, and
through the final presentation of the results to the
stock investment.
2.2.2 The Equation of GBM
In Python, to simulate that the stock price obeys
geometric Brownian motion, it is necessary to use the
stock price expression that obeys geometric
Brownian motion after transformation by the Euler
discrete method, as follows:
S_t=S_(t-∆t) e^((μ-1/2 σ^2 )∆t+σε_t
√
∆t)
(1)
Where, “S_ T” and “S_ (t - ∆ t)” represents the
stock price at time “t” and time “t - ∆ t” respectively,
“μ” Is the expected value of stock return (annualized),
“σ” Is the stock return volatility (annualized), “∆t”
represents the unit time length, “ε_T” is a random
number with standard normal distribution at time “t”.
2.2.3 The Establishment of GBM
·Assumptions of the model
The assumption of the model is that in time t, the
change of stock price will not be affected by the joint
action of various external factors, such as economy
and policy. At the same time, the superposition of
various influencing factors on the stock price makes
the stock price a random variable and follows a
normal distribution.
·Establishment process of the model
Through the obtained data, first obtain the annual
average return and annual return volatility of each
stock, and then establish an initial array of stock
prices simulating geometric Brownian motion. Set the
simulation starting point as the stock closing price on
September 1, 2022, and generate 100 random
numbers at each time point. Use the difference
formula of geometric Brownian motion to simulate
and calculate the maximum, minimum and median of
the daily closing rate of the stock.
·Range selection of analog values
By reading the literature and looking for information,
we know that the accuracy of the Geometric
Brownian motion model is related to the length of the
set time (Agustini, 2018), and the shorter the time, the
more accurate the price prediction. It is also known
from the literature that the accuracy of the one-month
forecast is higher than that of the one-year and one-
week forecasts. We chose to forecast 2023 prices for
Research and Analysis on Stock Investment of Liaoning Chemical Industry Based on Geometric Brownian Motion
523

September to October in order to model future
movements.
2.2.4 Program Code
In the following section, we use the code for the
Geometric Brownian motion of scenic shares:
import pandas as pd
import numpy as np
import matplotlib.pyplot as plt
from pylab import mpl
mpl.rcParams['font.sans serif']=['SimHei']
mpl.rcParams['axes.unicode_minus']=False
#Import Fengguang share price data
price_fengguang=pd.read_excel('FENGGUANG
.xlsx',sheet_name="Sheet1",header=0,index_col=0)
#Calculate the daily rate of return of scenic shares
R_fengguang=np.log(price_fengguang/price_fen
gguang.shift(1))
#Deletes rows with missing values
R_fengguang=R_fengguang.dropna()
R_fengguang.describe()
#Get the annualized average yield of scenic shares
and convert it into an array format
mu_fengguang=(R_fengguang.describe()).loc['m
ean']*252
mu_fengguang=np.array(mu_fengguang)
#Get the annualized return volatility of the
landscape stock and convert it into an array format
sigma_fengguang=(R_fengguang.describe()).loc[
'std']*np.sqrt(252)
sigma_fengguang=np.array(sigma_fengguang)
#Import the statistics submodule stats for the
SciPy module
import scipy.stats as st
#predict 23-09-10
date_fengguang=pd.date_range(start='2023-09-
01',end='2023-10-01',freq='B')
N_fengguang=len(date_fengguang)
I_fengguang=100
dt=1.0/252
fengguang_GBM=np.zeros((N_fengguang,I_fen
gguang))
fengguang_GBM[0]=22.77
for t in range(1,N_fengguang):
e=st.norm.rvs(size=I_fengguang)
fengguang_GBM[t]=fengguang_GBM[t-
1]*np.exp((mu_fengguang-
0.5*sigma_fengguang**2)*dt+sigma_fengguang*e*
np.sqrt(dt))
fengguang_GBM=pd.DataFrame(fengguang_GB
M,index=date_fengguang) #Converts the simulated
value into a data box with a time index
plt.figure(figsize=(9,6))
plt.plot(fengguang_GBM)
plt.xlabel(u'date',fontsize=13)
plt.ylabel(u'price',fontsize=13,rotation=90)
plt.xticks(fontsize=13,rotation=30)
plt.yticks(fontsize=13)
plt.title(u'FengGuang:The GBM simulate the full
path (September to October 2023) ',fontsize=13)
plt.show()
#Simulation of the scenery of the stock maximum
max_fengguang=np.max(np.max(fengguang_GB
M))
#Simulation of the scenery of the stock minimum
min_fengguang=np.min(np.min(fengguang_GB
M))
#Simulation of the scenery of the stock
medianmum
median_fengguang=np.median(fengguang_GBM
)
print(' Maximum simulated
price:',round(max_fengguang,4))
print(' Minimum simulated price:',round
(min_fengguang,4))
print(' Median simulated
price:',round(median_fengguang,4))egin
Writeln('Hello World!!');
2.3 Results of Model Run
After the establishment of the model, we first need to
evaluate the model. Then analyze the operation effect
of the model and visualize the data, and finally
summarize according to the analysis results.
2.3.1 Model Evaluation
To evaluate the model, we used data from January to
February 2022 to predict stock prices from February
to March 2022. Because the model generates 100 sets
of data at random, we choose to extract one set of data
from the predicted values by random sampling.
Compare the real values from February to March
2022 and calculate the error rate between the
predicted values and the real values. The visible error
value from the data is less than 20%, so we consider
the model to be valid.
ICEMME 2022 - The International Conference on Economic Management and Model Engineering
524
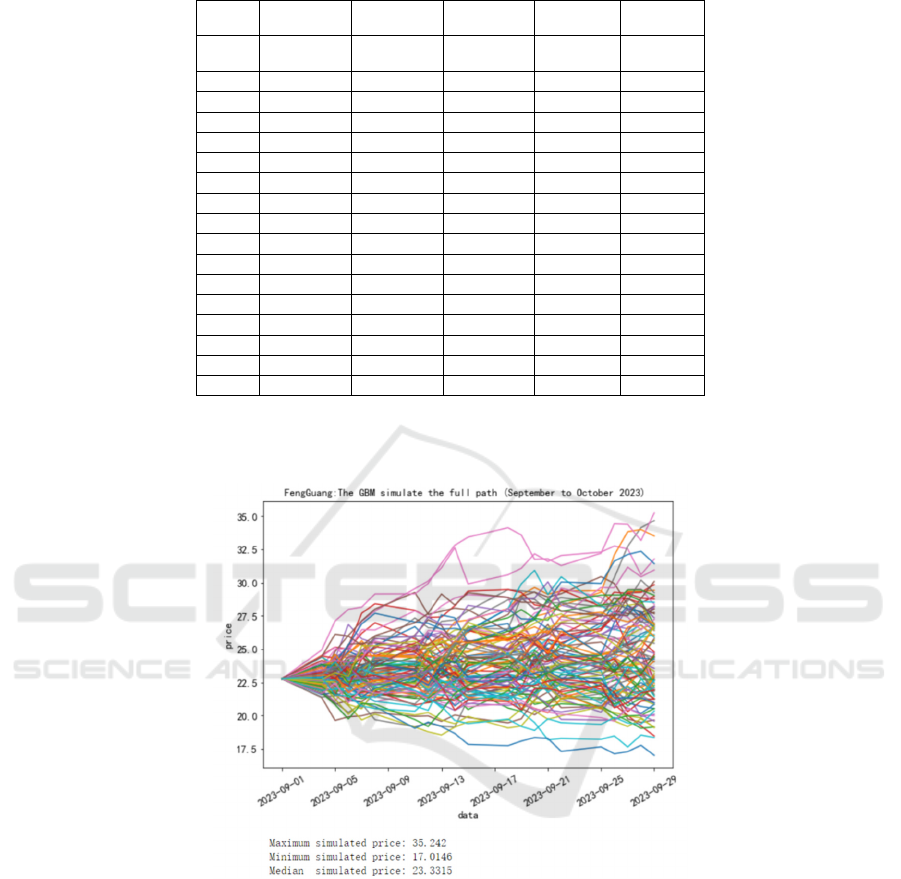
Table 1: Error rate between simulated value and real value of five stocks.
Date
300082 300758 000818 301100 000881
2/7
-2.5% -2.4% -1.5% -2.4% -1.9%
2/8
1.4% 0.4% -7.8% 2.8% -3.1%
2/9
1.9% -7.9% -7.7% 3.4% -4.4%
2/10
2.9% -1.7% -6.1% 0.2% 2.4%
2/11
5.8% -1.8% -2.8% 5.6% 5.7%
2/14
8.4% -0.1% -0.6% 3.4% 8.3%
2/15
1.2% 2.6% 1.3% 1.8% 7.1%
2/16
6.5% 5.7% -1.9% 5.9% 3.9%
2/17
4.6% 8.1% 0.1% 5.1% 3.0%
2/18
5.1% 7.8% 0.9% 7.6% 5.7%
2/21
9.9% 8.8% 4.3% 7.9% 7.4%
2/22
10.5% 17.3% 10.0% 6.0% 10.2%
2/23
7.3% 5.5% 10.4% 6.3% 12.6%
2/24
11.1% 5.4% 8.3% 6.2% 18.8%
2/25
12.8% 7.6% 7.9% 8.2% 14.3%
2/28
14.6% 8.9% 8.0% 10.5% 16.4%
3/1
18.6% 12.6% 9.9% 7.3% 13.8%
2.3.2 Liaoning Chemical Industry Stock 2023
Figure 1: FengGuang: The GBM simulate the full path (September to October 2023).
Fengguang shares (301100) is a global polymer
materials to provide core additives and high-tech
support suppliers. The company is mainly engaged in
the production and r & D of high-efficiency rubber
and plastic additives, and provides one-stop solution
of polymer additives for customers. Group is a state-
level high-tech Enterprises, with a special research
laboratory. Fengguang is a high-tech enterprise
specializing in the research, development, production
and sales of chemical additives for polymer materials.
It belongs to the chemical additives sub-industry in
the fine chemical industry, and in principle belongs to
the chemical materials cycle stock, the market share
of products is relatively high
From the simulation results of Fengguang shares,
we can see that the maximum value of Fengguang
shares is 35.242 yuan, and the minimum value is only
17.0146 yuan. The difference between the two is
nearly two times, the median price was 23.3315 yuan,
up from the initial 22.77 yuan (closing price on Sept.
1, 2022). As a result, when the shares follow the
Geometric Brownian motion, there is an overall
upward trend in the simulated share price.
Research and Analysis on Stock Investment of Liaoning Chemical Industry Based on Geometric Brownian Motion
525
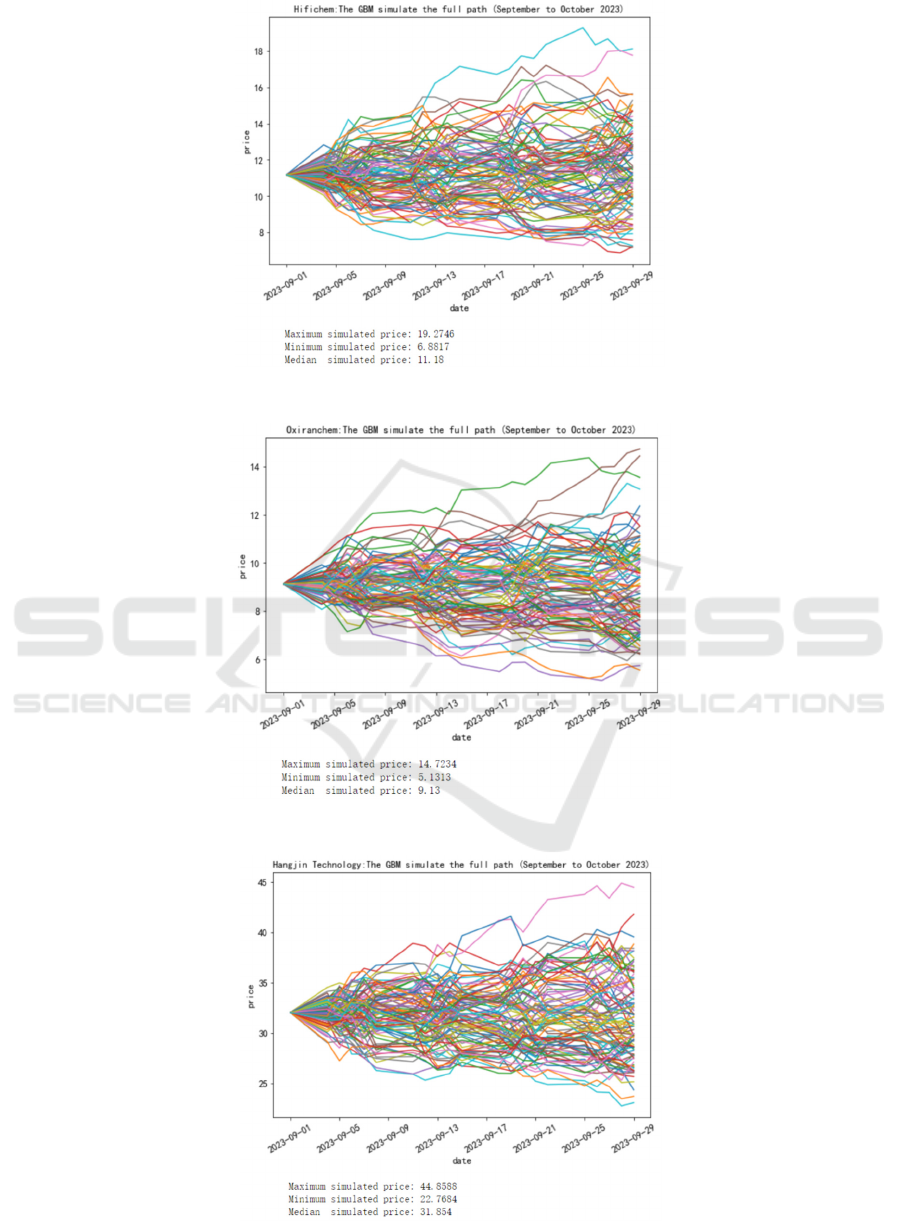
Figure 2: Hifichem: The GBM simulate the full path (September to October 2023).
Figure 3: Oxiranchem: The GBM simulate the full path (September to October 2023).
Figure 4: Hangjin Technology: The GBM simulate the full path (September to October 2023).
ICEMME 2022 - The International Conference on Economic Management and Model Engineering
526
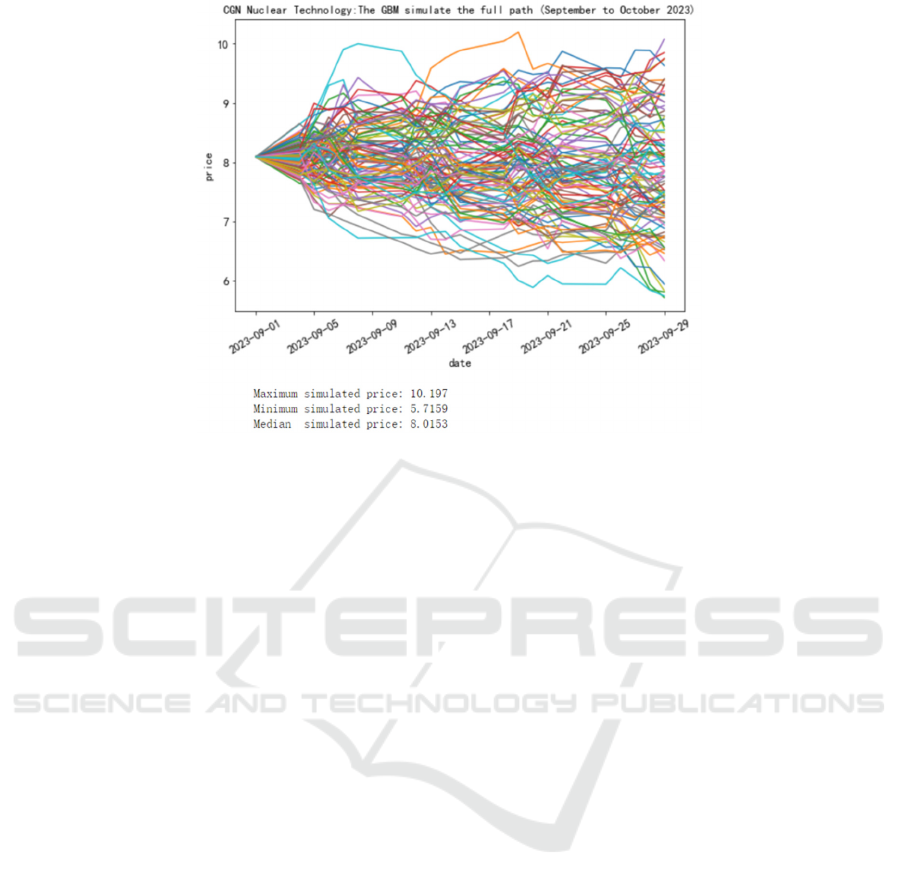
Figure 5: CGN Nuclear Technology: The GBM simulate the full path (September to October 2023).
Next to the other four companies of the simulation
chart analysis, can be seen in the simulation results of
Hangjin Science and technology, the median share
price is 32.03 yuan, equal to the initial 32.03 yuan
(September 1,2022 closing price), as a result, the
stock price of technology is unchanged. The median
price of Hifichem was 11.18 yuan, close to the initial
value of 11.18 yuan, which closed Sept. 1,2022. The
median price of Oxiranchem shares is 9.13 yuan,
close to the initial value of 9.13 yuan (the closing
price of 9.1 in 2022). The median share price of CGN
Nuclear Technology was 8.0153 yuan, close to the
initial value of 8.09 yuan (the closing price on
September 1, 2022).
From the forecast results, we can see that the
future development of Liaoning chemical industry
stock tends to be stable. The chemical industry has
been a big contributor to revenue and profits, take
Hangjin Technology for example. In the past, Aijin
Technology’s annual report was not very eye-
catching. However, in recent years, Aijin
Technology’s performance has continued to rise. On
the one hand, the price of chemical products is at a
high level, while on the other hand, military and civil
electronics have continued to contribute to the
performance, it can be said that the current aviation
brocade technology gradually entered a new round of
growth cycle. Therefore, in the analysis of stock
investment, but also with the development of the
industry to carry out a systematic analysis.
2.3.3 Research and Analysis on Stock
Investment of Chemical Industry in
Liaoning Province
In order to analyze the stock investment of Liaoning
chemical industry, we chose to use the same industry
analysis method in addition to the Geometric
Brownian motion model. We compare Liaoning
chemical industry’s stock with industry leader
Wanhua Chemical. We can see that the total market
value, net assets and net profit of Wanhua chemical
are much higher than those of Fengguang shares, but
the net interest rate of Fengguang shares is higher
than Wanhua Chemical. Therefore, we can introduce,
in the investment of stocks, to consider many aspects.
Although Fengguang shares listed for a short time,
but the overall company’s product gross profit and net
profit are relatively high, so there is a lot of room for
the development of Fengguang shares, the future
development prospects are also worth watching.
We used a Geometric Brownian motion model to
simulate the stock price. From the 2023 analysis of
the Liaoning chemical industry stock simulation data
visualization, we can see that the stock price of
Fengguang shares shows an upward trend, after
considering all the factors, we think we can give
priority to Fengguang shares when we invest in
Liaoning chemical industry
Research and Analysis on Stock Investment of Liaoning Chemical Industry Based on Geometric Brownian Motion
527

3 CONCLUSIONS
In the course of adopting Geometric Brownian
Motion to simulate stock prices, when Monte Carlo
method is used to simulate random numbers,if more
data samples are generated, the test effect will be
better. On the contrary, fewer simulation data samples
will result in poorer prediction effect.
The premise of adopting Geometric Brownian
Motion for modeling is that the stock prices conform
to normal distribution, but the real stock prices
usually do not conform to normal distribution. So
there exists certain deviation between the simulation
prediction results and the real prices.
Our conclusion is that Fengguang is preferred for
investment in the stock pool of Liaoning chemical
industry. If we use Brownian Motion to describe the
intraday high-frequency movement of stock price,
each sample trajectory has enough randomness. Stock
price is more likely to fluctuate around the opening
price, rather than stay above or below it; Moreover,
with the passage of trading time, the stock price at
time t will not deviate too far from the standard
deviation of the price movement (Nándori, 2022). In
this paper, we use the Geometric Brownian motion
model to simulate future trends and use the predicted
results as a reference for stock investing. The
limitation is that the Geometric Brownian motion
model results under certain assumptions, it is not a
complete reference, and that’s something we should
address in the future.
ACKNOWLEDGEMENTS
The writing idea and funding support of this paper
came from the Social Science Planning Fund of
Liaoning Province (Project No. L20BGL003).
REFERENCES
Agustini, W. F., Affianti, I. R., & Putri, E. R. (2018,
March). Stock price prediction using geometric
Brownian motion. In Journal of physics: conference
series (Vol. 974, No. 1, p. 012047). IOP Publishing.
Brătian Vasile, Acu AnaMaria, Mihaiu Diana Marieta , Ș
erban Radu Alexandru. (2022). Geometric Brownian
Motion (GBM) of Stock Indexes and Financial Market
Uncertainty in the Context of Non-Crisis and Financial
Crisis Scenarios.J.Mathematics.10(3).
Cardillo Giovanni, Bendinelli Ennio & Torluccio Giuseppe.
(2022). COVID-19, ESG investing, and the resilience
of more sustainable stocks: Evidence from European
firms. J. Business strategy and the environment.
Klibanov Michael V,Shananin Aleksander A,Golubnichiy
Kirill V, Kravchenko Sergey M(2022). Forecasting
stock options prices via the solution of an ill-posed
problem for the Black– Scholes equation.J. Inverse
Problems.38(11).
Liu Yang, Zhang Yue &Zhu Lifang. (2018). A Geometric
Brownian motion simulation of real estate prices.
J.Statistics and decision making.(09), 86-89.
Nándori Péter & Pirjol Dan.(2022). On the distribution of
the time-integral of the geometric Brownian motion.
J.Journal of Computational and Applied Mathematics.
Osei Antwi, Francis Tabi Oduro. (2018) Pricing Options on
Ghanaian Stocks Using Black-Scholes Model.J.
Science Journal of Applied Mathematics and
Statistics.6(1).
SiWen (2020). Hands-On Python for Finance.J.China Post
and Telecommunications Press(1).296-303.
Zhang Jiahe (1999). The great change of 50 years ---50
years since the founding of the People's Republic of
China and 20 years since the reform and opening-up
policy in Liaoning province. J.Liaoning chemical
industry(05), 247-252.
ICEMME 2022 - The International Conference on Economic Management and Model Engineering
528
