
Spatial-Temporal Evolutionary Characteristics and Factors of
Network Attention to Rural Tourism: A Study Based on Big Data
Yuting Li
a
and Xuefeng Wang
b
School of Economics and Management, Beijing Jiaotong University, Beijing, China
Keywords: Rural Tourism, Network Attention, Big Data, Baidu Index.
Abstract: The development of rural tourism is conducive to promoting the implementation of rural revitalization strat-
egy. Visitors frequently search for information about rural tourism on online platforms, generating network
attention. Based on Baidu index, using web data mining and mathematical statistics, this paper analyze the
spatial-temporal evolutionary characteristics and factors of network attention to rural tourism. The findings
are as follows: (1) from 2011 to 2020, network attention to rural tourism has the characteristics of first rising
and then falling, and is the highest in spring and autumn, and the lowest in winter. (2) network attention to
rural tourism has no obvious agglomeration characteristics among the 31 provinces in China, but the whole
shows the trend of decreasing from the east to the middle to the west. (3) network attention to rural tourism
is related to climate comfort degree, economic development level, network development, socio-demography
characteristic, hospitality service ability, tourism resources endowment and accessibility. The study aims to
provide a reference basis for the planning and development of rural tourism destinations.
1 INTRODUCTION
As a typical information-intensive industry, tourism
cannot be separated from the development of the In-
ternet, and search engines have become an important
tool for the majority of tourists to obtain information.
Tourists usually use the Internet to search for infor-
mation about tourist destinations before their trips to
assist in decision making, and the records and traces
left on the websites reflect the degree of their atten-
tion to tourist destinations, i.e., the network attention.
Based on the search volume of a large number of In-
ternet users, the web focus scientifically analyzes and
calculates the search browsing of Internet users in
search engines for a certain keyword, which not only
reflects the travel preferences of consumers, but also
provides a portrait of target people for each tourism
destination. It has been found that network attention
has a precursor effect (Li et al., 2008). Web big data
may help predict visitor traffic and ultimately visitor
spending, complementing traditional data (Artola,
2015). Other scholars have studied the spatial and
temporal evolution characteristics and influencing
a
https://orcid.org/0000-0001-8610-8503
b
https://orcid.org/0000-0002-2836-6958
factors of tourism safety and tourism public opinion
network attention, which provide references for tour-
ism safety management and tourism destination pub-
lic opinion monitoring and governance (Liu et al.,
2019; Zou et al., 2015). Tourism destinations can
forecast and manage traffic based on the temporal dis-
tribution of network attention, and implement precise
marketing based on the source of potential visitors for
planning and management.
In recent years, the Chinese government has vig-
orously implemented the rural vitalization strategy.
As an important means to achieve rural revitalization,
rural tourism is conducive to increasing farmers' in-
come, improving the economic structure of rural ar-
eas, and achieving green and sustainable development
in rural areas (Zhao, 2007). To some degree, network
attention to rural tourism reflects the development
scale and trend of rural tourism, which can provide
some realistic reference for the construction of tour-
ism destinations. How to promote the development of
rural tourism has become the focus of attention at pre-
sent. Most studies have focused on the development
mode (Zhang et al, 2012; Ma et al, 2007), develop-
ment and operation of rural tourism and its impact
Li, Y. and Wang, X.
Spatial-Temporal Evolutionary Characteristics and Factors of Network Attention to Rural Tourism: A Study Based on Big Data.
DOI: 10.5220/0012072500003624
In Proceedings of the 2nd International Conference on Public Management and Big Data Analysis (PMBDA 2022), pages 225-232
ISBN: 978-989-758-658-3
Copyright
c
2023 by SCITEPRESS – Science and Technology Publications, Lda. Under CC license (CC BY-NC-ND 4.0)
225

(Wang, 2009; Du & Su, 2011; Yang, 2017). Network
attention directly affects the development of rural
tourism, and the current research has yet to analyse
the characteristics of the spatial and temporal evolu-
tion of rural tourism network attention and the factors
influencing it at a national level. How to promote ru-
ral tourism through increasing network attention at a
macro level is crucial to the implementation of the ru-
ral revitalization strategy. Based on the massive and
immediate nature of big data, this paper takes the net-
work attention of rural tourism in 31 provinces and
cities as the research object, explore how rural tour-
ism network attention changes in time and space, and
what factors influence the spatial and temporal distri-
bution of rural tourism network attention. Based on
Baidu index, this paper uses research methods such as
big data mining, index analysis and correlation anal-
ysis. The paper conducts research from the perspec-
tive of public attention, with a view to providing a
reference basis for the development and marketing of
rural tourism products and services.
Firstly, this paper examines the temporal evolu-
tionary characteristics of network attention to rural
tourism and factors; secondly, examines the spatial
evolutionary characteristics of network attention to
rural tourism and factors; and finally, there are con-
clusions and discussion.
2 METHODS AND MATERIALS
2.1 Data Collection
Baidu Index is a data sharing platform launched by
Baidu, based on Baidu's massive amount of internet
users' behavioural data, and is also one of the statisti-
cal analysis platforms with the highest data usage rate
and the largest number of people using it. Based on
the search volume of Internet users in Baidu, Baidu
index uses keywords as the statistical object to scien-
tifically analyse and calculate the weighted sum of the
search frequency of each keyword in Baidu web
searches.
Network attention to rural tourism is based on the
Baidu index, which is the frequency weighted sum of
users' searches for rural tourism related keywords on
the Baidu search engine. Essentially, it is the use of
big data to obtain information on user behaviour,
which can provide a comprehensive and accurate por-
trayal of the demand characteristics of potential tour-
ists. This paper takes the network attention of rural
tourism in 31 provinces, municipalities and autono-
mous regions in China as the research object. Using
the Baidu index comparison function, the three high-
est search indices were selected, namely rural tour-
ism, agritainment and picking. The Baidu index
search platform was used to obtain the web attention
data of 31 provincial-level administrative regions in
China from January 1, 2011 to December 31, 2020 for
each of the three keywords, and the sum of the daily
average network attention of the three keywords was
used to represent the daily average network attention
to rural tourism, and the network attention to rural
tourism mentioned subsequently were the sum of the
three.
2.2 Methodology
This paper uses the seasonal concentration index,
Herfindahl-Hirschman index, Gini coefficient and ge-
ographical concentration index to analyse the spatial
and temporal evolution characteristics of network at-
tention, and uses SPSS to conduct Person correlation
analysis to explore its influencing factors.
(1) Seasonal concentration index
𝑆=
(𝑥
−8.33)
/12
(1)
Where 𝑥
denotes the proportion of network at-
tention to rural tourism in month 𝑖 to network atten-
tion to rural tourism for the year, 𝑖 =1, 2, … ,12. S is
the seasonal concentration index. The larger the S-
value, the more concentrated the temporal distribu-
tion of rural tourism web attention and the more pro-
nounced the off-peak season, and vice versa, the more
dispersed the distribution.
(2) Herfindahl-Hirschman index
𝐻=𝑥
(2)
Where 𝐻 is the Herfindahl-Hirschman index,
which fluctuates between 1/12 and 1. The closer 𝐻
is to 1, the greater the temporal variation in network
attention and the higher the concentration, and vice
versa.
(3) Geographical concentration index
𝐺=100×
(𝑝
/𝑝)
(3)
Where 𝑝
is the annual rural tourism network at-
tention for 𝑖. 𝐺 is the geographical concentration in-
dex. The closer it is to 100, the more concentrated the
spatial distribution of rural tourism network attention
is, and vice versa, the more dispersed the spatial dis-
tribution is.
PMBDA 2022 - International Conference on Public Management and Big Data Analysis
226
(4) Gini coefficient
Gini=1+1/n
-
2/n
2
p(p
1
+2p
2
+3p
3
+…+np
n
)
(4)
Where 𝑝̅ is the average network attention of ru-
ral tourism. p
1
,p
2
,…,p
n
is the ranking of the net-
work attention of rural tourism in 31 provinces and
cities in descending order. Gini is the Gini coeffi-
cient, which fluctuates between 0 and 1. The closer
Gini is to 1, the more disparate the spatial distribu-
tion of rural tourism is, and vice versa, the more even
it is.
3 RESULTS
3.1 Temporal Evolutionary
Characteristics and Factors
3.1.1 Temporal Evolutionary Characteristics
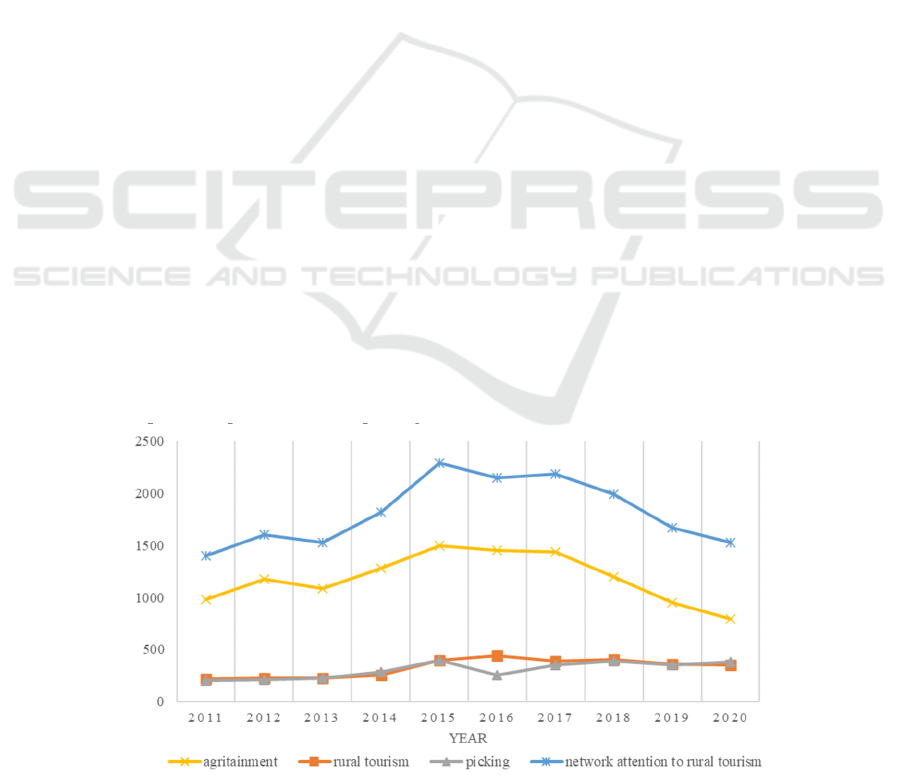
From the network attention of rural tourism in each
year from 2011 to 2020 (Figure 1), the network atten-
tion tends to rise and then fall, with overall rising.
Among them, agritainment rose and then fell, with
the overall trend declining; rural tourism rose and
then fell, with the overall trend rising; picking showed
an M, with the overall trend up. It can be seen that
during the decade, the popularity of Agritainment is
decreasing, but still at a high level overall, while the
popularity of rural tourism and picking is increasing,
with rural tourism increasing the most, which is con-
sistent with the stage of development of rural tourism
in China. As the primary form of rural tourism devel-
opment since the 1980s, China's agritainment has be-
come more mature and cannot meet the deeper needs
of the majority of tourists. Tourists tend to prefer
sightseeing and experiential products such as picking.
In addition, as the three issues of agriculture, the
countryside and farmers become more prominent in
the new era, China is paying more and more attention
to the development of the countryside, increasing the
development of rural tourism, and rural tourism has
become a hot topic.
In terms of months, the highest value of network
attention to rural tourism over the decade occurred in
August 2015 (Figure 2), probably due to the State
Council's issuance of Several Opinions on Promoting
Tourism Reform and Development in 2014, which
clearly proposed vigorous development of rural tour-
ism, reflecting the guiding role of policy on tourism
development. The lowest network attention occurred
in January 2020, probably due to two reasons: the
cold climate and the outbreak of the new crown epi-
demic. Throughout the year, the annual network at-
tention curve to rural tourism is relatively flat, indi-
cating that its network attention is spread out over
time, with no obvious off-peak season. The reason for
this may be that most visitors choose local and neigh-
bouring rural destinations and spend less time there,
so rural tourism does not have strong seasonal char-
acteristics. In order to observe the month-to-month
trend of network attention to rural tourism more intu-
itively, the proportion of network attention in each
month from 2011 to 2020 was calculated (Figure 3).
During the ten-year period, the network attention to
rural tourism showed a gentle bimodal pattern, with
attention mainly concentrated in April-June and Sep-
tember-October, i.e., the spring and autumn seasons,
with the highest peaks occurring in May and October,
and people having more leisure time during May Day
and November, which should be related to the holiday
system. The December-February period saw a low
level of interest in, probably due to low temperatures.
Figure 1: Network attention to rural tourism by year.
Spatial-Temporal Evolutionary Characteristics and Factors of Network Attention to Rural Tourism: A Study Based on Big Data
227
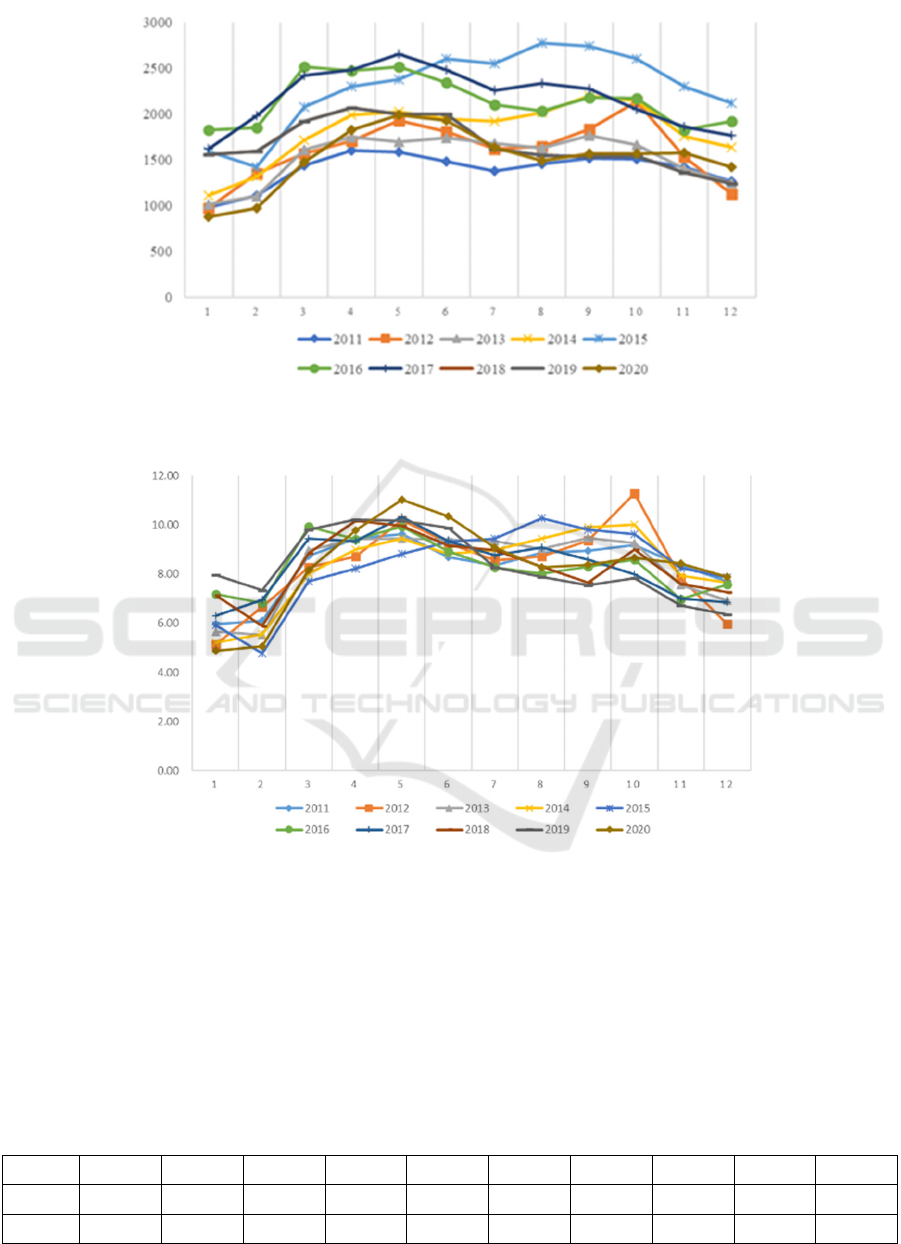
Figure 2: Network attention by month.
Figure 3: Share of network attention by month.
The seasonal concentration index and Herfindahl-
Hirschman index were calculated separately for each
year of rural tourism web attention (Table 1). As can
be seen, the seasonal concentration index fluctuates
between 1.034 and 1.751 with a small fluctuation, in-
dicating that the temporal variation in rural tourism
web attention is moderate for each month of the year,
while maintaining similar seasonal differences from
year to year. The largest seasonal concentration index
is in 2020, probably due to the outbreak of the New
Crown epidemic in the first half of 2020, when tour-
ism was almost at a standstill, and the gradual recov-
ery of tourism in the second half of the post-epidemic
period. Similarly, the Herfindahl-Hirschman index
fluctuates between 0.085 and 0.087, suggesting that
rural tourism network attention does not vary signifi-
cantly between decades and is more evenly distrib-
uted.
Table 1: Seasonal characteristics of Network attention to rural tourism.
Year 2011 2012 2013 2014 2015 2016 2017 2018 2019 2020
S 1.140 1.662 1.448 1.504 1.561 1.034 1.228 1.198 1.296 1.751
H 0.085 0.087 0.086 0.086 0.086 0.085 0.085 0.085 0.085 0.087
PMBDA 2022 - International Conference on Public Management and Big Data Analysis
228

3.1.2 Temporal Evolutionary Factors
There are seasonal differences in rural tourism net-
work attention, with a higher concentration of atten-
tion in April-June and September-October, with the
highest peaks in May and October, and a preliminary
judgement that the differences may be related to the
holiday system and climate comfort.
Leisure time affects the decision making of tour-
ists' travel. In order to scientifically and accurately an-
alyse the influence of the holiday system on network
attention, this paper refers to the research method of
setting up a virtual index by Ma et al (2011), consid-
ering the precursor effect of tourism network attention
and the length of each holiday (Li et al., 2008). The
virtual index is set to 0.75, 1 and 0.75 for the months
of March, April and May which are affected by the
Qingming Festival, Labour Day and Dragon Boat
Festival, 0.75 for the month of October where the Na-
tional Day is located, and 1 for the month of Septem-
ber which is affected by the National Day and Mid-
Autumn Festival. The virtual index for July and Au-
gust is set to 0.5 and 0.25 respectively, as the summer
holidays are not as widespread as the national holi-
days, so the virtual index for June is set to 0.75. The
collected data were collated and tallied (Table 2). The
results show that the holiday system did not pass the
significance test, indicating that the highest peaks in
May and October and the lowest peaks in December
and January may be due to other factors. For example,
although there are more holidays in February, the
countryside is less attractive and people are less will-
ing to travel as it is not the ripening season for fruits
and vegetables, and the temperature is lower.
Table 2: Impact of the holiday system.
Factors Person relevance Significance
Holiday system 0.275 0.386
Climate is often closely related to tourism activi-
ties and has a direct impact on the perceived experi-
ence of tourists. Climate comfort is an indicator that
evaluates human comfort in different climatic condi-
tions from a meteorological point of view. In this pa-
per, the temperature and humidity index is used as its
factor. Reference was made to the method of setting
up a virtual index by Ma (2011), assigning values to
each level of the temperature and humidity index.
This paper takes three representative provinces and
1
** indicates significant correlation at the 0.01 level (two-
sided); * indicates significant correlation at the 0.05 level
(two-sided).
cities in the north, middle and south of Beijing,
Jiangsu and Guangdong as examples, and selects the
cumulative monthly average temperature and
monthly average relative humidity data of each place,
calculates the temperature and humidity index, virtual
index and network attention, and uses SPSS software
to conduct correlation analysis on the virtual index
and network attention of each place (Table 3), the re-
sults show that climate comfort and rural tourism net-
work attention are very significantly The correlation
is that a comfortable climate is an important guarantee
for carrying out tourism activities, stimulating the de-
mand of tourists and increasing the popularity of the
destination.
Table 3: Impact of climate comfort
1
.
Region Person relevance Significance
Beijing 0.714
**
0.009
Jiangsu 0.672
*
0.017
Guangdong 0.606
*
0.037
3.2 Spatial Evolutionary
Characteristics and Factors
3.2.1 Spatial Evolutionary Characteristics
In terms of the difference between provinces, prov-
ince with the highest level of attention is Guangdong
(Figure 4). According to data released by the Baidu
Institute of Statistics and Traffic, among the prov-
inces, Guangdong has the largest number of Internet
users. Therefore, it may be related to the degree of In-
ternet development. Provinces ranked 2-3 were Bei-
jing and Zhejiang, all in the more economically de-
veloped eastern region, indicating that the market de-
mand for rural tourism in the eastern region is more
mature. All the three provinces with the least attention
are located in the western region of China, indicating
that the rural tourism market demand in the western
region needs to be cultivated. Considering the eco-
nomic differences between the eastern and western re-
gions, it is speculated that the network attention to ru-
ral tourism may be related to the level of economic
development.
The geographical concentration index and Gini
coefficient were calculated separately for each year
from 2011 to 2020 (Table 4). The geographical con-
centration index of rural tourism network attention for
each province fluctuated between 19.31 and 19.80
Spatial-Temporal Evolutionary Characteristics and Factors of Network Attention to Rural Tourism: A Study Based on Big Data
229

from 2011 to 2020, indicating that the inter-provincial
concentration of rural tourism network attention is
small and distributed. The Gini coefficient fluctuates
between 0.22-0.27 over the decade, with 0.2-0.29 in-
dicating a low index rating according to the UNDP
banding. It means that inter-provincial network atten-
tion is more evenly spread with insignificant differ-
ences. This means that public demand for rural tour-
ism, as represented by the degree of internet attention,
is dispersed, and that there is more market space for
rural tourism and high potential for development.
Figure 4: Total network attention by provincial districts.
Table 4: Inter-provincial differences in network attention to rural tourism.
2011 2012 2013 2014 2015 2016 2017 2018 2019 2020
G 19.67 19.66 19.80 19.86 19.61 19.49 19.43 19.35 19.45 19.31
Gini
0.25 0.25 0.26 0.27 0.25 0.24 0.23 0.23 0.24 0.22
3.2.2 Spatial Evolutionary Factors
According to the results of the above study, there are
certain inter-provincial differences and inter-regional
differences in rural tourism network attention. There
are two main sources of factors on the spatial evolu-
tion selected for this paper. Firstly, the above study
shows that there are regional differences in rural tour-
ism network attention, presumably related to the level
of regional economic development and the degree of
network development. Secondly, it has been found
that rural tourism network attention is related to tour-
ism resource endowment, hospitality service capacity,
and transportation convenience (Rong & Tao, 2020).
Another study chose the socio-demographic charac-
teristics factor to study its relevance (Zou et al., 2015).
Considering the above factors and the characteristics
of this study, five factors are analysed: level of eco-
nomic development, network development, socio-de-
mographic characteristics, hospitality service capac-
ity, tourism resource endowmen
t
and accessibility.
The data collected were collated for statistical pur-
poses (Table 5).
Table 5: Spatial evolutionary factors.
Factors Variable indicators Person relevance Significance
Level of economic
development
Regional GDP .867
**
.000
Disposable income per inhabitant .518
**
.003
Network development
Size of Internet users .729
**
.000
Internet
p
enetration rate .429
*
.016
Socio-demographic
characteristics
Age
0-14 years -.362
*
.045
15-64 years .006 .973
65+ years .589
**
.000
Education
level
Junior High School -.243 .188
High School .424
*
.017
Tertiary and above .098 .599
Hospitality
service capacity
Number of star-rated restaurants .736
**
.000
Number of homestays .754
**
.000
Tourism resource endowment National Rural Tourism Key Village .431
*
.015
Accessibility Road miles .394
*
.028
The level of regional economic development af-
fects people's willingness to travel. GDP and per cap-
ita disposable income of residents of each province in
2019 were selected as the indicators. It can be seen
that the two show a very significant correlation with
network attention, with disposable income per resi-
dent being the basis for people's consumption and a
prerequisite for undertaking rural tourism activities.
PMBDA 2022 - International Conference on Public Management and Big Data Analysis
230

Regional GDP has the strongest correlation of all in-
dicators, at 0.867, indicating that it has the greatest
influence on people's rural tourism decisions.
Internet development directly affects network at-
tention. Using the scale of Internet users and Internet
penetration rate in different regions as indicators, the
results show that they are significantly correlated with
network attention. At the same time, the more devel-
oped the regional network is, the faster and more ex-
tensive the information dissemination is, thus pro-
moting further increase in network attention.
Users with different attributes have different pref-
erences for tourism. For example, older people prefer
recreation tourism and younger parents prefer parent-
child tourism, and socio-demographic characteristics
may affect network attention to rural tourism. Using
age and education level as indicators, results show
that 0-14 years old age and network attention showed
a significant negative correlation. 0-14 years old pop-
ulation does not yet have economic ability and has
limited use of the Internet, so the more the proportion,
the lower the network attention. High school educa-
tion showed a significant correlation and age 65+
showed a highly significant correlation, suggesting
that age and literacy base also influence the magni-
tude of regional network attention to some extent.
The capacity of hospitality services is a guarantee
for the development of tourism destinations. The
number of star-rated restaurants and the number of
homestays are chosen as indicators, as people mostly
choose to travel freely, in addition, one of the main
features of rural tourism is to experience local food
and folklore. The results show that the two are very
significantly correlated with network attention, indi-
cating the importance of hospitality service capacity
in the development of rural tourism. As a representa-
tive of the quality of tourism facilities and service lev-
els, star-rated restaurants are important contact points
for tourists travelling and determine their experience.
At the same time, with the rapid development of the
experience economy and the upgrading of consumer
demand, especially in rural tourism, more and more
tourists are choosing local homestay.
Tourism resources are the core element of rural
tourism development, and are the premise and foun-
dation of rural tourism. The number of national rural
tourism key villages in each region is chosen as the
indicator, and the results show that it is significantly
correlated with network attention. The tourism re-
sources of a region will first radiate the surrounding
areas, forming a regional agglomeration effect, and
the number of tourism resources directly affects the
formation of rural tourism hotspots, thus affecting the
regional network attention.
Transportation directly affects the accessibility of
tourist destinations. Considering that tourists in rural
tourism mostly choose to drive themselves, road
miles was chosen as the indictor. The results show
that the road miles is significantly correlated with net-
work attention. To get rich, first build roads, roads
make tourist destinations more closely connected to
their sources, and are essential for the development of
rural tourism.
4 DISCUSSION
Based on the Baidu index, this paper analyses the spa-
tial and temporal evolutionary characteristics of net-
work attention to rural tourism and its factors. The
study combines rural tourism with online big data, en-
riching the research related to rural tourism. There are
also practical implications. The spatial-temporal evo-
lution of network attention shows that rural tourism
currently suffers from declining fervour, imperfect in-
frastructure construction and marketing and promo-
tion tools that need to be strengthened. Rural tourism
destinations should enrich rural tourism product sys-
tems, improve rural tourism infrastructure, develop
differentiated marketing strategies and strengthen
public relations management.
In addition, there are certain limitations. Firstly,
the measurement of network attention to rural tourism
is relatively single, considering only the Baidu index
and lacking comprehensive consideration of other
platforms. Secondly, the index system of factors
needs to be improved, for example, due to the lack of
data, it is difficult to quantify the government policy
orientation and other indicators. Rural tourism has
now entered a new period of development, and there
is still much room for research in the future.
REFERENCES
Artola, C., Pinto, F., & García, P. (2015). Can internet
searches forecast tourism in-flows? International Jour-
nal of Manpower, 36(1).
Li S., Xu Q., & Chen L. (2008). Cyberspace Attention of
Tourist Attractions Based on Baidu Index: Temporal
Distribution and Precursor Effect. Geography and Geo-
Information Science, 24(6), 102-107.
Liu, J., Chen, L., & Chen, Y. (2019). Spatial-temporal Evo-
lutionary Characteristics and Influencing Factors of
Network Attention to Tourism Public Opinion. Areal
research and Development, 38(1), 88-94.
Ma, L., Sun, G., Yang, R., & Long M. (2011). A Correlative
Analysis of the Spatial and Temporal Relationship Be-
tween Climate Comfort Degree and Tourist Network
Spatial-Temporal Evolutionary Characteristics and Factors of Network Attention to Rural Tourism: A Study Based on Big Data
231

Attention for Typical Cities. Progress in Geography,
30(6).
Ma, Y., Zhao, L., Song, H. et al. (2007). Study on the Chi-
nese Rural Tourism Development Pattern-A Case of
Chengdu. Economic Geography, 27(2), 336-339.
Rong, H., Tao, Z. (2020). Hotspot Identification and Cause
Analysis of Rural Tourism Based on Website Data:
Take Jiangsu Province as an Example. Journal of Natu-
ral Resources, 35(12).
Wang, L. (2009). On the Elite Governance of Cultural Her-
itage in Rural Tourism Communities-Discussion about
the Election in Pingan Stockaded Village, Guangxi
Province. Tourism Tribune, 24(5).
Yang, L. (2017). Poverty Alliviation by Rural Tourism in
Hainan. Chinese Journal of Agricultural Resources and
Regional Planning, 38(5).
Zhang, S., Song, L., & Wang, L. (2012). Research on De-
velopment Model of China’s Rural Tourism Based on
Tourism System Theory. Geography Research, 31(11),
2094-2103.
Zhao, C. (2007). Thoughts on developing rural tourism and
revitalizing the agricultural economy. Agricultural
Economy, 238(3), 28-29.
Zou, Y., Lin, W., & Zheng, X. (2015). Spatial-temporal
Characteristics and Factors of Network Attention to
Tourism Security. Tourism Tribune, 30(2), 101-109.
PMBDA 2022 - International Conference on Public Management and Big Data Analysis
232
