
Traffic Data Evaluation for Automated Driving Handover Scenarios
Eugenia Rykova
1,3,
*
, Juri Golanov
2
, Jonas Vogt
2
, Daniel Rau
2
and Horst Wieker
2
1
University of Applied Sciences TH Wildau, Wildau, Germany
2
ITS Research Group FGVT htw saar, Saarbrücken, Germany
3
University of Eastern Finland, Joensuu, Finland
Keywords: Connected and Automated Driving, Traffic Data Evaluation, Automated Driving Handover.
Abstract: At the current stage of automated vehicle development, the control handover from the system to a human
driver (and back) is inevitable. It is essential to distinguish between situations in which the handover is
possible and in which it could be dangerous and is therefore highly undesirable. We evaluated traffic situations
based on two modalities: own vehicle state and traffic objects. To assess the former, supervised machine
learning was applied, reaching an accuracy of 80.3% and specificity of 77.8% with Multilayer perceptron
Classification. Traffic objects data were subject to different clustering techniques. The final grouping was
done according to manually elaborated rules, resulting in a range of situation complexity scores. Improving
the discriminative power of vehicle state classification, including driver’s state and weather information, and
predicting situation complexity are to be addressed in future research.
1 INTRODUCTION
The future of mobility is automated. Researchers all
over the world are working towards fully automated
vehicles. Connected and cooperative automated
mobility (CCAM) is one important keystone to
accomplishing that goal. Vehicles by themselves can
only have a limited view as today the driver of a
vehicle. To enhance the safety and efficiency of road
traffic, cooperation and information exchange are
vital to see around the corner and to help traffic run
smoothly. The research goal of fully automated
condition-independent driving (SAE Level 5 (SAE
International, 2018)) is not yet on the horizon for
market introduction. Levels 3 and 4 serve as transition
steps from lower-level driver-support features. At the
current moment, Level 3 automated vehicles (AV)
just start being publicly available (Honda, 2020).
Level 3 implies occasional handover from
autonomous to human control, which is one of its
challenges. In this paper, we particularly focus on the
control handover from automated to manual driving.
There are many possible reasons for this handover.
Automated driving could only be allowed on some
roads or road classes, the driver could indicate the
willingness to drive because she wants the pleasure to
*
former member of FGVT htw saar
drive or feels more comfortable driving in a certain
situation. The handover, however, should not be a
surprise for the driver and therefore requires the
driver’s awareness and sufficient transition time
(Trimble et al., 2014). It can be planned, and the
transition can be done smoothly in situations, where
the traffic allows a switch of responsibility. There are,
however, more demanding and challenging
situations. What if an automated vehicle is not able to
steer through a certain situation because of technical
limitations or the fact that not enough sensor
information is available (e.g., due to weather
conditions or malfunction)? In some situations,
especially in urban environments, the handover is not
possible. For example, at a confusing construction
site or an intersection with many pedestrians, a human
driver needs time to adapt to the situation and gain an
overview.
In this paper, situations that could hinder a
handover process from the automated driving to the
driver are investigated. The focus is on determining
which situations in an urban environment are critical
and should not be used for handover scenarios.
The paper is structured as follows: first, the
related work is presented. Then, the methods of how
we handled the data are described in Section 3. In
Section 4, the results of the data modalities are
Rykova, E., Golanov, J., Vogt, J., Rau, D. and Wieker, H.
Traffic Data Evaluation for Automated Driving Handover Scenarios.
DOI: 10.5220/0011599900003479
In Proceedings of the 9th International Conference on Vehicle Technology and Intelligent Transport Systems (VEHITS 2023), pages 125-134
ISBN: 978-989-758-652-1; ISSN: 2184-495X
Copyright
c
2023 by SCITEPRESS – Science and Technology Publications, Lda. Under CC license (CC BY-NC-ND 4.0)
125

analyzed. The conclusion in Section 5 features the
significance of the results that were obtained and
highlights open research questions.
2 RELATED WORK
Most research related to the transition from
automated driving to manual driving is related to the
human factor of reaction to the takeover request
(TOR) (Eriksson and Stanton, 2017; Clark et al.,
2020). The awareness of the drive may be increased
by augmented reality (Schroeter and Steinberger,
2016). Some research sees the decision between the
two options: drivers are allowed to do other tasks or
drivers have to monitor the system at all times
(Borojeni et al., 2017). The traffic situation has an
important impact on the reaction time and the
probability of accidents (Radlmayr et al., 2014; Gold
et al., 2016).
To assess the possibility of a takeover, the time
necessary for the driver to react is the decisive factor
(Ayoub et al., 2022). Some research estimates the
readiness of the driver to take over the driving task
based on the complexity of the traffic situation, the
secondary task, and the gazes at the road (Braunagel
et al., 2017). For this estimation, only vehicle sensors
are used. To our knowledge, no research was
conducted using the combination of infrastructure
and vehicle sensor information to estimate factors for
takeover. More information can help to lower the
stress factor during and shortly after the handover
(Kerautret, 2023)
3 MATERIALS AND METHODS
3.1 Data Collection
Traffic situation information consisted of data
gathered from the following sources:
Own vehicle state, consisting of sensor data
from the vehicle Controller Area Network
(CAN) bus (ISO, 2015) system.
Information from message exchange between
other road users and infrastructure via Vehicle-
To-Everything (V2X) communication, such as:
o Detected road users in the immediate
vicinity by optical sensors (e.g., traffic
cameras) at intersections; distribution of this
information by Collective Perception
Messages (CPM) (ETSI, 2019a) of
Intelligent Transportation System (ITS)
Roadside Stations (IRS);
o Other V2X communication like warnings of
dangerous events via Cooperative
Awareness Messages (CAM) (ETSI, 2019c)
and Decentralized Environmental
Notification Messages (DENM) (ETSI,
2019d) from ITS Vehicle Stations (IVS’s)
and IRS’s (e.g., broken down vehicle
warning, pedestrian collision warning, etc.).
Topology information of intersections: MAP
(ETSI, 2019b) information at traffic
intersections.
Weather conditions: weather information
provider in the backend.
Since all the data were collected under similar
weather and lighting conditions (daylight, warm
temperature, zero precipitation), the weather data
were not included in the further analysis as a
discriminative factor.
To control the condition of the driver, driver-
monitoring functionality and corresponding
equipment must be included in an (automated)
vehicle. However, in the current research, data on the
driver’s condition are not available yet, so the
evaluation is based only on non-driver data.
Description of traffic situations included 1) data
recording, 2) aggregation and fusion of information
from several sources, and 3) storage in the database.
Data collection and pre-processing are described in
(Otte et al., 2021). Several test drives were performed
to generate the (training) data in the city of
Saarbrücken. It must be noted that our test vehicle
was not automated so the control handover was
explored hypothetically.
A traffic situation is a certain point in time
represented by the vehicle state and the detected
objects at the corresponding traffic intersection. A
test drive represents a chain of several successive
traffic situations. The time interval between two
situations is one second. Since situations are
snapshots, they were assessed individually, or
independently from the previous and following states.
During the execution of several test drives, a total of
7,854 traffic situations were recorded and stored in
the fusion database.
The goal of the evaluation is to determine the
degree of suitability of traffic situations for the
handover, in other words – the degree of situation
complexity. To keep the decision-making process
transparent and explainable, a cumulative multimodal
approach to situation evaluation was chosen. One
modality was sensor data of the test vehicle, and the
other modality was the information on detected traffic
VEHITS 2023 - 9th International Conference on Vehicle Technology and Intelligent Transport Systems
126

objects. The final decision depended on the outcomes
of each modality evaluation.
3.2 Vehicle Data Modality
Own state of the vehicle has a direct straightforward
influence on the control handover. “Handover
possible” and “handover not possible” are binary
labels that could be assigned to situations by human
raters and are further used for supervised machine
learning (classification algorithms and logistic
regression) (Awad & Khana, 2015).
An evaluation basis was required for labeling the
handover as possible or not possible. For this purpose,
videos were recorded from the interior of the test
vehicle during the test drives, capturing the driver's
point of view. The videos were time-stamped so that
they could be matched to the data in the fusion
database. With the help of the self-generated MAP
messages and the GNNS (global navigation satellite
system) position information from the test vehicle, it
was possible to perform lane matching with the
corresponding traffic light phases. This provided an
information gain to the overall traffic situation.
Recorded traffic situations were assessed
empirically according to the four-eyes principle.
First, transition points, where the handover status
changed from possible to not possible and vice versa,
were determined. All time points in between counted
as having the same handover status. The time interval
between two situations was set to one second to keep
a certain degree of differentiation of adjacent
situations as well as to avoid generating too much
data. “Handover possible“ (1) and “handover not
possible” (0) labels were stored in the situation
database, which was linked to the vehicle database
and traffic objects database through equivalent
situation identification numbers.
It was assumed that the movement state of the
vehicle was the most decisive for the evaluation,
whether it was moving, stationary, accelerating, or
braking. Based on the mentioned features, a decision
was made on whether the vehicle state was suitable
for the handover to the driver in the current situation
(see Table 1).
Table 1: Presumed handover decision matrix.
Handover
p
ossible Handover not
p
ossible
Vehicle is stationary
(
even at red traffic li
g
ht
)
Traffic light turns green,
vehicle starts movin
g
Vehicle moves at a
constant spee
d
Vehicle accelerates or
b
rakes
Vehicle is driving
strai
g
ht ahea
d
Vehicle is in a curve (or at
an intersection
)
This information was provided directly by the
vehicle sensors from the CAN bus interface. Vehicle
data dimensionality was reduced by filtering out the
features, whose values did not change during the test
drive. The remaining features are listed in Table 2.
Table 2: Vehicle data set.
Brake
actuation
Direction
of drivin
g
Current
g
ea
r
Clutch switch
actuation
Door
p
osition
Hazard
warning
Lateral
acceleration
Longitudinal
acceleration
Pedal
force
Speed Steering
wheel angle
Steering
wheel angle
velocit
y
Turn
signal
level
Wiper
front
s
y
stem
Yaw rate
The classification process consisted of applying
different classification algorithms to the vehicle data
set and comparing the accuracy score. To achieve a
better understanding of how the model would perform
in practice, 10-fold cross-validation (70/30 split) was
applied, after which the mean accuracy score of each
algorithm was calculated. All utilized algorithms and
methods came from the free software machine
learning library scikit-learn (Pedregosa et al., 2011).
For selected algorithms, an attempt to increase the
accuracy was made by applying “GridSearchCV”
(CV = Cross Validation), which performed an
exhaustive search on parameter values for the best
estimator. Optimized models were evaluated not only
based on the accuracy but on the specificity of the
model (True Negatives / (True Negatives + False
Positives)), which was considered a more important
metric for the investigated scenarios (False positives
would be more dangerous errors than False
Negatives).
3.3 Traffic Objects Modality
Situation complexity/criticality level was considered
depending on the level of danger of each traffic object
present in the current situation so that the primary
goal was to find a way of assessing the danger level
of individual traffic objects.
Traffic objects data consisted of entries for 18,030
objects of two types: 13,384 (passenger) cars and
4,646 pedestrians. These objects corresponded to
1,868 situations. The number of objects in a situation
ranged from 1 to 33, mean (M) = 9.7, and standard
deviation (SD) = 6.9. Each data entry contained the
following features:
situation id;
Traffic Data Evaluation for Automated Driving Handover Scenarios
127

object information: type of object; distance to
the test vehicle; speed; heading; longitude;
latitude; time to intersection (tti);
test vehicle information in the corresponding
situation: heading; longitude; latitude; time to
intersection (tti_v).
Time-to-intersection calculations are explained in
(Jiménez et al., 2013). When the intersection point did
not lie ahead on the course of the object/test vehicle,
the time-to-intersection was set to -1 (e.g., when the
object and the test vehicle moved parallel). Including
a negative value, however, disrupted the continuity of
the feature: -1 was not less than non-negative values.
Since maximum positive values of time-to-
intersection features were great enough (ttimax=
83,542.98 s; tti_vmax = 43,955.02 s) to be seen as
irrelevant at the current time point, all the -1 values
were converted into the maximum positive value of
the corresponding feature.
To make the data points more comparable and
easier to visualize, they were brought into the same
2D-coordinate system where the test vehicle would be
at the origin (0,0) moving towards the geographical
North (compass bearing = 0°, which corresponds to
π/2 (90°) in the polar coordinate system). With this
we consider the world view in this paper to be flat,
because here the curvature of the earth is negligible.
First, the differences between the longitude (long)
and latitude (lat) of the object and the longitude and
the latitude of the vehicle, respectively, were
calculated. Then these differences were expressed in
meters:
𝑥=
∙
°∙(
)∙
; (1)
𝑦 =
∙
°∙
; (2)
𝑤ℎ𝑒𝑟𝑒 𝑟𝑎𝑑𝑖𝑢𝑠
= 6371000.8 𝑚.
Relative X and Relative Y were calculated, using
trigonometric formulae for an axis rotation (Becker et
al., 1999, p. 48) for clockwise rotation through an
angle of the test vehicle’s heading. Longitude and
latitude were mapped onto the abscissa and the
ordinate, ignoring the z-axis because the objects were
relatively close to each other (the maximum distance
from the test vehicle was 100 m).
The next step was to calculate the relative bearing
of the objects (IVAO, 2020). For still objects, the true
bearing was calculated first, using the coordinates of
an object and the test vehicle (Ellis, 2020). Then, the
relative bearing was calculated by subtracting the
vehicle’s heading (true heading) from the object’s
true bearing. For moving objects, their heading was
used as the true bearing. The values were normalized
to the [0, 360°) range.
These and the following calculations were
performed in JupyterLab environment, using various
Python libraries (Pedregosa et al., 2011; Van Rossum,
2020; Harris et al., 2020; Virtanen et al., 2020; Gillies
et al., 2007), unless otherwise specified. Data
visualizations were carried out in matplotlib (Hunter,
2007). Illustrations of traffic objects in the coordinate
system were obtained with the help of
TeachingDemos package (Snow, 2020) in R (R Core
Team, 2020).
3.4 Clustering
Situation complexity is multifaceted. First, the
number of participants and their type varied. On the
other hand, each object was described with several
features. The situation’s complexity itself was
difficult to define in terms of the limited number of
labels. It seemed more reasonable to explore the data
and find the tendencies to group the objects, which
were addressed via unsupervised machine learning, or
clustering (Awad & Khana, 2015).
Several clustering options were explored to group
the objects. The evaluation of clusters was empirical.
Thus, a sample (<=80 samples) of observations from
each cluster was visualized and analyzed, whether
most of the objects in one cluster could be described
as having the same danger level. The algorithms were
first applied to the subset of data for pedestrians
because it was smaller and required less
computational space and time. When the approach
was not considered suitable for the data (i.e., the
results of clustering were not interpretable in terms of
intuitive understanding of the danger level), it was not
further applied to the subset of data for cars.
3.4.1 Position and Speed Features
Position features included relative X and Y
coordinates and relative bearing. To be treated as a
circular variable in centroid-based clustering, the
relative bearing was transformed into two features:
sine and cosine of the angular value. Since both sine
and cosine functions take values from -1 to 1, the
other features were scaled by their maximum absolute
value. An attempt to treat relative bearing linearly
proved to be inappropriate for circular variables.
Two centroid-based clustering algorithms were
applied to five features (scaled speed, scaled relative
X, scaled relative Y, sine of relative bearing, and
cosine of relative bearing), namely, Mean shift and K-
Means. For Mean shift clustering, bandwidth was
VEHITS 2023 - 9th International Conference on Vehicle Technology and Intelligent Transport Systems
128
estimated with a given quantile = 0.05. For K-Means
clustering, the Elbow Method was used to select the
optimal number of clusters.
Hierarchical agglomerative clustering was
performed in R (Murtagh & Legendre, 2014). For the
dissimilarity matrix with a circular variable, two
options were explored: one implemented in dist.ktab
function (Pavoine et al., 2009) of the ade4 package
(Dray & Dufour, 2007), and the other –
implementation of Gower’s dissimilarity (Maechler
et al., 2019) proposed by Will (2016). Will discusses
both methods applied to The Cape Blanco dataset,
which contains hourly measured temperature, wind
speed, and wind direction. The optimal number of
clusters (tree cuts in R terminology) was estimated
visually from the corresponding dendrograms.
3.4.2 Time-to-Intersection Features
Time-to-intersection (tti) features had exceptionally
wide ranges of values. For both subsets of data, the
median was equal to the maximum, which means that
the data was highly skewed. Classical feature-
clipping to a fixed maximum value did not solve this
problem. However, since situations were snapshots,
large time-to-intersection values seemed to be out of
interest then. Therefore, an intuitive border of 20 s
was established, so that all the samples of data with
tti > 20 s or tti_v > 20 s were excluded from further
analysis. The total number of objects with “suitable”
time-to-intersection features was 755: 139
pedestrians and 616 cars. Since reduced times to
intersection had the same range of values for both
pedestrians and cars subsets, the analysis was carried
out in three variations: for each of the subsets and the
whole dataset.
Mean shift and K-Means were also applied to
time-to-intersection features, both on reduced
pedestrians and cars subsets separately and all the
reduced data. For Mean shift clustering, the
bandwidths were estimated with quantiles 0.15, 0.1,
and 0.07 for the pedestrians’ subset, cars’ subset, and
all the data, respectively. For K-Means clustering, the
Elbow Method was used to select the optimal number
of clusters.
Hierarchical agglomerative clustering with
Ward’s linkage was performed. First, a dendrogram
of hierarchical clustering was plotted, from which the
optimal number of clusters was estimated. Then, the
clustering with the selected number of clusters was
performed using AgglomerativeClustering.
3.4.3 Manual Evaluation
Based on both the insights from machine learning
clustering and the empiric account of time-to-
intersection features, a manually elaborated scheme
for grouping the data points was proposed. Generally,
it was considered critical if the time-to-intersection of
the object and the test vehicle had similar values.
Besides, lower values of time-to-intersection features
were more dangerous than the higher ones. The
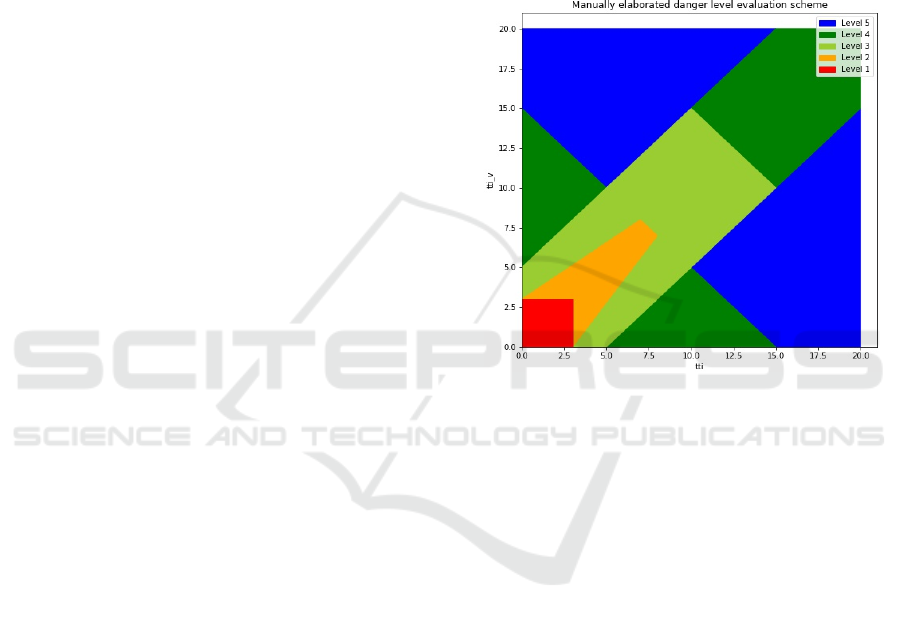
evaluation scheme is presented in Figure 1.
Figure 1: Manually elaborated scheme for grouping the data
points according to the values of time to intersection
features: Level 1 – the most critical (dangerous), Level 5 –
the least dangerous.
Since the objects were treated as points while they
had certain widths and lengths, and possible
imprecisions by data acquisition, it was decided to
add one more manually evaluated group of dangerous
objects. This group consisted of all objects located in
the 90° range zone in front of the test vehicle (45° to
the right and the left from the vehicle trajectory, or
octants 2 and 3 in the 2D coordinate system, in which
the test vehicle is at the origin and is moving towards
the geographical North) at the distance closer than
7.5 m.
3.4.4 Situation Evaluation
Eventually, the objects were divided into six groups
according to their danger level. Each object then
received a score from zero to five: zero – irrelevant in
the current situation, and five – representing a critical
level of danger in the current situation. To increase
the importance of critical objects, the situation score
was calculated as the sum of the squared scores of all
the objects.
Traffic Data Evaluation for Automated Driving Handover Scenarios
129
4 RESULTS
4.1 Vehicle Data Modality
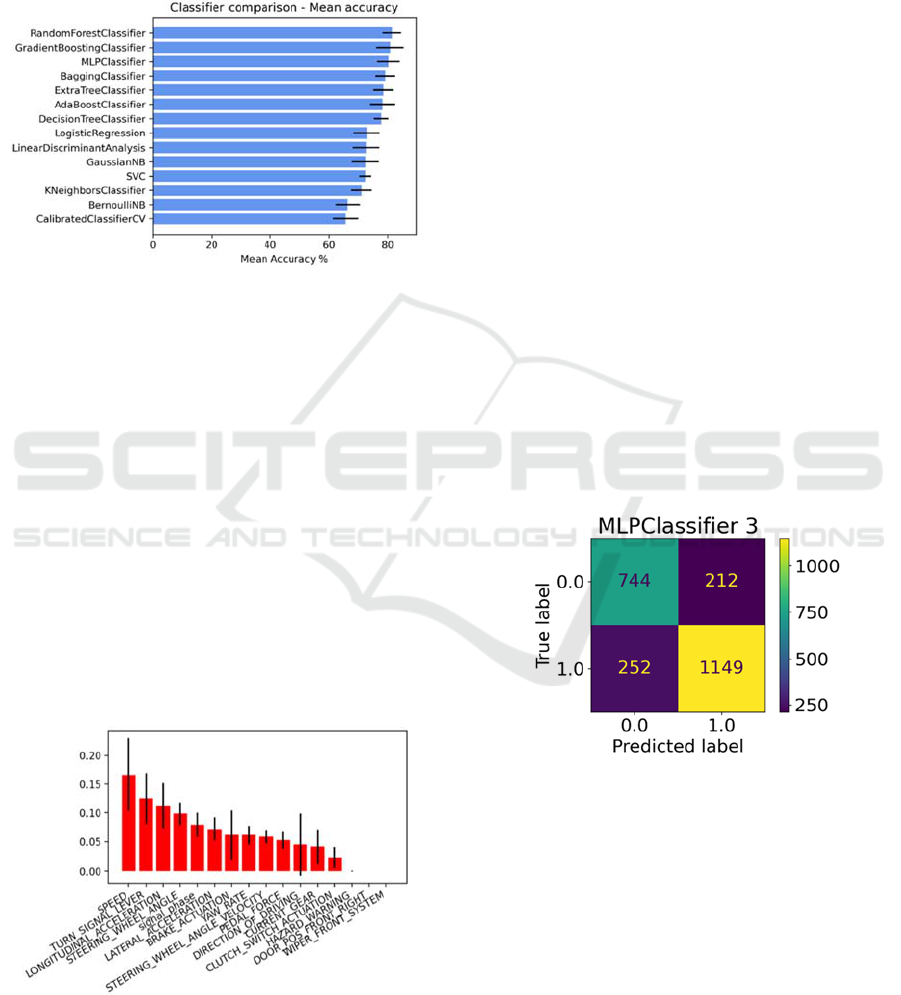
The results of classification with 10-fold cross-
validation are shown in Figure 2.
Figure 2: Classifier comparison - Mean accuracy.
4.1.1 Random Forest Classifier
Random Forest Classifier performed with the highest
accuracy. Implementation of GridSearchCV
algorithm achieved an accuracy score of 81.83%.
However, the specificity of this model (66.95%, True
Negatives = 640, False Positives = 316) was
considered unacceptably low to predict a safety-
critical handover.
Nevertheless, Random Forest Classifier provided
useful insights into the impurity-based feature
importance, or how much a single feature of the
vehicle data set affected the result (see Figure 3). The
presumed handover decision matrix (Table 1) could
be confirmed with the obtained feature ranking: the
values influencing the motion state of the vehicle
were the most decisive for the accuracy of prediction.
Figure 3: Feature importance revealed by Random Forest
Classifier.
From the bar chart in Figure 3, one can see that
the feature importance values varied strongly.
Furthermore, it is noticeable that the value
direction_of_driving had an unusually high variance
compared to the other features. Such variance
resulted from the fact that the direction_of_driving
feature in 1,609 cases was assigned as unknown,
which made those values incorrect. The position of
the three last-placed values can be explained by the
fact that during the test drives not enough data were
collected where these values were activated.
4.1.2 Multilayer Perceptron (MLP)
Classifier
Since the specificity of the Random Forest Classifier
was regarded as insufficient, it was necessary to
consider another classification algorithm. MLP
Classifier had a lower mean accuracy score than
Gradient Boost Classifier in the overall ranking, but a
lower standard deviation signaled higher robustness
of the former. After applying GridSearchCV method
for two different combinations of parameter grids and
increasing the accuracy by 0.25% compared to the
usage of the standard parameters, a final accuracy
value of 80.31% was achieved. The specificity of this
model reached 77.82% (see Figure 4), which was
14.64%, greater than that obtained with Random
Forest Classifier (see Figure 2).
Figure 4: MLP Classifier confusion matrix.
4.2 Traffic Objects Data Modality
4.2.1 Position and Speed Features
As mentioned above, the relative bearing is a circular
variable and should not be treated linearly. Such
attempts lead to losing the meaning of the values.
Objects from the same cluster corresponded to a wide
range of relative bearing values and could not be
meaningfully interpreted.
Sample visualizations of clusters obtained from
Mean shift (nine clusters), K-Means (five clusters),
VEHITS 2023 - 9th International Conference on Vehicle Technology and Intelligent Transport Systems
130

and hierarchical clustering with a circular variable (six
clusters with both methods) applied on speed and
position features suggested that the clusters could be
described as having similar relative bearing features
but not as having certain tendencies in terms of danger
level so that the approach was not applied further.
4.2.2 Time-to-Intersection Features
According to visual analysis of dendrograms, the
optimal number of clusters would be two. Such gross
division, however, did not seem reasonable,
considering the nature of the data. Thus, the number
of clusters was selected as where the dendrogram was
“cut” before going into finer clusters (the same
principle was applied to hierarchical clustering with a
circular variable).
Visualization of the clustering results can be seen
in Figure 5. Cluster evaluation from the empirical
point of view suggested that the proposed clusters
might lack the necessary granularity and symmetry.
Machine learning algorithms provided, however,
useful insights on how the data tended to be grouped
naturally.
Figure 5: Mean shift, K-Means, and hierarchical clustering applied on time to intersection features (data reduced to <= 20 s).
Figure 6: Examples of situations with different danger scores/complexity.
Traffic Data Evaluation for Automated Driving Handover Scenarios
131

4.2.3 Manual Evaluation and Final Situation
Evaluation
Objects in the dangerous proximity zone were
selected first. There were 319 such objects: 27
pedestrians and 292 cars. Of 755 that were to undergo
dangerous level analysis based on time to intersection
features, 62 were excluded because they were already
in the dangerous proximity zone (Danger Level 1). In
total, 1,012 objects were considered relevant in terms
of danger. These objects corresponded to 552
situations. The number of participants per situation
ranged from 1 to 10, M = 1.83, SD = 1.52. Excluding
situations with zero danger, situation scores ranged
from 1 to 143, M = 23.13, SD = 18.76. In 1,316
situations (70.4% of all the obtained data) there were
only objects with a danger Level of 0. Symbolic
representations of situations with different danger
scores/complexity can be seen in Figure 6.
5 CONCLUSIONS
We addressed the problem of a handover from
automated to human control through the multimodal
description and analysis of traffic situations. We have
focused on two modalities, namely own vehicle state
and detected traffic objects.
Own vehicle state can be directly mapped on one
of the two labels, “handover possible” or “handover
not possible”. These binary labels assigned by a
human rater have been used as ground truth for
training a range of classification models. The mean
accuracy of algorithms ranges from 65.7% to 81.4%,
the highest accuracy obtained with Random Forest
Classifier. Optimization of the algorithm allows to
improve the accuracy to 81.8%, However, False
negatives (algorithm attributes the handover as “not
possible” while in truth it is possible) do not seem to
have the same impact as False positives so the trade-
off should be made towards higher specificity. The
specificity of the Random Forest Classifier model is
67%, which is unacceptably low. With a slightly
lower overall accuracy of 80.3%, MLP Classifier
provides a significantly higher specificity of 77.8%,
which is nevertheless still unacceptable for robust
prediction of the handover. Balancing the dataset in
terms of outcome labels and feature weighting is seen
as the way to improve the performance of machine
learning models.
Traffic objects can be described in terms of their
danger level, which cumulatively corresponds to the
traffic situation complexity/danger score. Different
combinations of features have been explored with the
help of centroid-based and hierarchical clustering.
When features include a circular variable (relative
bearing), this feature seems to become dominant,
while the others are not interpreted by algorithms in a
way that could be explained in real life. Clustering on
time-to-intersection features with machine learning
algorithms does not result in desired granularity and
cluster symmetry, therefore a manual approach was
selected for grouping the data points. Almost 30% of
the investigated situations have been evaluated as
having a complexity/danger score higher than 0, with
maximum complexity of 143.
The possibility of the control handover is
determined via a cascade approach. First, own state
of the vehicle is assessed. In the current work, vehicle
data are available at any time, whereas the data of
detected objects (traffic situation data) are only
available at certain intersections. When the own state
of the vehicle allows the handover, the complexity of
the situation based on traffic objects is evaluated. The
higher the complexity, the more critical the
requirement of sufficient transition time, making an
immediate control handover not possible. Predicting
situation complexity in time, setting thresholds for
handover, and issuing corresponding warnings are the
topics for further research.
Limitations of the current study include the
absence of information on the driver’s state and
attention, and uniformity of weather conditions, as
well as the lack of perceptive capability of the
onboard vehicle sensors for obstacles on the road.
Adding these modalities and exploring the decision-
making with fusion at different levels (e.g., feature
fusion and modality fusion) are planned as the
following steps. Bringing data analysis into real-time,
while the vehicle is performing test routes, and
exploring delays in data processing and the ways of
minimizing them are also seen as one of the future
research directions.
ACKNOWLEDGMENTS
This work was funded by the German Federal
Ministry of Transport and Digital Infrastructure
within the project kantSaar (grant number
16AVF2129). The project consortium consists of the
University of Saarland and the University of Applied
Sciences Saarland – htw saar. The project approach
and the partial project outcomes result from the
collaborative work of the entire kantSaar project team
and other FGVT htw saar members.
VEHITS 2023 - 9th International Conference on Vehicle Technology and Intelligent Transport Systems
132

REFERENCES
Ayoub, J., Du, N., Yang, X. J. and Zhou F., Predicting
Driver Takeover Time in Conditionally Automated
Driving. (2022) in IEEE Transactions on Intelligent
Transportation Systems, vol. 23, no. 7, pp. 9580-9589,
DOI:10.1109/TITS.2022.3154329.
Awad, M., and Khana, R. (2015). Efficient learning
machines. Apress, Berkeley, CA, USA. DOI:
10.1007/978-1-4302-5990-9
Becker, F.-M., Boortz, G., Dietrich, V., Engelmann. L.,
Ernst, C., Fanghängel, G., … Höhne, H. (1999).
Formeln und Tabellen für die Sekundarstufen I und II
[Formulae and Tables for Secondary Education Levels
I and II]. Edition 7, paetec Gesellschaft für Bildung und
Technik mbH, Berlin.
Borojeni, S., Meschtscherjakov, A., Mirnig, A., Boll, S.
Naujoks, F., Politis, I., and Alverez, I. (2017). Control
Transition Workshop: Handover and Takeover
Procedures in Highly Automated Driving. In
Proceedings of the 9th International Conference on
Automotive User Interfaces and Interactive Vehicular
Applications Adjunct (AutomotiveUI '17). Association
for Computing Machinery, New York, NY, USA, 39–
46. DOI:10.1145/3131726.3131732
Braunagel, C., Rosenstiel, W., and Kasneci, E., Ready for
Take-Over? A New Driver Assistance System for an
Automated Classification of Driver Take-Over
Readiness. (2017). IEEE Intelligent Transportation
Systems Magazine, vol. 9, no. 4, pp. 10-22, DOI:
10.1109/MITS.2017.2743165.
Clark, J.R., Stanton, N.A. and Revell, K.M.A. Automated
Vehicle Handover Interface Design: Focus Groups
with Learner, Intermediate and Advanced Drivers.
Automot. Innov. 3, 14–29 (2020). DOI:10.
1007/s42154-019-00085-x
Dray, S., and Dufour, A.-B. (2007). The ade4 Package:
Implementing the Duality Diagram for Ecologists.
Journal of Statistical Software, 22(4), 1-20.
DOI:10.18637/jss.v022.i04
Ellis, D. (May 19, 2020). Calculating the bearing between
two geospatial coordinates. Available from https://
towardsdatascience.com/calculating-the-bearing-betwe
en-two-geospatial-coordinates-66203f57e4b4
Eriksson, A., and Stanton, N. A. (2017). Takeover Time in
Highly Automated Vehicles: Noncritical Transitions to
and From Manual Control. Human Factors, 59(4),
689–705. https://doi.org/10.1177/0018720816685832
ETSI – European Telecommunications Standards Institute.
(2019a). Intelligent Transport Systems (ITS); Vehicular
Communications; Basic Set of Applications; Analysis of
the Collective Perception Service (CPS) (ETSI TR 103
562). Release 2, Sophia Antipolis Cedex, France.
ETSI – European Telecommunications Standards Institute.
(2019b). Intelligent Transport Systems (ITS); Vehicular
Communications; Basic Set of Applications; Facilities
layer protocols and communication requirements for
infrastructure services (ETSI TS 103 301). Sophia
Antipolis Cedex, France.
ETSI – European Telecommunications Standards Institute.
(2019c). Intelligent Transport Systems (ITS); Vehicular
Communications; Basic Set of Applications; Part 2:
Specification of Cooperative Awareness Basic Service
(ETSI EN 302 637-2). Sophia Antipolis Cedex, France.
ETSI – European Telecommunications Standards Institute.
(2019d). Intelligent Transport Systems (ITS); Vehicular
Communications; Basic Set of Applications; Part 3:
Specification of Decentralized Environmental
Notification Basic Service (ETSI EN 302 637-3).
Sophia Antipolis Cedex, France.
Gillies, S., Bierbaum, A., Lautaportti, K., and
Tonnhofer, O. (2007). Shapely: manipulation and
analysis of geometric objects. Available from
https://github.com/Toblerity/Shapely
Gold, C., Körber, M., Lechner, D., and Bengler, K. (2016).
Taking Over Control From Highly Automated Vehicles
in Complex Traffic Situations: The Role of Traffic
Density. Human Factors, 58(4), 642–652.
DOI:10.1177/0018720816634226
Harris, C. R., Millman, K. J., van der Walt, S. J.,
Gommers, R., Virtanen, P., Cournapeau, D., …
Oliphant, T. E. (2020). Array programming with
NumPy. Nature 585, 357–362. DOI:10.1038/s41586-
020-2649-2
Honda. (2020, November 11). Honda Receives Type
Designation for Level 3 Automated Driving in Japan.
Available from https://global.honda/newsroom/
news/2020/4201111eng.html
Hunter, J. D. (2007). Matplotlib: A 2D Graphics
Environment. Computing in Science & Engineering, 9,
90-95. DOI:10.1109/MCSE.2007.55
ISO – International Organization for Standardization.
(2015). Road vehicles — Controller area network
(CAN) — Part 1: Data link layer and physical signaling
(ISO 11898-1:2015). Edition 2, Geneva, Switzerland.
IVAO – International Virtual Aviation Organisation.
(2020). Introduction to navigation. Available from
https://mediawiki.ivao.aero/index.php?title=Introducti
on_to_navigation
Jiménez, F., Naranjo, J. E., and García, F. (2013). An
Improved Method to Calculate the Time-to-Collision of
Two Vehicles. International Journal of Intelligent
Transportation Systems Research, 11(1), 34-42.
Kerautret, L., Dabic, S., and Navarro J., (2023).
Exploration of driver stress when resuming control
from highly automated driving in an emergency
situation, Transportation Research Part F: Traffic
Psychology and Behaviour, Volume 93, Pages 222-234,
ISSN 1369-8478, DOI:10.1016/j.trf.2023.01.016.
Maechler, M., Rousseeuw, P., Struyf, A., Hubert, M., and
Hornik, K. (2019). cluster: Cluster Analysis Basics and
Extensions. R package version 2.1.0.
Murtagh, F., & Legendre, P. (2014). Ward's hierarchical
agglomerative clustering method: which algorithms
implement Ward's criterion? Journal of Classification,
31, 274–295. DOI:10.1007/s00357-014-9161-z.
Otte, A., Staub, J., Vogt, J., and Wieker, H. (2021). Cloud-
based traffic data fusion for situation evaluation of
handover scenarios. ArXiv abs/2101.10912.
Traffic Data Evaluation for Automated Driving Handover Scenarios
133

Pavoine, S., Vallet, J., Dufour, A.-B., Gachet, S., and
Daniel, H. (2009). On the challenge of treating various
types of variables: Application for improving the
measurement of functional diversity. Oikos, 118, 391–
402. DOI: 10.1111/j.1600-0706.2008.16668.x
Pedregosa, F., Varoquaux, G., Gramfort, A., Michel, V.,
Thition, B., Grisel, O., … Duchesnay, E. (2011). Scikit-
learn: Machine Learning in Python. Journal of Machine
Learning Research, 12, 2825-2830.
R Core Team. (2020). R: A language and environment for
statistical computing. R Foundation for Statistical
Computing, Vienna, Austria. Available from
https://www.R-project.org/.
Radlmayr, J., Gold, C., Lorenz, L., Farid, M., and Bengler,
K. (2014). How Traffic Situations and Non-Driving
Related Tasks Affect the Take-Over Quality in Highly
Automated Driving. Proceedings of the Human Factors
and Ergonomics Society Annual Meeting, 58(1), 2063–
2067. DOI:10.1177/1541931214581434
SAE International. (2018). SAE J3016 Levels of Driving
Automation, Standard.
Schroeter, R., and Steinberger, F. (2016). Pokémon DRIVE:
towards increased situational awareness in semi-
automated driving. In Proceedings of the 28th
Australian Conference on Computer-Human
Interaction (OzCHI '16). Association for Computing
Machinery, New York, NY, USA, 25–29.
DOI:10.1145/3010915.3010973
Snow, G. (2020). TeachingDemos: Demonstrations for
Teaching and Learning. R package version 2.12.
Available from https://CRAN.R-project.org/pack
age=TeachingDemos
Trimble, T., Bishop, R., Morgan, J. F., and Blanco, M.
(2014). Human factors evaluation of level 2 and level 3
automated driving concepts: Past research, state of
automation technology, and emerging system concepts.
(Report No. DOT HS 812 043). Washington, DC:
National Highway Traffic Safety Administration.
Van Rossum, G. (2020). The Python Library Reference,
release 3.8.2. Python Software Foundation.
Virtanen, P., Gommers, R., Oliphant, T. E., Haberland, M.,
Reddy, T., Cournapeau, D., … SciPy 1.0 Contributors.
(2020). SciPy 1.0: Fundamental Algorithms for
Scientific Computing in Python. Nature Methods,
17(3), 261-272. DOI:10.1038/s41592-019-0686-2
Will, G. (2016). Visualizing and Clustering Data that
Includes Circular Variables. Master’s Thesis, Montana
State University, Bozeman, USA. Available from
https://math.montana.edu/grad_students/writing-
projects/2016/16will.pdf.
VEHITS 2023 - 9th International Conference on Vehicle Technology and Intelligent Transport Systems
134
