
Biometric Evaluation to Measure Brain Activity and Users
Experience Using Electroencephalogram (EEG) Device
Alaa Alkhafaji
1,4 a
, Sanaz Fallahkhair
2
and Ella Haig
3b
1
School of Engineering, Computing, and Mathematics, University of Plymouth, U.K.
2
School of Computing University of Brighton, U.K.
3
School of Computing, University of Portsmouth, U.K.
4
Department of Computer Science, College of Science, Mustansiriyah University, Iraq
Keywords: EEG, Biometric Data, HCI, User Experience, Field Study.
Abstract: This paper presents an empirical study in the field to obtain preliminary insights evaluating the mobile
application using an electroencephalogram (EEG) device (i.e. EMOTIV Insight headset). EMOTIV is a device
to be worn on the head that monitors brain activity to further analyse them into meaningful data that can
inform the results of measuring the users’ experience in terms of six cognitive metrics which are: stress,
engagement, interest, focus, excitement and relaxation. A mixed methods approach was used adopting
questionnaire, automated biometric data using EMOTIV and observations. The results suggest that the
biometric data obtained from this device are reliable to some extent, but it is important to be combined with
qualitative data using observational method in order to make sense of the results into different dimensions.
This would help researchers, who are seeking a way to measure internal user experience both subjectively
and objectively. Additionally, the results suggest that participants’ experience was positive when used a
mobile app to receive information regarding heritage places in the field. Moreover, several implications and
challenge are outlined.
1 INTRODUCTION
User experience is a very important element when it
comes to introducing a new technology to users
(Dibeklioğlu et al., 2021). It is essential to measure
their experience as accurately as possible for a better
insight regarding the investigated aspect (Hassenzahl
& Tractinsky, 2006). User experience would inform
developers about the quality of a new product and
whether it will be used or not (Paul & Komlodi, 2014).
Thus, researchers should make sure the results of
such studies are accurate enough to draw conclusions
that assist in taking any decision regarding the
product, whether positive or negative.
Measuring user experience traditionally is
done using self-reported techniques (Law et al., 2009;
Vermeeren et al., 2010), which could not be useful in
providing subjective measures (Galindo & García-
Canseco, 2015). Additionally, it might cause a lack of
accuracy of the results as people tend to forget
things after a short period of time. The slight
a
https://orcid.org/0000-0001-8625-886X
b
https://orcid.org/0000-0002-5617-1779
inaccuracy in research results could cause, to some
extent, unreliability of studies (Bai & Fuglerud,
2018). That could hinder the process of research and
trust in its results. In addition, traditional methods do
not measure aspects such as engagement, stress and
focus (McNamara & Kirakowski, 2006).
The recent emergence of electroencephalogram
(EEG) devices that monitor brain activity provides a
complimentary tool to support the traditional methods
that measure user experience. These could potentially
be more accurate and include aspects that are not well-
considered (e.g. engagement, interest and focus)
(Galindo & García-Canseco, 2015; Heunis, 2016). As
experience usually is in users’ mind (Attfield et al.,
2011), capturing these from users’ brain directly would
support researchers when conducting field studies for
this purpose. Additionally, in many cases we would
need to acquire objective measure to reduce
evaluator/researcher effect. Therefore, objective
measure for testing such as biometric methods (i.e.
EEG) could be used. The EEG devices enable us to
Alkhafaji, A., Fallahkhair, S. and Haig, E.
Biometric Evaluation to Measure Brain Activity and Users Experience Using Electroencephalogram (EEG) Device.
DOI: 10.5220/0011600100003417
In Proceedings of the 18th International Joint Conference on Computer Vision, Imaging and Computer Graphics Theory and Applications (VISIGRAPP 2023) - Volume 2: HUCAPP, pages
101-108
ISBN: 978-989-758-634-7; ISSN: 2184-4321
Copyright
c
2023 by SCITEPRESS – Science and Technology Publications, Lda. Under CC license (CC BY-NC-ND 4.0)
101

collect objective feedback about users and their
experience. However, as this is yet immature in the
literature, there is no clear insight to which extent these
electronic data are reliable. This paper presents an
empirical study to provide a preliminary insight of this
question while measuring user experience in the field
when using a mobile app for information acquisition
about a cultural heritage site. The next section gives a
brief overview of similar studies.
2 RELATED WORK
Few studies were conducted using automated
approaches to measure users’ experience. The eye-
tracking method is one approach that is used to
measure user experience by monitoring users’ gaze
while experiencing the use of a technological device
(Amadieu et al., 2015; Pel et al., 2010; Poole & Ball,
2006). However, this approach measures only the
aspect of where users look with the aim of identifying
what catches the participants’ eyes, but not
experiences such as “engagement”, “focus” and
“interest”. It was also utilized in robotics (Aguiar et
al., 2016; Chowdhury et al., 2014).
Another approach is capturing brain signals of
participants with the aim of measuring experience.
This approach is yet immature in the literature; very
few studies were conducted using such an approach
(Balart-Sánchez et al., 2019; Holman & Adebesin,
2019; Kotowski et al., 2018; Šumak et al., 2017;
Vokorokos et al., 2012; Zhang et al., 2019). However,
none of them measured the accuracy of the biometric
data as the same time when measuring users
experience at outdoors. In outdoor settings, the
EMOTIV Insight device is light to carry and, easy to
use and set up, which is always preferable features as
the device does not need a considerable amount of
time and effort to be carried, set and used.
Hence, we know very little about the accuracy of
this approach, which otherwise could bring great
benefits in the field of human-computer interaction to
automatically measure user experience. This paper
presents a field study that was conducted to measure
users’ experience automatically using an EEG
EMOTIV Insight headset device. and reports the
results. The next section provides an overview of the
adopted methods and techniques.
3 METHODOLOGY
A mixed methods approach was adopted using three
research techniques, which are: questionnaire,
automated biometric data using EMOTIV Insight and
the MyEmotiv app (see Fig. 1), and observations. The
study took place in the outdoor setting of the Royal
Pavilion in Brighton, UK. The convenience sampling
method was used to recruit participants. Visitors of
the site were targeted, which were randomly chosen
to be kindly asked if they are happy to take part.
Seven participants responded positively and accepted
to take part in this study. Participants were asked to
use a mobile app that provides historical information
regarding the site in multiple modalities (e.g. audio &
pictures to see attractions back in time) while wearing
the device. Participants were asked to perform two
tasks using related features of the app: (a) listen to an
audio explanation about the attraction; (b) seeing how
the attraction appeared in the past (more details
regarding the heritage app are given in Section 4).
3.1 Participants
Seven participants took part in this study; all of them
were visitors at the royal pavilion in Brighton. Their
age ranged between 30 to 50; three were females and
four were males. In terms of their background, one
was Australian, one was German, and the remainder
were British. In terms of their occupation, there were
three lecturers, one teacher, one project manager and
one officer. Consent for using their photos was
obtained.
3.2 Methods
MyEmotiv records brain’s waves captured by the
device in the real time to be analysed later. EMOTIV
is a wireless headset device that monitors brain
activity and translate them into meaningful data via
MyEmotiv – impaired data (see Fig.1). It has four
semi-dry polymer sensors that are placed right on the
skull to capture brain activity. Additionally, it has
nine axis sensors, which help detecting head
movements (Duvinage et al., 2013; Heunis, 2016).
MyEmotiv consists of six metrics; a brief definition
of each one is given below:
The impaired data obtained from MyEmotiv was
transferred to MS Excel to prepare them for the
analysis phase. A simple statistical analysis performed
to obtain the average and STD for each category
amongst participants.
A questionnaire technique was used to in this
study to compare its results with the biometric data.
The questionnaire was designed based on the
cognitive metrics of the MyEmotiv to compare
the results of both techniques, which are interest,
HUCAPP 2023 - 7th International Conference on Human Computer Interaction Theory and Applications
102

Table 1.
Interest
Measures how much you like or
dislike something
Excitement
Measures your level of mental
arousal
Relaxation
Is your ability to switch off
and reach a calm mental state
Engagement
Measures how immersed you are
in what you are doing or
experiencing
Stress
Measures how comfortable you
are with the current challenge you
are facing
Focus
Is your ability to concentrate on
one task and ignore distractions
A: Graph showing results of
all metrics
B: detecting “engagement”
with the definition
Figure 1: Examples of the results in MyEmotive.
excitement, relaxation, engagements, stress and
focus. The questionnaire consists four sections: (a) task
one: listening to the audio description; (b) task two:
seeing the attraction how looked in the past; (c)
demographic information; (d) Authorization. in
sections a & b participants are required to rate their
experience from 1 to 10, where 1 is the least and 10 is
maximum, when used the SmartC app based on the
six cognitive metrics, so each metric is rated from 1 to
10. Participants were also, given an opportunity to add
any comment regarding their experience. The results
obtained from the questionnaire was transferred MS
Excel preparing for the analysis phase.
4 STUDY SETTING
This study used a combination of three research
techniques as mentioned earlier to obtain rich data. It
used the EMOTIV device that monitors brain activity
and then translate it into meaningful data - impaired
data, which measures cognitive aspects of focus,
engagement, relaxation, stress, interest and
e x c i t e m e n t . E M O T I V i s a w e a r a b l e d e v i c e t o b e w o r n
on the head (a brain-worm device), which has five
channel EEG that help capture the brain’s signals
(EMOTIV INSIGHT, 2022) (see Figs 2 & 3). T h e
MyEmotiv a p p was used to obtain the data from
EMOTIV by simply pairing it to the device via
Bluetooth.
Participants were given a leaflet talking about the
purpose of the study and explaining how the device
works. Participants were required to wear the device
while at the same time perform two tasks using the
SmartC app, which is a mobile app for cultural
heritage sites that has features enable users to explore
heritage places in the context (Alkhafaji et al., 2019).
The features include: listening to audio explanations
a n d s e e i n g h o w a t t r a c t i o n s l o o k e d i n t h e p a s t , s e e - i t -
in-the-past, using augmented reality. This feature
simply works when visitors place a mobile device in
front of the related attraction, then an old image of the
attraction attached to a live camera view appears to
show how the attraction appeared in the past
(Alkhafaji et al., 2020).
The tasks that participants were requested to do
include: (a) listening to an audio explanation
regarding the related attraction; (b) seeing the
attraction how looked in the past. The researchers
helped participants to wear the device and set it up
to start the monitoring process. Participants filled out
a questionnaire directly after each task to rate their
experience. The questionnaire contained three
sections: (a) the demographic section; (b) task one,
which was about listening to the audio explanation;
and (c) task two, which was seeing how an attraction
looked in the past.
The questions were designed based on the six
metrics in MyEmotiv and the reason is to compare the
results of the MyEmotiv app that the device captured
automatically with the results that the participants
reported themselves. Participants were asked to rate
their experience when using the SmartC app in the
outdoor setting of the Royal pavilion from 1 to 10,
where 1 is the minimum and 10 is the maximum; these
were converted to percentages to be easily compared.
Biometric Evaluation to Measure Brain Activity and Users Experience Using Electroencephalogram (EEG) Device
103
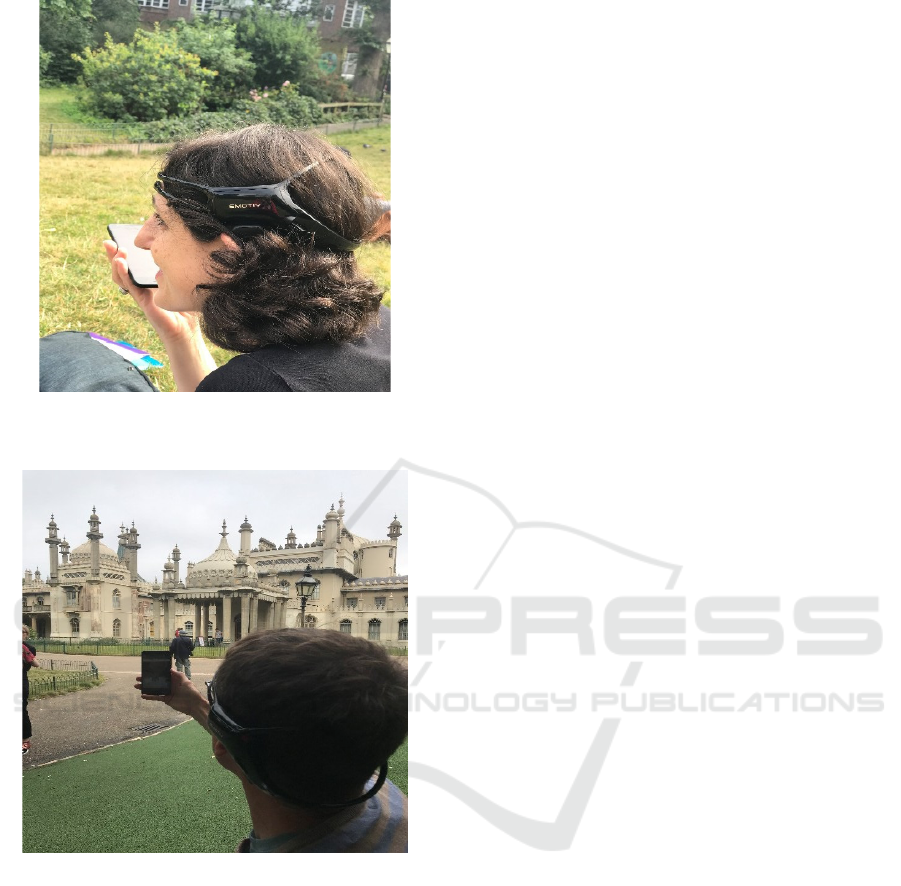
Figure 2: A participant trying EMOTIV while doing the
first task.
Figure 3: A participant trying EMOTIV while doing the
second task.
The observational study was carried out during the
experience sessions; researchers took notes while
participants were performing the tasks (i.e. listen to
an audio and look at a picture of the attraction
displaying how it looked in the past). EMOTIV
worked properly with almost all participants, but
failed to connect properly with two of them, which
led the data were not recorded. One participant
performed the first task only as she had something to
do and the session took quite some time to perform.
More details regarding challenging and implication
are given in Section 7.
5 RESULTS
The results of the study are presented in this section.
For task 1, as shown in the Fig. 4, the results
obtained from the MyEmotiv app show participants
were interested and engaged in listening to the audio
explanation as the average respectively were 64% and
57%. These results were the highest amongst the
metrics of the app, where focus was the lowest as
it was 36%, which indicates participants were not
completely focused. The possible explanation of this
results could be the nature of the outdoor settings as it
was busy and noisy, which could affect participants’
focus. On the other hand, the stress was 42% and
relaxation was 49%, which indicate they had a slight
stress. That could be explained as they were not quite
relaxed when using a new device.
Participants also performed the second task, which
was seeing an old image of the attraction that showed
how the pavilion looked in the past. The results of
this task were less positive than the previous task
as it was slightly challenging to see the old image (see
Fig. 5). Participants needed to spend extra time trying
to get the image to appear, and more challenging to
keep it for enough time to be seen properly. That was
due the nature of this feature as it was based on
location, which sometimes caused the image to
disappear when making a slight move on location. In
addition to the EMOTIV device experience,
participants were asked to fill out a questionnaire to
report their experience themselves in terms of the
same aspects as the MyEmotiv app, on scale from 1
to 10. The data were converted to percentages to be
easily compared to the brain activity results.
The results of the questionnaire suggest that
participants were interested (81%) and engaged (79%)
with the experience; they were focused (77%), but
less excited (50%). Additionally, whilst the results
indicate participants were not highly relaxed (59%),
they were not stressed (27%) (see Fig. 4).
The figure of the results of the second task looks
different from the first one as shown in Fig. 5 and that
could be because the old image was not easy to obtain,
which caused a slight frustration amongst participants.
The results were: focus 70%, interest 63%,
engagement 43%, excitement 38%, stress 43% and
relaxation 42%; a further discussion is presented later
in this section. As shown, the average of the
“engagement” and “excitement” metrics are not
encouraging, which could give impression that
participants were not engaged. The possible
explanation is the nature of the feature as explained
earlier, it required the device to be against the
attraction and in a specific position for the old image
HUCAPP 2023 - 7th International Conference on Human Computer Interaction Theory and Applications
104

to appear, which was slightly hard to find, “really
struggled to find position of phone where past photo
showed” . S a m e i s t r u e r e g a r d i n g t h e a v e r a g e o f t h e
“stress” category as one participant added against to
her rate, “was holding breadth to try to find the
correct position”.
Participants also were given a choice to add
comments if they would like to. Four of them chose
to add comments as given below:
“I like the feature of how looked in the past but
with more features such as video and 3D images”
“excellent ideas. Great to see technology
supporting heritage”
“I’ve lived in Brighton for 17 years and only visit
the Pavilion once, because it's quite expensive, so,
this could be a great alternative for a lower cost
experience, but still […] for the pavilion.”
“I would like to see the image for longer.”
Based on these comments, it is clear that participants
enjoyed the experience, but wished the image to stay
for longer to be better seen. The results are
compared in the next sub-section.
From looking to the above figures, it is clear that
the results of the questionnaire are more positive
than the results of the app. However, the trend is
similar in most metrics, with the exception of
“focus”, where the data shows big difference. This
could mean participants thought they were focused,
while they were trying to focus but the noise around
them prevented them from being focused without
realising. Our justification for this explanation is
that this device is supposed to work in any
circumstances (e.g. noisy or quite) based on the
official website (Šumak et al., 2017), so we assume
that its results are more accurate in this context.
Additionally, this would also explain the “stress”
results as the app reported “stress” is 42%, which
could mean they were get slightly stressed as they
were trying to focus in busy and noise circumstances
Figure 4: The results of task 1.
Figure 5: The results of task 2.
Biometric Evaluation to Measure Brain Activity and Users Experience Using Electroencephalogram (EEG) Device
105

that is not very easy. Comments by a participant
supports this explanation as she added against to her
rate of the metrics for the first task, “focus” and
“stress” to explain them, “noisy garden”, “trying to
hear”.
Figure 5 shows that the results of the second task
suggest both tools are relatively consistent and there is
no big difference between them. This could indicate
that the EMOTIV device could be a reliable tool to
measure people’s experience.
As the results of both studies suggest that the
participants were not highly relaxed but slightly
stressed, this could be due to two possible reasons:
first: using a new device, which they are not very
familiar with; second: the noisy environment that
required participants to put more efforts to focus.
An observational technique was also used in this
study. Participants were verbalising their thoughts as
they performed the tasks, which made it easier for
researchers to capture them.
The results of this technique show that participants
liked the idea of using a mobile app for acquiring
information regarding cultural heritage sites. They
showed a great interest in using EMOTIV to measure
their experience as they looked excited, especially
they were able to see a 3D image that shows brain
activity pattern while they were performing the tasks.
It was noticed that most participants made comments
r e g a r d i n g t h e f i r s t t a s k a f t e r t h e y w e r e d o n e w i t h i t ,
while they were making comments regarding the
second task while they were doing it. This could be
explained in two ways: first, it could give an
impression they were more relaxed and enjoying the
first task, while they got slightly frustrated during the
second task. Second: the first task needed participants
to focus due to the noisy environment. Whilst both
explanations could be valid; we tend to go with the first
one due to the fact that participants looked interested
and enjoying the audio as explained below.
Regarding the first task and as mentioned earlier,
participants seemed the were enjoying the audio
explanation and mentioned the word “very
interesting” a lot during and after the task when they
talked about it after the completion of it. Regarding
the second task, participants very much wished to see
the old image of the attraction, but because it was
slightly challenging to obtain, they looked slightly
frustrated. One participant said, “I am holding breath
to get the old image”, as she mentioned that she really
wanted to see it clearly. Another Participant
mentioned that the time spent on getting the image to
show up had a negative effect on engagement. In brief,
the results of the observations were consistent with the
results of the questionnaire and the MyEmotiv app.
6 DISCUSSION
The user experience study presented in this paper
helped have preliminary insights regarding the use of
EEG devices such as EMOTIV Insight to measure the
experience of people automatically when performing
a task or simply when doing any activity. This would
support researchers to measure participants’
experience during field studies to get a better insight
on the investigated issues. The results of all methods
were relatively consistent, which give validity to the
findings.
The results indicate that the biometric data
obtained from of EMOTIV are reliable to some
extent, which means the device have a potential to be
used by researchers in field studies to measure the
experience of users alongside other self-reported
techniques. This could be a good tool in evaluation
studies, as often measuring the experience of users is
challenging due to the fact that the experience,
including aspects such as the ones measured in this
study (e.g. engagement, interest, etc.), is in users’
mind (Attfield et al., 2011; Henrie et al., 2015)] and
participants sometimes are not able to accurately
report the experience (Poole & Ball, 2006). An
example of this, the results of the questionnaire
show the average of the “focus” was 77% during the
first task, while the results of the app show it was
38%, which is a big difference. The justification for
this could be that participants sometimes cannot
measure their experience properly, or simply not
very accurate as human often forget things after a
short period. Someone could ask here, why not the
other way around and not the results of the app were
not accurate? Our justification for this, that although
there was a gap between the results of both tools of
the first task, the trend was the same, the only
exception was the “focus”. Additionally, the results
of the second task were relatively similar of both
tools. The other reason, the study took place at the
outdoor setting of the site on a beautiful summary
day, which was very busy; consequently, it was
noisy, which made sometimes slightly hard to focus.
Thus, we believe that the results of the app were
more accurate in this context.
Although the trend of the results was similar,
there was a gap between the results from both
resources (questionnaire and EMOTIV) as the results
of the questionnaire were slightly higher in most
metrics. That suggests that participants were more
generous in reporting their experience than the app.
Alongside the positive results regarding the
validity of capturing biometric data, this study
captured participants’ experience regarding the use of
HUCAPP 2023 - 7th International Conference on Human Computer Interaction Theory and Applications
106

a mobile app to acquire information at heritage
places. The results suggest participants enjoyed the
experience and liked using a mobile app for acquiring
historical information about cultural heritage places.
They showed a great interest in using such apps in the
context while at the same time enjoying being at the
place, i.e. not having to choose between the place and
the technology. This would give a sense of the place,
while at the same time receiving information about
the story of the place with less-cost. In short, this
study suggests two important points:
• Biometric data obtained from a device such as
EMOTIV Insight have a good potential to be
considered in user experience studies.
• Visitors of cultural heritage sites like and some
of them prefer using mobile apps that provide
stories of cultural heritage sites to have a low-
cost experience.
7 LIMITATIONS AND
IMPLICATIONS
A few implications and limitations were raised during
this study, which include:
• Time constraint of participants: although
recruiting participants in the context and
without previous planning has its own benefits,
such as capturing the experience of real users,
which is good for the validity of the research,
However, it has disadvantages in terms of time
constraints for participants as they were not
prepared to spend a considerable portion of
their leisure time participating in a study.
• Participants were not easy to recruit for the
same previous reason, as they were not willing
to waste their time of leisure participating in the
study.
• A technical issue had arisen during the study,
which was in setting up the EMOTIV device.
It seemed the sensors of the device needed to
be directly on the skin of the skull to work
properly, which was slightly challenging for
participants of thick hair.
• In addition, some hygiene issues were raised
as the device needed to be worn on heads; due
to this, some participants were slightly
cautious about wearing it.
• Noise was an issue as the site was busy on the
day of the study, which made it slightly
challenging sometimes to focus.
• Finally, the study is limited to a small-scale
sample; consequently, studies with a larger
number of participants are needed to confirm
validity of the accuracy of the EMOTIV
device.
8 CONCLUSIONS
A user experience study has been presented in this
paper. The EMOTIV insight device was utilised in this
study to measure the users’ experience during the use
of a mobile app for cultural heritage sites at outdoor
settings. A combination of three methods were used
in this study: capturing automated biometric data
using EMOTIV, questionnaire and observations. The
results of all methods were mostly consistent. The
results suggest that the data obtained from EMOTIV
are relatively reliable; thus, such devices could be a
good support for researchers to measure users’
experience in field studies.
The results show that participants were interested,
engaged and focused to some extent with the
experience when using a mobile app to acquire
information in an outdoor setting of a heritage place.
They mentioned it would provide a low-cost
experience. Also, the results suggest participants
were slightly stressed, possibly because of the noisy
environment combined with using a new device.
Additionally, the results show that participants were
m o r e g e n e r o u s w h e n r a t i n g t h e i r e x p e r i e n c e t h a n t h e
app. This also needs further research to be confirmed.
Further research is needed to with more
participants to provide a better insight regarding the
use of the EEG devices such as the EMOTIV Insight
device.
REFERENCES
Aguiar, S., Yanez, W., & Benítez, D. (2016). Low
complexity approach for controlling a robotic arm using
the Emotiv EPOC headset. 2016 IEEE International
Autumn Meeting on Power, Electronics and Computing
(ROPEC),
Alkhafaji, A., Fallahkhair, S., & Cocea, M. (2019). Design
challenges for mobile and wearable systems to support
learning on-the-move at outdoor cultural heritage sites.
IFIP Conference on Human-Computer Interaction,
Alkhafaji, A., Fallahkhair, S., & Haig, E. (2020). A
theoretical framework for designing smart and
ubiquitous learning environments for outdoor cultural
heritage. Journal of cultural heritage, 46, 244-258.
Amadieu, F., Salmerón, L., Cegarra, J., Paubel, P.-V.,
Lemarié, J., & Chevalier, A. (2015). Learning from
concept mapping and hypertext: An eye tracking study.
Biometric Evaluation to Measure Brain Activity and Users Experience Using Electroencephalogram (EEG) Device
107

Journal of Educational Technology & Society, 18(4),
100-112.
Attfield, S., Kazai, G., Lalmas, M., & Piwowarski, B.
(2011). Towards a science of user engagement (position
paper). WSDM workshop on user modelling for Web
applications,
Bai, A., & Fuglerud, K. S. (2018). Method for Semi-
Automated Evaluation of User Experience Using Brain
Activity. Studies in health technology and informatics,
256, 811-820.
Balart-Sánchez, S. A., Vélez-Pérez, H., Rivera-Tello, S.,
Velázquez, F. R. G., González-Garrido, A. A., &
Romo-Vázquez, R. (2019). A step forward in the quest
for a mobile EEG-designed epoch for
psychophysiological studies. Biomedical Engineering/
Biomedizinische Technik, 64(6), 655-667.
Chowdhury, P., Shakim, S. K., Karim, M. R., & Rhaman,
M. K. (2014). Cognitive efficiency in robot control by
Emotiv EPOC. 2014 International Conference on
Informatics, Electronics & Vision (ICIEV),
Dibeklioğlu, H., Surer, E., Salah, A. A., & Dutoit, T.
(2021). Behavior and usability analysis for multimodal
user interfaces. In: Springer.
Duvinage, M., Castermans, T., Petieau, M., Hoellinger, T.,
Cheron, G., & Dutoit, T. (2013). Performance of the
Emotiv Epoc headset for P300-based applications.
Biomedical engineering online, 12(1), 1-15.
EMOTIV INSIGHT. (2022). https://www.emotiv.com/
insight/
Galindo, G., & García-Canseco, E. (2015). Emotions
Identification to Measure User Experience Using Brain
Biometric Signals.
Hassenzahl, M., & Tractinsky, N. (2006). User experience-
a research agenda. Behaviour & information
technology, 25(2), 91-97.
Henrie, C. R., Halverson, L. R., & Graham, C. R. (2015).
Measuring student engagement in technology-mediated
learning: A review. Computers & Education, 90, 36-53.
Heunis, C. (2016). Export and Analysis of Emotiv Insight
EEG data via EEGLAB. In: Sept.
Holman, M., & Adebesin, F. (2019). Taking the
Subjectivity out of UX Evaluation with Emotiv
EPOC+. In Proceedings of the South African Institute
of Computer Scientists and Information Technologists
2019 (pp. 1-10).
Kotowski, K., Stapor, K., Leski, J., & Kotas, M. (2018).
Validation of Emotiv EPOC+ for extracting ERP
correlates of emotional face processing. Biocybernetics
and Biomedical Engineering, 38(4), 773-781.
Law, E. L.-C., Roto, V., Hassenzahl, M., Vermeeren, A. P.,
& Kort, J. (2009). Understanding, scoping and defining
user experience: a survey approach. Proceedings of the
SIGCHI conference on human factors in computing
systems,
McNamara, N., & Kirakowski, J. (2006). Functionality,
usability, and user experience: three areas of concern.
interactions, 13(6), 26-28.
Paul, C. L., & Komlodi, A. (2014). Measuring user
experience through future use and emotion. In CHI'14
Extended Abstracts on Human Factors in Computing
Systems (pp. 2503-2508).
Pel, J., Manders, J., & Van der Steen, J. (2010). Assessment
of visual orienting behaviour in young children using
remote eye tracking: methodology and reliability.
Journal of Neuroscience Methods, 189(2), 252-256.
Poole, A., & Ball, L. J. (2006). Eye tracking in HCI and
usability research. In Encyclopedia of human computer
interaction (pp. 211-219). IGI Global.
Šumak, B., Špindler, M., & Pušnik, M. (2017). Design and
development of contactless interaction with computers
based on the Emotiv EPOC+ device. 2017 40th
International Convention on Information and
Communication Technology, Electronics and
Microelectronics (MIPRO),
Vermeeren, A. P., Law, E. L.-C., Roto, V., Obrist, M.,
Hoonhout, J., & Väänänen-Vainio-Mattila, K. (2010).
User experience evaluation methods: current state and
development needs. Proceedings of the 6th Nordic
conference on human-computer interaction: Extending
boundaries,
Vokorokos, L., Mados, B., Ádám, N., & Baláz, A. (2012).
Data acquisition in non-invasive brain-computer
interface using emotiv epoc neuroheadset. Acta
Electrotechnica et Informatica, 12(1), 5.
Zhang, J. Z., Jadavji, Z., Zewdie, E., & Kirton, A. (2019).
Evaluating if children can use simple brain computer
interfaces. Frontiers in human neuroscience, 13, 24.
HUCAPP 2023 - 7th International Conference on Human Computer Interaction Theory and Applications
108
