
Comparison of Machine Learning Algorithms for
Human Activity Recognition
Hassan Ashraf
a
, Olivier Brüls
b
, Cédric Schwartz
c
and Mohamed Boutaayamou
d
Laboratory of Movement Analysis (LAM-Motion Lab), University of Liège, Liège, Belgium
Keywords: Human Activity Recognition, Daily-Life Activity Classification, Machine Learning, Pattern Recognition,
Wearable Sensors, Inertial Sensors, Accelerometer, Gyroscope, IMU Signals.
Abstract: Human activity recognition (HAR) is utilized to automatically identify the daily-life activities of people for
the effective management of age-related health conditions. Classical machine learning (ML) algorithms are
used to design HAR systems, in a subject-specific or population-based configuration depending on the
application. In this study, the performance of 8 classical and ensemble-learning-based ML classifiers has been
studied for both HAR configurations. Inertial measurement unit (IMU) signals from 10 healthy participants,
corresponding to various static, dynamic, and transitional daily-life activities, were acquired. Random forest
(RF), ensemble adaptive boosting (EAB), ensemble subspace (ES), decision tree (DT), k-nearest neighbors
(KNN), linear discriminant analysis (LDA), support vector machine (SVM), and artificial neural network
(ANN) were used to classify these activities. The performance of the classifiers was measured in terms of
mean classification accuracy (MCA). The results showed that, for a subject-specific HAR system, ES
(97.78%) has achieved the highest MCA followed by RF (96.61%) and SVM (96.11%) while outperforming
the DT, KNN, and LDA (P-value < 0.05). For a population-based HAR system, SVM (95.18%) achieved the
highest MCA, however, no significant difference has been observed among the MCA of all the investigated
classifiers (P-value > 0.05). Also, the class-wise comparison reveals that SVM outperformed the other
investigated classifiers in terms of MCAs for each of the distinct activities. Based on the HAR configuration
incorporating diverse static, dynamic, and transitional daily-life activities, the findings may be used to develop
a customized HAR system for the effective management of movement disorders.
1 INTRODUCTION
According to the International Diabetes Foundation
(IDF), the global diabetes prevalence in adults aged
20 to 79 years old is expected to be 536.6 million in
2021, rising to 783.2 million in 2045 (Atlas, 2015).
Similarly, more than 10 million people worldwide are
living with Parkinson’s disease (PD) and the
incidence of PD increases with age (Tysnes &
Storstein, 2017). Such an aging population needs
care. Smart healthcare systems seem to be a possible
answer to the rising aging population dilemma. They
can provide smart health services to meet the needs of
this rising population by monitoring and analysing
any critical health state of the elderly in their daily
a
https://orcid.org/0000-0003-0519-0619
b
https://orcid.org/0000-0003-2668-1353
c
https://orcid.org/0000-0002-7307-7821
d
https://orcid.org/0000-0001-9564-528X
activities. Smart healthcare systems not only allow
older people to live autonomously, but they may also
offer more sustainable healthcare solutions by
reducing the strain placed on the entire health system
by the aged and dependent persons.
Human activity recognition (HAR) is a prominent
research topic that can give a solution to such a
challenge by playing an important role in healthcare,
particularly in medical diagnosis and fitness
monitoring. Accurate assessment of physical activity
is therefore critical in establishing intervention
methods, as it provides rich contextual information
from which more important information may be
inferred. HAR may also be used for people with a
mental ailment or disease, such as Parkinson's
162
Ashraf, H., Brüls, O., Schwartz, C. and Boutaayamou, M.
Comparison of Machine Learning Algorithms for Human Activity Recognition.
DOI: 10.5220/0011631500003414
In Proceedings of the 16th International Joint Conference on Biomedical Engineering Systems and Technologies (BIOSTEC 2023) - Volume 4: BIOSIGNALS, pages 162-169
ISBN: 978-989-758-631-6; ISSN: 2184-4305
Copyright
c
2023 by SCITEPRESS – Science and Technology Publications, Lda. Under CC license (CC BY-NC-ND 4.0)

disease, to monitor their actions regularly and notice
any abnormalities (Church, 2021).
Machine learning (ML) or pattern recognition
methods are primarily used to process signals for the
development of HAR applications. Irrespective of the
chosen ML method, the data is processed in two
stages, i.e., training the ML model on the pre-
recorded dataset and then testing the trained model on
unseen data. The HAR signal processing with ML
methods involves data acquisition, signal pre-
processing, feature extraction, and classification.
Each of the subsequent steps of the signal processing
pipeline is of crucial importance to capture the
desired information and extract patterns. Along with
different choices for each subsequent signal
processing step, a HAR system can be designed in
two configurations i.e., subject-specific and
population-based, depending on the application. In
subject-specific HAR systems the training and testing
data is utilized from the same subject, whereas, in
population-based HAR systems the model is trained
on data acquired from multiple subjects (population)
and tested on new subjects.
Among other parameters, the selection of the
classifier is of utmost importance since its objective
is to map extracted features into distinct classes.
Various researchers have done tremendous work to
identify the impact of each of the parameters on the
performance of the HAR system. Ambati et al. 2020
conducted a comparative study for a smartphone-
based HAR system to evaluate the performance of
different ML classifiers including naïve Bayes (NB),
logistic regression (LR), decision tree (DT), and
random forest (RF) using 3 different HAR datasets
(Ambati & El-Gayar, 2020). The study reported that
RF performed better than the rest of the utilized ML
algorithms, however, the study did not report the
utilized HAR configuration. Similarly, another study
also conducted a comparative analysis to evaluate the
performance of different ML classifiers for mobile-
based HAR applications to recognize 6 different daily
life activities (Min et al, 2020).
For a subject-specific HAR system, the study
reported that the RF algorithm outperforms the rest of
the ML classifiers (Min et al., 2020). Another study
compared LR, support vector machine (SVM), DT,
and RF for a 6-class population-based HAR system
and reported that SVM outperformed all the other ML
classifiers by achieving a validation accuracy of
96.57% (Muralidharan et al., 2021). Logacjov et al.
(2021) presented a body-worn sensors-based HAR
dataset from 22 participants (Logacjov et al., 2021).
For a population-based HAR system with leave-one-
out validation the performance of k-nearest neighbors
(KNN), SVM, RF, and XGBoost (XGB) was
compared. The results demonstrated that SVM
outperformed the rest of the algorithms with an F1
score of 0.81±0.18. Baldominos et al. (2019)
performed a comparative analysis of ML techniques
for a mobile phone-based HAR system (Baldominos
et al., 2019). The data were recorded from 10 healthy
participants for 13 daily life activities and the
performance of ensemble trees (ET), NB, KNN, LR,
artificial neural network (ANN), and RF was
compared for a population-based HAR system. The
results demonstrate that ET outperformed the rest of
the ML algorithms by achieving an accuracy of
94.87%. Another study was conducted by Attal et al.
(2015) from a dataset of 6 healthy subjects for 12
different HAR activities (Attal et al., 2015). For a
subject-specific HAR system KNN, SVM, and RF
classifiers were used to classify different HAR
activities. The results report that KNN outperforms
the rest of the algorithm with an accuracy of 96.53 ±
0.2. Vijayvargiya et al. (2021) compared the
performance of KNN, LDA, bagging classifier
(BagC), boosting classifier (BosC), DT, RF, and
SVM for population-based HAR system by
concluding that RF yields the best results with an
accuracy of 92.71% (Vijayvargiya et al., 2021).
Table 1: Daily life activities performed by each participant.
ID Activity type Activity Description
1
Dynamic
Walk normal
(
WN
)
Walkin
g
and turnin
g
at normal s
p
eed on a flat surface.
2
Walk dual task (WD)
Walking and turning at normal speed while carrying a
tra
y
and havin
g
g
lasses.
3 Walk slow
(
WS
)
Walkin
g
and turnin
g
at a slow s
p
eed on a flat surface.
4 Walk fast (WF) Walking and turning at a fast speed on a flat surface.
5 Stairs descending (SD) Descending the stairs.
6 Stairs ascending (SA) Ascending the stairs.
7
Transitional
Walk and sit
(
WSit
)
Walkin
g
towards the chair, sittin
g
, and standin
g
u
p
.
8 Walk and la
y
down
(
WLa
y)
Walkin
g
towards the bed, la
y
in
g
down, and standin
g
u
p
.
9
Static
Sittin
g
on a chair
(
Sit
)
Sittin
g
on a chair.
10 Laying on a
b
ed (Lay) Laying on a bed.
Comparison of Machine Learning Algorithms for Human Activity Recognition
163

Although various researchers have done great
work to identify the best ML algorithm for the
development of HAR applications by conducting
both subject-specific and population-based studies.
However, there is no consensus about which ML
algorithm is best suitable for both HAR
configurations and there is a lack of simultaneous
comparison of both configurations for the data
recorded from the same population. For
generalization, we hypothesize that it is important to
compare different ML algorithms on the same
population (subjects) for both HAR configurations
due to the data-driven nature of the ML algorithms.
Secondly, statistical significance and class-wise
performance should also be taken into consideration
while evaluating the performance of the algorithms.
Finally, the performance of the ensemble learning-
based ML classifiers should also be investigated
along with classical ML classifiers.
Thus, this study aims to identify, among many
available ML algorithms, which is best suited to HAR
applications for both configurations (subject-specific
and population-based). Furthermore, to statistically
validate the results a one-way analysis of variance
(ANOVA) test was also conducted.
2 METHODOLOGY
2.1 Dataset
The experiment was conducted on ten healthy
subjects (one female and nine males; average age
(years) = 26.6±1.7; average height (cm) = 174.0±5.9;
average weight (kg) = 69.6±6.3) without having any
gait or movement disorders. Before recording the
data, the participants were informed about the
experimental protocol and they were instructed to
follow their natural pattern of daily-life activities. The
experimental protocol consisted of ten different static,
dynamic and transitional activities as described in
table 1. All the participants completed the designed
daily-life activities in a lab environment (Laboratory
of Movement Analysis (LAM-Motion Lab),
University of Liège, Liège, Belgium) by following a
structured experimental protocol. For each daily-life
activity, the subjects performed 5 repetitions.
An existing IMU-based hardware system was
used to record the movement signals (Boutaayamou
et al., 2019). Four customized wired-IMU sensors
were placed on the left heel, right heel, left wrist, and
lower back. To minimize the movement of IMU
sensors all sensors were tightly attached to the body.
Each IMU sensor (2 cm × 0.7 cm × 0.5 cm) with a
sampling frequency of 200 Hz was equipped with a
three-axis accelerometer (range: ±16 g) and a three-
axis gyroscope (range: 2000 degrees/second). All the
IMU sensors, through wires, were connected to an
integrated system comprised of a system-integrated
memory, a microcontroller, and a battery. Once the
data is recorded, all the data were transferred to a
computer for further processing and analysis.
MATLAB 2022a has been used to process and
generate the results.
2.2 Pre-Processing
Most of the spectral power of human body
movements is concentrated between 0 to 20 Hz
(Wohlfahrt, 2012). Furthermore, the signals recorded
by accelerometers are a combination of acceleration
due to the movement of the body, acceleration due to
gravity, the noise which is intrinsic to the
measurement system, and motion artifacts. Only the
acceleration signals (body acceleration and gravity
acceleration) are required for the analysis in most of
the applications, whereas other components are
regarded as unwanted noise (Awais, 2018).
Depending on the application and types of noise
embedded in the original signals various digital filters
can be utilized to minimize the effects of unwanted
noise. For HAR applications both acceleration signals
are quite useful thus it is only desired to separate any
spectral content beyond the spectral range of human
body movements. In this study, a third-order
Butterworth lowpass filter with a cut-off frequency of
20 Hz was applied to the acquired signals to remove
the unwanted frequency components. Figure 1 depicts
the raw and filtered signal both in the time and
frequency domains. It can be observed that with the
application of the applied digital filter the frequencies
above 20 Hz have been discarded.
2.3 Segmentation/Windowing
The sensors attached to the body supply a continuous
stream of signals acquired from the human body. To
analyse and process them, these signals are
segmented into segments of finite length. Primarily
disjoint and overlap windowing/segmentation
techniques are utilized to make segments of the
signals under consideration. Before segmentation, it
is important to consider the variable durations of
different human body movements. For example,
transitional activities (e.g., sit-to-stand) are
completed in less time as compared to static (e.g.,
standing) or dynamic activities (e.g., walking).
Intuitively, smaller segments or window sizes capture
BIOSIGNALS 2023 - 16th International Conference on Bio-inspired Systems and Signal Processing
164
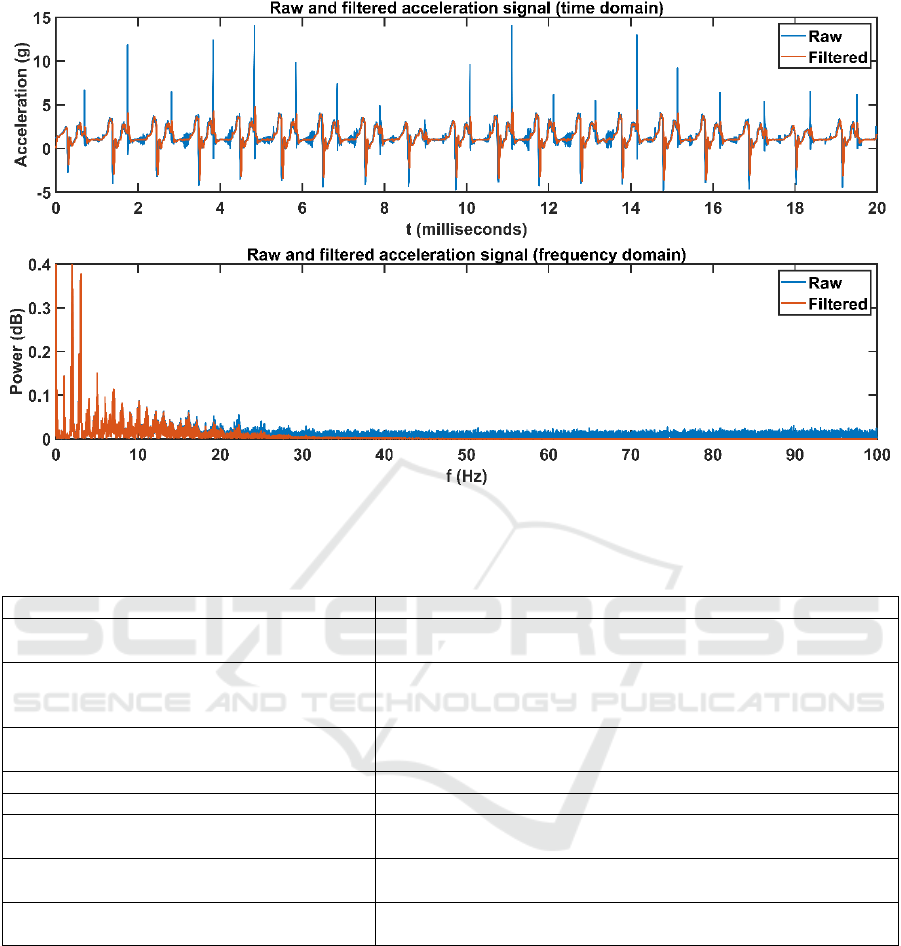
Figure 1: The raw and filtered acceleration signal in the time and frequency domain. The upper graph shows the acceleration
signal in the time domain, the lower graph shows the frequency spectrum of the raw signal.
Table 2: ML classifiers and the training parameters.
Classifie
r
Trainin
g
p
arameters
Random forest (RF)
Number of decision splits = 942
Number of learning cycles = 30
Ensemble adaptive boosting (EAB)
Number of decision splits = 20
Number of learning cycles = 30
Learnin
g
rate = 0.1
Ensemble subspace (ES)
Learner = Discriminant analysis
Number of learnin
g
c
y
cles = 30
Decision tree
(
DT
)
Number of decision s
p
lits = 100
K
-nearest neighbors (KNN) Number of nearest neighbors = 1
Linear discriminant analysis (LDA)
Discriminant type = linear
Amount of re
g
ularization = 0
Support vector machine (SVM)
Box constraint = 1
Kernel function = linea
r
Artificial neural networks (ANN)
Hidden layers = 18
Trainin
g
function = scaled con
j
u
g
ate
g
radient
the underlying patterns of transitional activities while
missing the information necessary to capture the
patterns of dynamic and static activities. Similarly,
longer window sizes provide better results for static
and dynamic activities and perform poorly for
transitional activities since the longer window sizes
overlap the important information of transitional
activities also these windows are very prone to noise.
Furthermore, longer windows require more
computational power as compared to smaller window
sizes. Yamansavaşçılar & Güvensan (2016)
suggested that, for HAR activities, a window size of
more than 6 s is sufficient to capture the underlying
patterns of the movements (Yamansavaşçılar &
Güvensan, 2016). Thus, in this study, an overlap
windowing technique with a window size of 6 s and
an overlap size of 60% has been employed.
2.4 Feature Extraction
After the signals have been segmented, they must be
transformed into feature space. The goal of the feature
space is to minimize the dimensionality of the
original data and extract the descriptive hidden
Comparison of Machine Learning Algorithms for Human Activity Recognition
165

underlying information of movement patterns,
making it easier to map the complicated data into
predetermined categories. The collected features
should have enough data to train the machine learning
algorithms. Various temporal, frequency, and time-
frequency domain features have been reported to
enhance the efficacy of a HAR system (Rosati et al.,
2018). In this study, the investigated features are:
mean, root mean square, autocorrelation features for
all three axis components (height of the main peak;
height and position of the second peak), spectral peak
features (height and position of the first 6 peaks),
spectral power features (total power in 3 adjacent and
pre-defined frequency bands of 1.5, 5, and 10 Hz) and
signal magnitude area.
2.5 Classification
The feature space is utilized as an input to the
classifier after extracting relevant information from
the segments. The classifier creates the final
mappings from the characteristics associated with
each class. To classify daily-life activities for various
HAR applications, multiple ML classifiers such as
NB, DT, RF, SVM, LDA, KNN, and ANN are often
employed. The performance of several ML
algorithms (classical and ensemble-learning-based)
has been evaluated, as the goal of this work is to
determine the most suited ML classifier for subject-
specific and population-based HAR systems. Table 2
describes the explored ML algorithms as well as the
training parameter choices.
In subject-specific HAR configuration, 70% of
the data from each subject was randomly selected to
train the classifier, and the remaining 30% of the data
was utilized to assess the trained classifier's
performance. A leave-one-out validation technique,
on the other hand, has been used for a population-
based HAR system. The data from nine participants
were initially concatenated and fed into the classifier
for training, then the data from the last subject was
utilized to evaluate the developed ML model. The
technique continued until all of the participants, one
by one, were tested. To assess the performance of
each classifier, the classification accuracy (CA) has
been calculated based on the actual and predicted
results. CA is a percentage that is calculated by
dividing the proportion of accurate predictions by all
possible predictions and multiplying the result by
100. To further validate the results, statistical analysis
has been undertaken by using ANOVA with Tuckey’s
honest post-hoc test to reject the null hypothesis by
considering a P-value of 0.05 significant.
3 RESULTS
3.1 Subject-Specific HAR System
Table 3 presents the CAs for all subjects
corresponding to each investigated classifier. The
cells with bold syntax represent the highest achieved
testing accuracy for each subject. For all the subjects
RF, EAB, ES, and SVM obtained more than 90% CA.
The results indicate that ES achieved the highest
accuracies for most of the subjects (nine subjects)
followed by RF (one subject). Although ES has
obtained the highest CAs for most of the subjects the
RF, EAB, and SVM have also achieved comparable
results.
Mean classification accuracy (MCA) was
calculated by averaging the CA for all subjects
corresponding to each investigated classifier. MCA
for all subjects showed that ES has achieved the
highest MCA of 97.78% followed by RF (96.61%)
and SVM (96.11%). Furthermore, statistical
analysis revealed that ES has outperformed the DT,
KNN, and LDA (P-value < 0.05). However, no
significant difference in MCA of ES, RF, EAB,
SVM, and ANN has been observed (P-value > 0.05).
It can be observed that DT, LDA, KNN, and ANN
performed poorly for SD, SA, WSit, and WLay
activities. Furthermore, although ES, RF, SVM, and
EAB have no statistically significant difference in
MCAs, however, still ES is the only classifier
obtaining more than 90% accuracy for all the
individual activities. Despite having no statistically
significant difference in MCA of ES, RF, EAB,
SVM, and ANN (P-value > 0.05), ES has resulted in
higher CAs for all the classes.
3.2 Population-Based HAR System
In the population-based HAR system, the ML
classifiers were trained on data combined from nine
subjects and tested on the data from the remaining
subject. Table 4 presents the CAs for the population-
based HAR system corresponding to each testing
subject. The highest CAs for individual testing
subjects have been attained by SVM (three testing
subjects), ES (three testing subjects), and RF (two
testing subjects).
All the classifiers attained more than 90%
accuracy corresponding to at least one of the
investigated classifiers except one testing subject
(TSID = 8). According to statistical analysis, SVM
and DT obtained maximum and minimum MCAs
of 95.18% and 86.33%, respectively. However, no
BIOSIGNALS 2023 - 16th International Conference on Bio-inspired Systems and Signal Processing
166
Table 3: CA (%) for all the subjects corresponding to each investigated ML classifier for a subject-specific HAR system. The
first column represents the subject ID (SID). The cells highlighted in bold represent the classifier with the highest CA for
each subject.
SID RF EAB ES DT KNN LDA SVM ANN
1 98,3 96,0 98,7 94,0 94,4 98,0 96,0 91,7
2 97,9 97,5 97,9 93,6 94,0 93,6 97,2 97,9
3 97,9 95,4 98,7 92,4 91,6 94,1 97,0 96,6
4 95,3 95,3 97,2 88,1 91,3 91,7 96,0 94,9
5 96,1 96,1 97,2 89,0 91,5 92,9 95,8 94,3
6 95,7 94,5 97,9 86,0 94,9 88,9 96,2 93,2
7 96,9 96,9 97,3 93,9 92,9 95,9 96,9 96,6
8 94,8 93,1 97,0 86,6 86,6 77,9 92,2 88,7
9 99,3 96,0 98,9 93,8 95,2 98,5 97,1 97,1
10 93,8 93,4 97,1 91,8 94,7 93,0 96,7 95,1
Mean ± St
d
96,6 ± 1,7 95,4 ± 1,3 97,8 ± 0,7 90,9 ± 3,0 92,7 ± 2,5 92,5 ± 5,6 96,1 ± 1,4 94,6 ± 2,7
significant difference in the MCA of all the evaluated
classifiers for the population-based HAR system was
identified (P-value > 0.05). SVM and DT resulted in
the best and worst class-wise performance results,
respectively. All the investigated classifiers are
performing poorly in at least one of the classes,
except SVM. Regardless of the testing subject data or
signal class, SVM was able to classify all classes with
substantially greater accuracy.
4 DISCUSSION
The study aimed to investigate the performance of
classical and ensemble learning based on different
ML classifiers to design subject-specific and
population-based HAR systems. Both HAR
configurations were designed based on IMU data
recorded from 10 healthy volunteers. The data was
comprised of various static, dynamic and transitional
daily-life activities. For the first time, we explored the
efficacy of ensemble-learning-based ML classifiers
for both HAR configurations and compared the
performance with classical ML classifiers.
The findings for the subject-specific HAR system
demonstrated that ES has obtained the highest MCA
of 97.78% while outperforming the rest of
investigated ML classifiers. Statistical investigation
revealed no significant difference in the performance
of ES, RF, EAB, SVM, and ANN (P-value > 0.05).
Most of the literature, regarding the selection of a
classifier for a subject-specific HAR system, suggests
that RF, KNN, and SVM are the best suitable ML
classifiers (Attal et al., 2015; Logacjov et al., 2021;
Min et al, 2020; Muralidharan et al., 2021). Our
findings are consistent with past research in this area,
suggesting that RF delivers higher performance
results. However, the results showed that ES
outperforms RF in terms of MCA. ES has not only
outperformed the other classifiers in terms of MCA
but also, achieved higher classification rates in terms
of class-wise MCA. The average class-wise CA for
all the investigated classifiers showed that only ES
has achieved more than 90% MCA for all the
individual classes. Intuitively, it is difficult for any
HAR system to differentiate among transitional
activities since the underlying patterns of the
movement signals are so similar. For example, the
WSit class incorporates both walking and sitting,
which is similar to the classes that require both
walking and sitting. Because of this resemblance, it is
difficult to distinguish transitory activities from the
rest of the activities. Except for ES, all of the tested
classifiers resulted in decreased MCA for transitional
activities (SD, SA, WSit, and WLay). Based on these
findings, it can be concluded that in a subject-specific
HAR system, ES delivers the best classification
results in a subject-specific HAR system.
SVM resulted in the highest MCA for a
population-based HAR system with an overall MCA
of 95.18%. Statistical analysis has revealed that there
is no significant difference in MCAs of all the
investigated classifiers (P-value < 0.05). Previous
literature on population-based HAR systems also
indicates that SVM and RF are the best ML classifiers
in terms of MCA (Baldominos et al., 2019;
Logacjovet al., 2021; Muralidharan et al., 2021;
Vijayvargiya et al., 2021). However, overall MCA is
not the only indicator of the performance measure
since it does not provide any insight into class-wise
performance. Although SVM, LDA, ES, and RF have
comparable performance in terms of MCA, however,
the class-wise performance of these classifiers is
vastly different. From figure 3 it is evident that RF,
ES, and LDA are performing very poorly in
transitional and dynamic activities. Conversely, SVM
Comparison of Machine Learning Algorithms for Human Activity Recognition
167

Table 4: CA (%) for all the subjects corresponding to each investigated ML classifier for a population-based HAR system.
The first column represents the testing subject ID (TSID). The cells highlighted in bold represent the classifier with the highest
CA for each subject.
TSID RF EAB ES DT KNN LDA SVM ANN
1 94,4 87,1 94,4 85,1 93,1 94,7 99,0 94,4
2 95,0 95,4 95,7 92,9 86,9 94,3 95,0 93,6
3 95,0 94,1 98,7 91,2 85,3 98,3 98,3 95,8
4 95,2 94,0 96,8 88,1 92,5 95,2 98,0 98,8
5 96,2 94,1 95,5 92,0 86,0 94,1 97,2 96,9
6 93,6 87,1 94,0 84,1 82,8 92,7 93,6 92,7
7 92,2 75,7 81,8 71,3 84,5 79,1 95,3 80,4
8 75,3 77,1 83,5 69,7 86,6 89,2 80,5 80,5
9 98,2 93,8 97,5 93,5 86,2 92,0 95,6 85,5
10 100,0 97,5 99,2 95,5 88,9 99,6 99,2 98,8
Mean ± St
d
93,5 ± 6,4 89,6 ± 7,3 93,7 ± 5,8 86,3 ± 8,6 87,3 ± 3,1 92,9 ± 5,4 95,2 ± 5,2 91,7 ±6,7
is obtaining consistent MCA for static, dynamic, and
transitional activities. Except for SVM, all the other
investigated classifiers yielded a high
misclassification rate for at least one of the activities.
For example, ANN and LDA resulted in high MCA
for all the activities, however, both classifiers
misclassified WN activity with WS and/or WF. From
these findings, it can be concluded that for a
population-based HAR system, SVM provides better
classification results in terms of overall and class-
wise MCA.
While comparing the two configurations, it was
discovered that the performance of the ML classifiers
varies dramatically. Figure 4 illustrates the MCA for
all classifiers examined in both configurations.
Switching from a subject-specific HAR system to a
population-based HAR system reduces the MCA for
all ML classifiers except LDA. Although it is a well-
known fact that ML algorithms perform better when
trained on big datasets, a drop in accuracy has been
reported for a population-based HAR system. One
possible reason for this phenomenon is the increased
variance of the dataset owing to the inclusion of data
from various subjects. Since every human has
different movement patterns, it is challenging for the
ML algorithm to capture the between-subject
variation for any daily-life activity. Despite the higher
between-subject variation, LDA and SVM performed
consistently in terms of MCA for all subjects for both
configurations. The difference between subject-
specific and population-based HAR systems is quite
small in both circumstances. Further research should
be done to determine how the number of individuals
affects the performance of a population-based HAR
system.
Despite the results providing a basic
understanding of the choice of ML classifier to design
a HAR system with subject-specific and population-
based configuration, the limitations of the study are:
(1) the utilized dataset should be increased further by
including more number of subjects, (2) number of
daily-life activities, more specifically, complex daily-
life activities should also be considered in future, (3)
since the dataset has been recorded in a controlled
environment thus the unstructured and uncontrolled
daily-life activities may induce a higher variability in
the results.
5 CONCLUSIONS
The study presented the comparison of classical and
ensemble learning-based ML classifiers to design
subject-specific and population-based HAR systems
to classify diverse daily-life activities. The movement
data were acquired using custom-designed IMU
sensors from ten healthy participants for different
static, dynamic and transitional activities. The results
demonstrated that, for both subject-specific and
population-based HAR systems, ES and SVM are the
best ML classifiers in terms of overall MCA and
class-wise performance. For the subject-specific
HAR system, the results demonstrated that ES
outperforms RF and all other investigated classifiers
by obtaining higher overall and class-wise MCA. The
ES and SVM-based proposed HAR systems can be
used to recognize intricate daily-life activities for the
development of a smart healthcare system.
REFERENCES
Atlas, D. (2015). International diabetes federation. IDF
Diabetes Atlas, 7th edn. Brussels, Belgium:
International Diabetes Federation, 33.
BIOSIGNALS 2023 - 16th International Conference on Bio-inspired Systems and Signal Processing
168

Ambati, L. S., & El-Gayar, O. (2020). A Comparative
Study of Machine Learning Approaches for Human
Activity Recognition.
Attal, F., Mohammed, S., Dedabrishvili, M., Chamroukhi,
F., Oukhellou, L., & Amirat, Y. (2015). Physical human
activity recognition using wearable sensors. Sensors,
15(12), 31314-31338.
Awais, M. (2018). Physical Activity Classification Meeting
Daily Life Conditions for Older Subjects.
Baldominos, A., Cervantes, A., Saez, Y., & Isasi, P. (2019).
A comparison of machine learning and deep learning
techniques for activity recognition using mobile
devices. Sensors, 19(3), 521.
Boutaayamou, M., Schwartz, C., Joris, L., Forthomme, B.,
Denoël, V., Croisier, J.-L., Verly, J., Garraux, G., &
Bruls, O. (2019). Adaptive method for detecting zero-
velocity regions to quantify stride-to-stride spatial gait
parameters using inertial sensors. In Proceedings of the
12th International Joint Conference on Biomedical
Engineering Systems and Technologies (BIOSTEC
2019). doi:10.5220/0007576002290236.
Church, F. C. (2021). Treatment options for motor and non-
motor symptoms of Parkinson’s disease. Biomolecules,
11(4), 612.
Logacjov, A., Bach, K., Kongsvold, A., Bårdstu, H. B., &
Mork, P. J. (2021). HARTH: A Human Activity
Recognition Dataset for Machine Learning. Sensors,
21(23), 7853.
Min, Y., Htay, Y. Y., & Oo, K. K. (2020). Comparing the
performance of machine learning algorithms for human
activities recognition using the wisdm dataset.
International Journal of Computer (IJC), 38(1), 61-72.
Muralidharan, K., Ramesh, A., Rithvik, G., Prem, S.,
Reghunaath, A. A., & Gopinath, M. P. (2021). 1D
Convolution approach to human activity recognition
using sensor data and comparison with machine
learning algorithms. International Journal of Cognitive
Computing in Engineering, 2, 130-143.
Rosati, S., Balestra, G., & Knaflitz, M. (2018). Comparison
of different sets of features for human activity
recognition by wearable sensors. Sensors, 18(12), 4189.
Tysnes, O. B., & Storstein, A. (2017). Epidemiology of
Parkinson’s disease. Journal of neural transmission,
124(8), 901-905.
Vijayvargiya, A., Kumari, N., Gupta, P., & Kumar, R.
(2021, May). Implementation of machine learning
algorithms for human activity recognition. In 2021 3rd
International Conference on Signal Processing and
Communication (ICPSC) (pp. 440-444). IEEE.
Wohlfahrt, P. (2012). Spectral Analysis of Accelerometric
Data to Identify Human Movement Patterns.
Bachelorarbeit. Institut für Physik, Martin-Luther-
Universität Halle-Wittenberg.
Yamansavaşçılar, B., & Güvensan, M. A. (2016, March).
Activity recognition on smartphones: Efficient
sampling rates and window sizes. In 2016 IEEE
international conference on pervasive computing and
communication workshops (PerCom Workshops) (pp.
1-6). IEEE.
Comparison of Machine Learning Algorithms for Human Activity Recognition
169
