
Human-Centered Design for the Efficient Management of Smart
Genomic Information
Alberto Garc
´
ıa S.
a
, Mireia Costa
b
, Ana Le
´
on
c
, Jose F. Reyes
d
and Oscar Pastor
e
Pros Research Center, VRAIN Research Institute, Polytechnic University of Valencia, Valencia, Spain
Keywords:
Genomics, Human-Centered Design, Human-Computer Interaction, GenomIUm.
Abstract:
Genomics is a massive and complex domain that requires great efforts to extract valuable knowledge. Due
to the reduction in sequencing costs and the advent of Next Generation Sequencing, the amount of publicly
available genomics data has increased notably. These data are complex and heterogeneous, which makes
the development of intuitive and usable tools critical. However, bioinformatics tools have been developed
without oncsidering usability and User Interface design. As a result, there are relevant usability problems that
complicate the work of bioinformaticians. Human-Centered Design consists of a design approach that grounds
the User Interface design process on the needs and desires of users and can be a suitable solution to improve
the usability of new genomics tools. This work shows how intuitive and usable bioinformatics tools can be
produced using HCD principles.
1 INTRODUCTION
Genomics is a complex interdisciplinary field that has
revolutionized how we understand medicine, disease
prevention, and treatment. In recent decades, the
amount of publicly available genomics data has in-
creased dramatically, outpacing by far our ability to
interpret it. The scientific community has made great
efforts to address this situation and developed thou-
sands of bioinformatics tools to analyze and interpret
genomics data. However, a number of these tools
have been developed without considering how their
design impacts user experience and knowledge ex-
traction, and there is a growing concern that current
approaches are insufficient to deliver intuitive and us-
able User Interfaces (UIs) (Pavelin et al., 2012).
The UIs of these tools lack the quality and usabil-
ity of other tools that people come across in their daily
lives, such as word processing or spreadsheets (Java-
hery et al., 2004). Javahery et al. highlighted that the
design of bioinformatics tools is more complex and
less intuitive when compared to more general-purpose
UIs (Javahery et al., 2004).
Consequently, bioinformatics tools poorly repre-
sent the underlying concepts, and their interaction
a
https://orcid.org/0000-0001-5910-4363
b
https://orcid.org/0000-0002-8614-0914
c
https://orcid.org/0000-0003-3516-8893
d
https://orcid.org/0000-0002-9598-1301
e
https://orcid.org/0000-0002-1320-8471
mechanisms are challenging to understand. This leads
to usability issues that significantly impact the effi-
ciency and effectiveness of bioinformatics daily work
(Bolchini et al., 2009), who will struggle to find valu-
able information for their research (Carpenter et al.,
2012). Carpenter et al. suggest that, in order to find
valuable information more efficiently and increase the
adoption of bioinformatics tools, usability should be
a more important goal (Carpenter et al., 2012).
To produce usable tools in complex domains such
as bioinformatics, getting a precise understanding of
how users work is crucial. Correctly understanding
domain-specific tasks and the particularities of their
working context allows developers to improve UI de-
sign, making them more usable and efficient (Svanæs
et al., 2008). Having the user as the central source
of information to design and develop UIs has multi-
ple benefits (Pavelin et al., 2012). For instance, users
will be more likely to use a tool if they have guided
its design process, and user-friendly access to the data
potentially increases users’ scientific discoveries.
Although usability has been frequently ignored in
bioinformatics, it is a fundamental dimension for gen-
erating easy-to-use UIs. A well-designed UI allows
users to perform their tasks efficiently and facilitates
achieving their goals (Rimmer, 2004). As we have
mentioned before, improving the usability of bioin-
formatics tools requires focusing more on UI design
and user needs during their design process. To this
aim, Human-Centered Design (HCD) can be a help-
ful solution as it designs UIs focusing on user needs
García S., A., Costa, M., León, A., Reyes, J. and Pastor, O.
Human-Centered Design for the Efficient Management of Smart Genomic Information.
DOI: 10.5220/0011635800003464
In Proceedings of the 18th International Conference on Evaluation of Novel Approaches to Software Engineering (ENASE 2023), pages 15-26
ISBN: 978-989-758-647-7; ISSN: 2184-4895
Copyright
c
2023 by SCITEPRESS – Science and Technology Publications, Lda. Under CC license (CC BY-NC-ND 4.0)
15

and desires, considering them during the entire design
process (Chilana et al., 2010).
HCD has been applied successfully in multiple
domains such as health services (Dopp et al., 2019),
education (dos Santos et al., 2019), or elder health
care (Bradwell et al., 2019), yet its use in genomics is
limited (Bolchini et al., 2009). Several authors have
studied the reasons causing this situation (Jaspers,
2009; Chilana et al., 2010; Pavelin et al., 2012;
de Matos et al., 2013). Their findings can be sum-
marized in the following points:
• Bioinformatics experts have historically relied on
command-line tools, and using HCD requires a
“cultural shift”.
• Bioinformatics data is highly complex and inter-
connected, and additional technical and scalabil-
ity constraints have to be considered. Besides, it is
a continuously evolving subject whose rules usu-
ally have plenty of exceptions.
• Using HCD techniques generates an initial delay
in the design process, and measuring the impact
of applying these techniques is a too fuzzy activ-
ity. HCD techniques improve scientific discovery
processes, but “discovery” is an intangible metric
and, therefore, difficult to measure.
• The prior knowledge needed to carry out HCD
techniques in this domain adequately (human-
computer interaction, bioinformatics, and com-
puting) creates a gap between domain users and
developers.
• The usability validation, crucial to provide suc-
cessful solutions, needs to be carried out by
skilled UI designers, which is not always possi-
ble.
• The most valued aspect of a tool is its novelty
rather than its associated HCD work, lessening
down usability and UI aspects.
Over the years, the use of HCD has slowly in-
creased, but its adoption is far from commonplace.
Some examples of tools developed following an HCD
approach are the following:
• Sutcliffe et al. developed ADVISES, a scenario-
based visualization tool to support epidemiologi-
cal research (Sutcliffe et al., 2010).
• Valentin et al. redesigned the EB-eye search ser-
vice using prototyping and storyboarding tech-
niques to analyze user tasks, and their domain
mental model (Valentin et al., 2010).
• Missier et al. developed Taverna, a tool to com-
pose and enact workflows for the bioinformatics
community (Missier et al., 2010).
• Rutherford et al. investigated how bioinfor-
maticians interact with existing tools to explore
large DNA sequences to improve their usability
(Rutherford et al., 2010).
• De Matos et al. applied HCD methods to cre-
ate the Enzyme Portal webpage (de Matos et al.,
2013).
• Ko et al. developed Closha, a workflow manage-
ment system oriented to the analysis of massive
genomics data (Ko et al., 2018).
• Recchia et al. designed a genetic report for cystic
fibrosis patients. (Recchia et al., 2021).
• Cutting et al. designed a panel report aimed at
easing clinicians’ work (Cutting et al., 2016).
To solve the existing usability problems, bioin-
formatics tools need to focus more on usability and
ease of use through high-quality UIs. However, the
use of HCD is far from typical. In this work, we
report how we followed a methodological HCD ap-
proach to design and develop an intuitive and easy-
to-use bioinformatics tool called Sibila. Sibila is a
conceptual model-based web platform for identifying
relevant DNA variations associated with genetic dis-
eases. We also validate the usability of Sibila with do-
main experts and discuss the benefits and drawbacks
of following such an HCD approach.
2 METHODS
This section describes the methods used to design and
develop Sibila, detailing how we followed an HCD
approach. The development process of Sibila relied
on five artifacts:
• ISO 9241-210:2019 (Standardization, 2019):
(“Ergonomics of human-system interaction —
Part 210: Human-centred design for interactive
systems”) defines a set of standardized principles
for applying HCD.
• The Conceptual Schema of the Genome (CSG)
(Garc
´
ıa S. et al., 2021b): is a model that rep-
resents human genomics and its inner workings
from a holistic perspective, integrating several di-
mensions. It is the ontological framework used to
understand the working domain and communicate
with domain experts effectively. This schema also
guided the development of Sibila.
• The Concur Task Tree (CTT) Notation (Pa-
tern
`
o, 2003): is a formal abstraction that links
user interfaces with the task necessary to accom-
ENASE 2023 - 18th International Conference on Evaluation of Novel Approaches to Software Engineering
16

Table 1: The list of activities carried out during each phase.
Phase Input Activity Output
Specification of
Context of use
— (1) Focus group Users’ context of use.
CSG (2) Conceptual view
generation
A conceptual view from the CSG.
Specification of
user requirements
Output of (1) (3) CTT generation CTT to be validated.
Output of (3) and (1) (4) CTT validation CTT validated.
Output of (4) and (2) (5) CTT Mapping CTT mapped to the conceptual view.
Design of Pro-
posed Solution
Output of (5) (6) Architectural design UI design and navigation flow.
Output of (5) and (6) (7) Structural design Internal structure of each UI.
Output of (5) and (7) (8) Content design UI patterns that compose each UI.
Output of (5) and (8) (9) Refinement Conceptual Design.
Output of (5) and (9) (10) Implementation Implemented solution.
Evaluate Pro-
posed Solution
Output of (10) (11) Validation Validated solution.
plish user goals.
1
• The GenomIUm Method (I
˜
niguez-Jarrin, 2019):
is a guideline that provides a systematic approach
to designing and implementing UIs for working
with genomics data. It offers a set of design pat-
terns that support the process.
• Technology Acceptance Model (TAM) (Davis,
1989): is an information systems theory used to
model how users accept and use a given technol-
ogy.
The development of Sicila followed the four steps
defined by the ISO 9241-210:2019 (see Table 1 for a
detailed list of activities):
1. Understand and Specify the Context of Use: In
this step, we identify and study the users, their
goals, and the tasks they will perform when us-
ing the system. The CSG is used to understand
and precisely characterize the working domain in
this phase and eases communication between de-
velopers and domain users.
2. Specify User Requirements: The identification of
user needs and requirements is carried out in this
phase. We used the CTT formalism to better cap-
ture and describe the specific tasks identified in
the previous step that users aim to perform when
using Sibila.
3. Produce Design Solutions: The Design and im-
plementation of Sibila are performed in this
1
The specific notation of Concur Task Trees can be
found in https://www.w3.org/2012/02/ctt/
phase. We carry out this process following the
design process described by GenomIUm. We use
the CSG to support the process by mapping data
attributes to the specific patterns of the UIs.
4. Evaluate Design Against User Requirements: Fi-
nally, we test Sibila against user goals. In this
step, we conducted a TAM-based experiment in
which we measured two metrics: Perceived Ease
of Use (PEOU) and Perceived Usefulness (PU).
3 THE TOOL
In this section, we report how the four phases defined
in the previous section have been carried out to design
and develop Sibila.
3.1 Specification of Context of Use
3.1.1 Focus Group
To specify the context of use and discover the user
expectations from the system, we organized several
focus groups over four months with domain experts
to understand in what contexts they would use Sibila.
Sixteen virtual meetings (one per week) and four face-
to-face meetings (one per month) were carried out.
After that, we determined their context of use. This
context can be summarized as a need to find rele-
vant variations in the context of precision medicine
(i.e., based on a phenotype or gene of interest, iden-
Human-Centered Design for the Efficient Management of Smart Genomic Information
17

tify what variations play a key role in both phenotype
expression and gene functionality).
3.1.2 Conceptual View Generation
The next step consisted of creating a conceptual view
(i.e., a subset of elements) of the CSG tailored to the
context of use specified before by means of the ISGE
method (Garc
´
ıa S. et al., 2021a)
2
. Since the CSG pro-
vides a broad, holistic perspective of the genome, it
might contain too much information when applied to
real-world use cases that focus on a specific domain
dimension. Thus, adopting the CSG in real-world use
cases can be more efficient and straightforward if we
only consider those concepts and relationships that
are relevant to that use case in particular.
We started by presenting the CSG to the domain
users. Then, all together generated a conceptual view
of the CSG with the most relevant concepts tailored to
Sibila’s functionality, which we called CSG-Sibila.
These view offered multiple advantages: i) it im-
proved the communication between the final users
and us, ii) it provided a common framework of knowl-
edge for discussion, and iii) it eased data integration.
Fig. 1 shows the resulting conceptual view, which
reduced the number of considered concepts from 60
to 11. Such a reduction in the number of concepts in-
dicated that the working context is significantly nar-
rowed. For instance, no information regarding bio-
logical pathways was selected.
In the CSG-Sibila, the central and most important
concept is the VARIATION, identified by an id and a
name. A variation consists of a change in our DNA
sequence. It is characterized by the reference and al-
ternative alleles (i.e., the value in the DNA sequence
of humans considered “correct” and the altered one
respectively), its type, and the last time it was stud-
ied. Each variation can have a set of HGVS EXPRES-
SIONS (i.e., The HGVS expressions is a way of rep-
resenting DNA variations following a standard pro-
vided by the HUman Genome Organisation (HUGO)
and a set of EXTERNAL ITEMS (i.e., are the appear-
ances of the variation in external data sources). The
EXTERNAL ITEM contains the name, the URL, and the
variation’s specific identifier in a specific data source.
DNA VARIATIONS are located in a specific region
of the DNA sequence. The CSG Sibila represents
the location of VARIATIONS by means of three ap-
praoches. First, the CHROMOSOME where the vari-
ation is located. Second, the set of GENES altered by
2
The ISGE method allows for generating more narrow
conceptual schemes, called conceptual views, from a more
general one. These conceptual views are tailored to a spe-
cific use context and ease the adoption of conceptual model-
based techniques.
the variation. Third, the specific POSITION in the full
genome sequence where the variation is located. In
some cases, the GENES and the specific POSITION of
a VARIATION can be unknown.
The study of VARIATIONS is relevant because
they are known to be responsible for genetic dis-
eases. The extent to which a VARIATION is responsi-
ble for a genetic disease is known as clinical impact.
VARIATIONS are associated with PHENOTYPES (i.e.,
genetic diseases) through a set of clinical SIGNIFI-
CANCES. A significance indicates the pathogenicity
established between a VARIATION and a PHENOTYPE
(e.g., pathogenic, benign, risk factor, etc) and the ev-
idence that supports such assertion (i.e., the method
and the criteria). The ACTIONABILITY concept is
defined as an aggregate calculated from the differ-
ent SIGNIFICANCES of a VARIATION for a PHENO-
TYPE. An ACTIONABILITY is characterized by the
specific clinical actionability (i.e., disease-causing or
not disease-causing) and the level of evidence used
for such a classification (i.e., strong evidence, mod-
erated evidence, limited evidence, or to follow up).
Finally, each VARIATION can contain PHENOTYPE-
related BIBLIOGRAPHY.
3.2 Specification of User Requirements
3.2.1 Concur Task Tree Generation
After collecting the initial information, we comple-
mented it by proposing a task-workflow to be imple-
mented in Sibila based on the previously identified
domain users’ needs. This workflow was revised with
domain experts, being polished in multiple iterations
until they approved it. As a result, we improved our
understanding of their mental model and generated
Sibila’s task model.
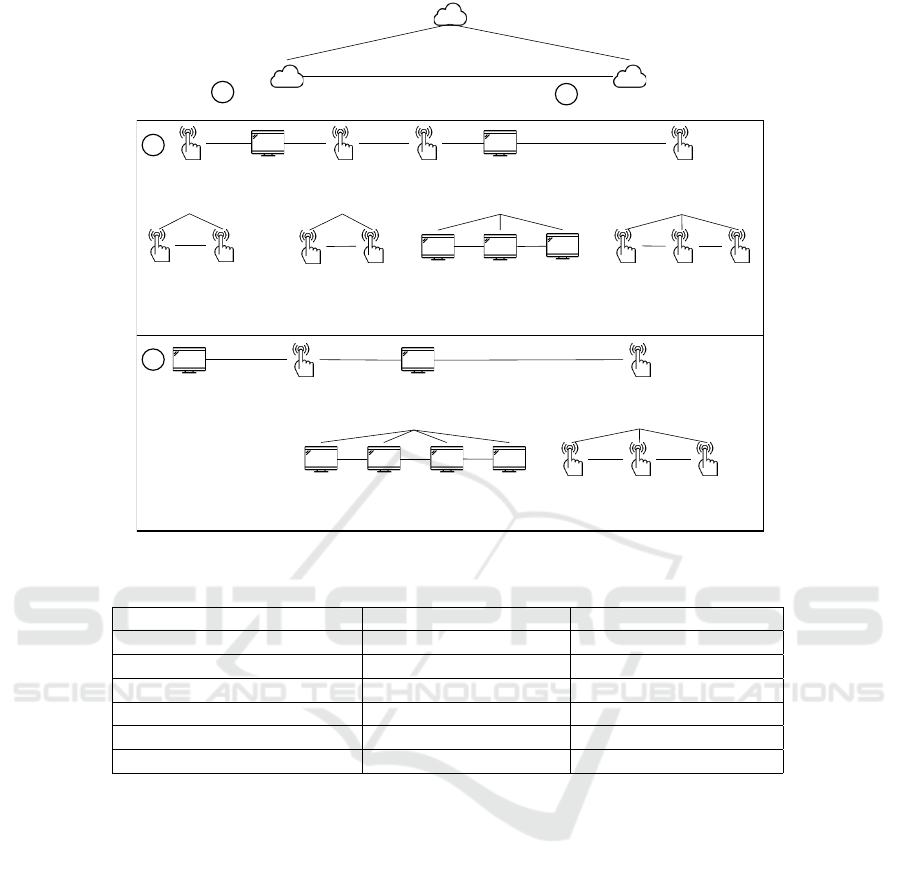
We consolidated the task model of the envisioned
system using the CTT notation (see Fig. 2). The CTT
notation offer several advantages: i) it focuses on the
activities that users aim to perform; ii) it provides a hi-
erarchical structure with a wide range of granularity;
iii) it offers a graphical syntax that is easy to interpret;
iv) it defines temporal relationships between tasks.
There are three types of tasks in the CTT nota-
tion. The system task defines tasks that do not require
user interaction (e.g., displaying data) and is depicted
with a monitor. The interaction task defines tasks that
require user interaction (e.g., filling out a form) and
is depicted with a hand. Finally, the abstract task de-
fines higher-level tasks that are decomposed into other
tasks, including abstract, system, or interaction tasks;
this last task is depicted with a cloud.
ENASE 2023 - 18th International Conference on Evaluation of Novel Approaches to Software Engineering
18
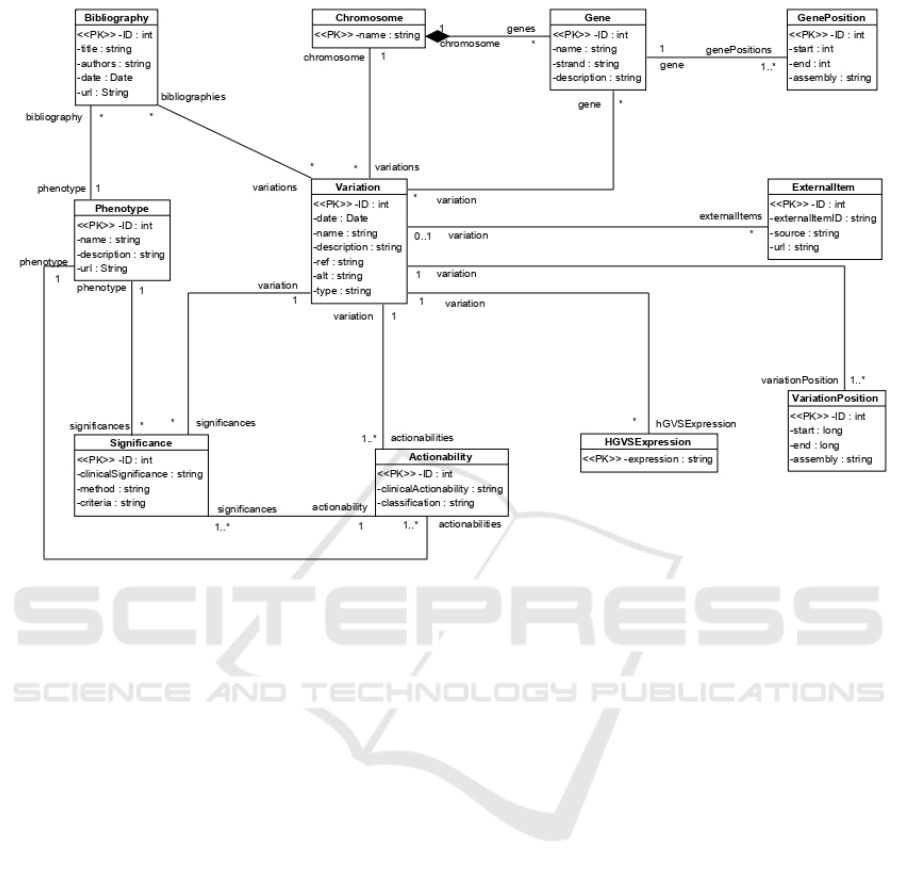
Figure 1: Sibila’s Conceptual view of the CSG.
3.2.2 Concur Task Tree Validation
To validate the CTT (see Fig 2), we mapped the
gathered requirements and needs to the tasks of the
CTT. Then, we discussed such mappings with domain
users, who agreed that the CTT captured their work-
flow appropriately. The validated CTT is composed
of 30 tasks that are distributed in a four-level hierar-
chy.
3.2.3 Concur Task Tree Mapping
After validating the CTT, we mapped its tasks to the
corresponding entities of the CSG-Sibila, which al-
lowed us to better identify the task’s idiosyncrasy and
connect UI requirements to specific data attributes.
Also, it allowed us to determine the complexity of the
tasks: the more entities, the more complex a task is
expected to be. It also facilitated the selection of the
most appropriate design patterns to display and inter-
act with the data.
3.3 Design of the Proposed Solution
After defining the context of use and identifying
user requirements, the proposed solution can be de-
signed. We focused on transforming the tasks de-
fined in the CTT into a tangible UI design. This
task was supported by the GenomIUm method, a
Pattern-Oriented Design (POD) method developed
by I
˜
niguez-Jarrin that provides solutions for the ge-
nomics domain (I
˜
niguez-Jarrin, 2019).
GenomIUm provides a systematic design process
and a catalog of interconnected patterns to support it.
The catalog divides patterns into four categories, one
per design process step. Some patterns cover gen-
eral design problems (i.e., navigation and component
distribution), while others have domain-specific de-
sign problems (i.e., genomics data visualization). The
POD approach offers the advantages of using proven
solutions to common user problems in many different
contexts (Javahery et al., 2004).
The GenomIUm systematic design process is
composed of four steps:
1. Architectural Design. The high-level design of
the UI and the navigation flow is performed in
this step. The architectural design is supported by
information architecture patterns, which describe
system-wide solutions to organize the content to
display and establish their interconnections.
2. Structural Design. In this step, the internal struc-
ture of each UI defined in the architectural design
is performed. The structural design is supported
by page patterns, which describe the components
that structure presentation units.
Human-Centered Design for the Efficient Management of Smart Genomic Information
19
Explore data
(0)
[]
Explore variations
(10)
Explore phenotypes
(11)
2
2
Filter
Variations
(20)
Visualize
Variations
(21)
[Edit
visualization*]
(22)
[Select a
variation]
(23)
Visualize
Variation
(24)
[Navigate to variation
detail info*]
(25)
[]>>
|=|
|=|
[]>>
>>
[Select
genes]
(30)
[Select
phenotypes]
(31)
|||
[Filter*]
(32)
[Order*]
(33)
|=| |=| |=|
Details
(34)
Affected
Phenotypes
(35)
External
Sources
(36)
[To
phenotypes*]
(37)
[To
Biblio
graphy*]
(39)
[To
External
sources]
(38)
|=| |=|
Visualize
Phenotypes
(26)
Select a
Phenotype
(27)
Visualize
Phenotype
(28)
[Navigate to phenotype
detail info*]
(29)
>>
[]>>
>>
|=||=||=||=|
[]>>
[to
variants*]
(314)
[to
variant]
(315)
[To External
sources]
(316)
Details
(310)
Affected
genes
(311)
Affected
variants
(312)
External
sources
(313)
1
1
Figure 2: Generated Concur Task Tree. The ID of each task is depicted between brackets.
Table 2: Defined functional user interfaces.
Functional UI Interaction task ID(s) Application task ID(s)
Home (H) - -
Filter variations (FVS) 20, 30,31 -
Visualize variations (VVS) 22, 23, 32, 33 21
Visualize variation (VV) 25, 37, 38, 39 24, 34, 35, 36
Visualize phenotypes (VPS) 27 26
Visualize phenotype (VP) 29, 314, 315, 316 28, 310, 311, 312, 313
3. Content Design. The selection of the patterns
that conform to the internal structure of eahc UI
is performed in this step, which is supported by
navigational and content patterns that describe the
content components. The objective of these pat-
terns is to allow users to perform a specific set of
tasks identified in the CTT.
4. Refinement. The visual details of each pattern
are specified in this step. This step is required
because, since design patterns provide general UI
design solutions, they have to be adapted to the
particularities of the use case.
3.3.1 Architectural Design
In the architectural design step, the goal is to define
the UI design of Sibila, which we divided into two
steps, namely, the definition of the functional UIs (i.e.,
a UI that implements a set of user tasks) and the nav-
igation among them. We defined the functional UIs
by means of a card sorting exercise and a tree test.
In the card sorting exercise, we provided five domain
users with 27 paper cards (i.e., one per non-abstract
CTT activity) and asked them to group these cards in
a card sorting exercise. Then, we generated a cor-
relation matrix and performed correlation clustering
to calculate the appropriate number of functional UIs
that Sibila should have (see Fig. 3).
As a result, six functional UIs were proposed and
discussed with those domain users that performed the
card sorting exercise. Table 2 shows the resulting
functional UIs, their proposed names, and the tasks
of the CTT they group. This aggregation of tasks into
functional UIs is used to identify the most appropriate
patterns in the following steps.
In the tree test, we provided those domain users
that did not perform the card sorting exercise with
a five-category tree (one per functional UI obtained
ENASE 2023 - 18th International Conference on Evaluation of Novel Approaches to Software Engineering
20
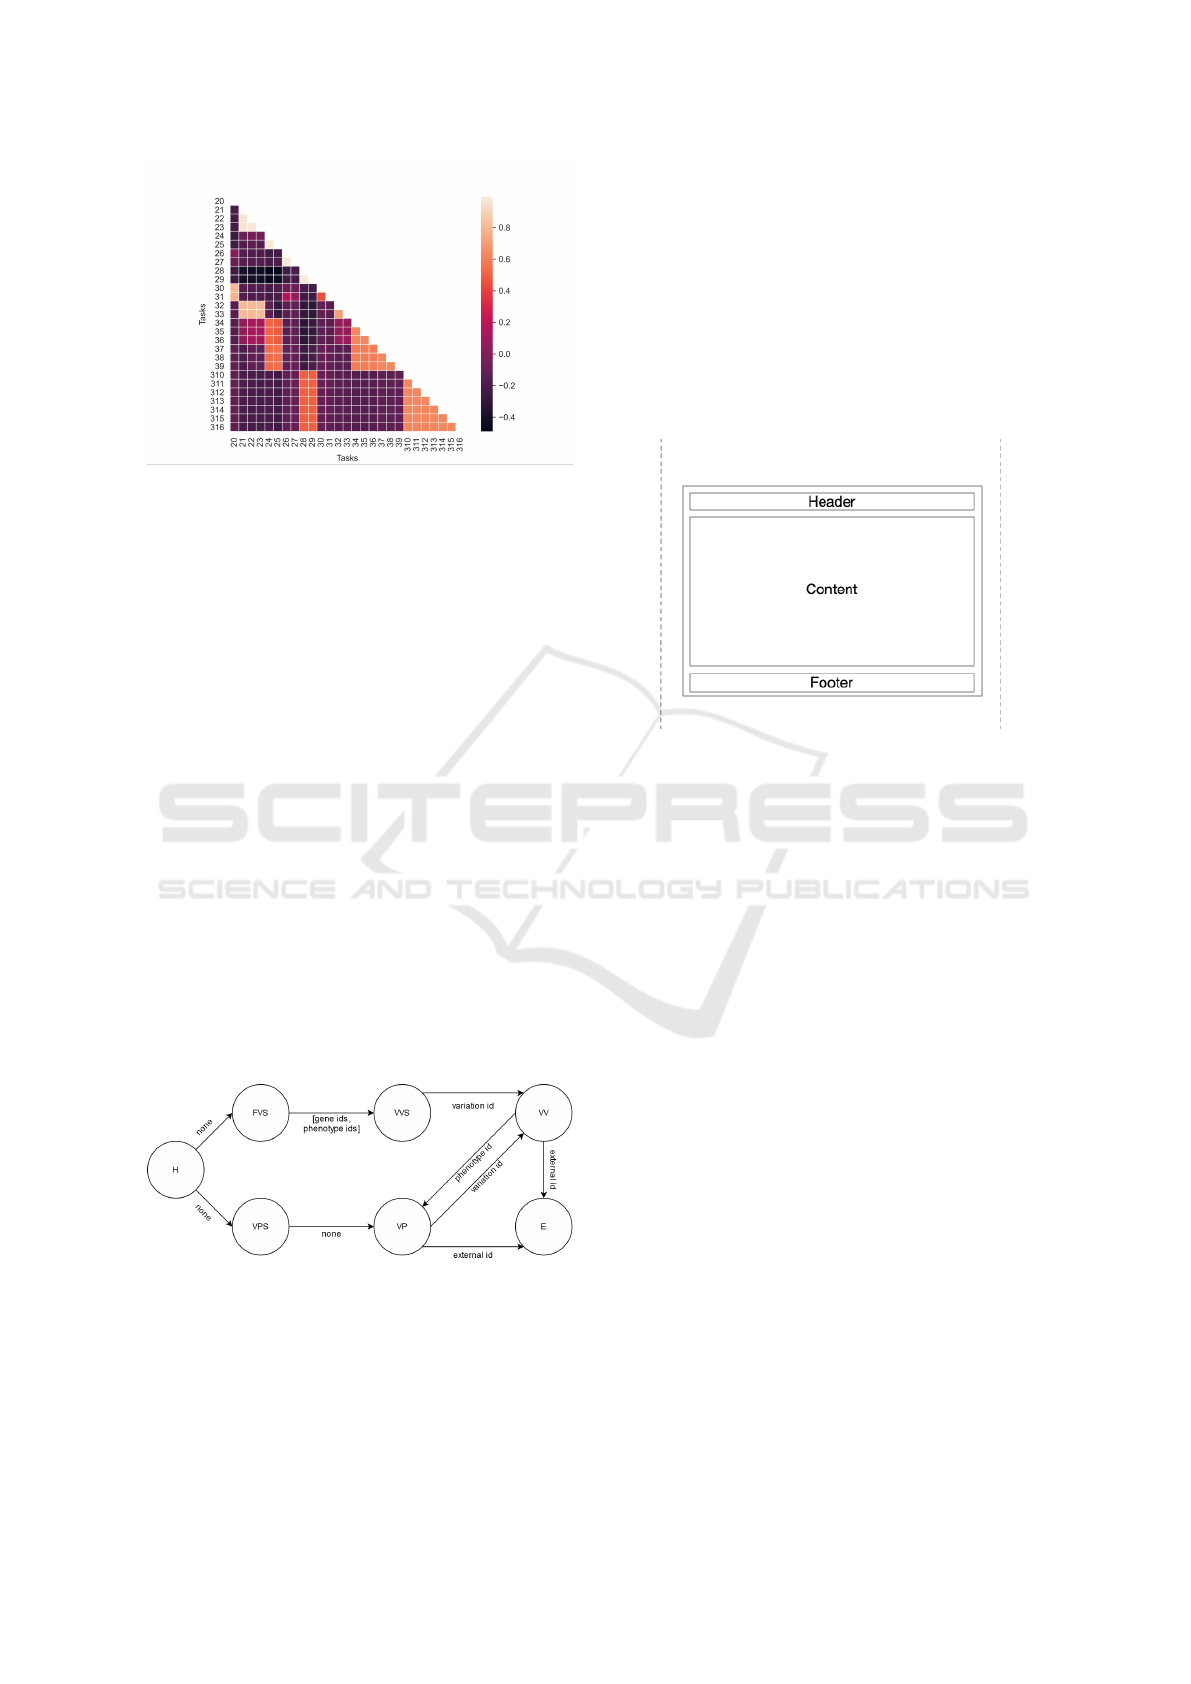
Figure 3: Correlation matrix with the identified tasks.
from the first exercise) and a set of ten random CTT
tasks. We asked them to locate each CTT task into
one tree item. After that, we compared the results
with the group obtained in the first exercise, getting
100% accuracy. This means that users from the tree
testing exercise grouped the CTT tasks the same way
as users from the card sorting exercise, which indi-
cates that the proposed functional UIs are appropriate
and intuitive.
For defining the navigation among functional UIs,
we connected them based on the hierarchical compo-
sition and temporal operators of the validated CTT.
We also included the data required for navigating
from one functional UI to another. For instance, to
navigate from the “visualize variations” UI to the “vi-
sualize variation” UI, a variation identifier must be se-
lected. Fig. 4 shows the defined navigation between
the functional UIs. We represented it using a directed
graph (DG) since it offers an intuitive representation
of navigation between UIs. Apart from the navigation
shown in Fig. 4, every functional UI can navigate to
the Home UI because they contain a header. The DG
was discussed and validated with domain users in a
workshop.
Figure 4: Directed graph representing Sibila’s navigation.
Additional notes: the “E” node (external) is used to repre-
sent navigation to an external UI; edges are annotated with
the data needed to perform the navigation; annotated edges
with brackets indicate that data is optional; the topbar’s nav-
igation is not represented. H, FVS, VPS, VVS, VP, and VV
correspond to identifiers that can be found in Table 2.
3.3.2 Structural Design
In the structural design step, the internal structure of
the identified functional UIs is defined. We used the
Conceptual Framework Pattern, which promotes de-
signing UIs with the same layout. This layout con-
sisted of three independent sectors: a header contain-
ing the basic navigational functionality, a body con-
taining the components and patterns needed to per-
form the tasks, and a footer (see Fig. 5).
Figure 5: The internal structure of the UIs from Sibila.
3.3.3 Content Design
In the content design step, the goal is to select the
visualization patterns that compose the internal struc-
ture of each functional UI. The Filter variation (FV),
Visualize variations (VVS), Visualize variation (VV),
Visualize phenotypes (VPS), and Visualize phenotype
(VP) UIs have a topbar, a body, and a footer. Regard-
ing the topbar, we selected the Home Link pattern
(Toxboe, 2007). This pattern is a navigation pattern
that allows users to go back to the starting location
(i.e., the Home UI). The content displayed in the func-
tional UIs (i.e., in the body) is organized following
the Card, and the Chunking pattern (Toxboe, 2007),
which eases data visualization. On the one hand, the
card pattern homogenizes the visualization of content
that is heterogeneous; on the other hand, the chunk
pattern groups information into smaller knowledge
units that are processed and remembered more easily.
Unlike the rest of the functional UIs, we used the
reduction pattern (Toxboe, 2007) for designing the
Home (H) UI. This memory and perception pattern
reduces complex behavior to simple tasks, increasing
user performance. We selected this pattern because
domain users stated that they want to start performing
their tasks as fast as possible. They also stated that
in order to increase Sibila’s adoption, the initial per-
ception of complexity should be as little as possible.
Therefore, we simplified the design of the Home UI
Human-Centered Design for the Efficient Management of Smart Genomic Information
21

Table 3: Selected patterns in the design of the CD of the SIBILA UI. CTT task 34 corresponds to Details, 35 corresponds to
Affected Phenotypes, and 36 to External Sources.
ID Pattern Applied to CTT Task(s) Entity Attribute
1 Card
Display the name and date of the
variation
34 Variation* name*, date*
2 Card
Display the rest of the variation
information
34, 35, 36 - -
3 Module tabs
Separate the 34, 35, and 36 CTT
tasks into sections that can be
accessed using flat navigation
34, 35, 36 - -
4 Chunking
Group the general information of a
variation
34
Variation* ref, alt, type*
Chromosome[]* ID*
VariationPosition[] assembly*,start*, end*
Gene[] name*
5 Chunking
Group the HGVS expressions of a
variation
34 HGVS Expression[] expression*
6 Tagging
Label the clinical actionability and
classification of a variation for a
phenotype.
35 Actionability[]*
clinicalActionability*,
classification*
7 Chunking
Group the information of a
phenotype. Contains 6, 8, and 9
patterns
35 Phenotype[]* name*
8 Chunking
Group the clinical significance of a
variation in a phenotype
35 Significance[]*
clinicalSignificance*,
method*, criteria*
9 Chunking
Group the bibliography of a
variation in a phenotype
35 Bibliography[]*
title*, authors*,
date*, url*
10 Chunking
Group the references of a variation
in external datasources
36 ExternalItem[]* ID*, source*, url*
to its minimal expression. As a result, users only have
two options to explore when they access Sibila: DNA
variations or phenotypes.
This step was iterated until domain users con-
firmed that the functional UIs met their needs and re-
quirements. The UIs have been designed using six-
teen visualization patterns: alternating row color, au-
tocomplete, cards, chart, chunking, genome browser,
genomic filter, ideogram, module tabs, pagination,
problem summary, rule builder, search, selector of re-
gions, sort by column, and tagging. Each of these
patterns have being instantiated ultiple times accross
the different UIs.
To illustrate how we carried out this step, we show
the selected patterns and the resulting Conceptual De-
sign (CD) of the Visualize Phenotype (VP) functional
UI. Table 3 shows the selected patterns for the VP UI,
their purpose, and the entities of the CSG whose data
is displayed. Fig. 6 shows the resulting CD of the VP
UI.
3.3.4 Refinement
In the refinement step, the patterns selected in the pre-
vious step are adapted to the specific particularities
of both the data to be displayed and the working use
case. The following design decisions were made in
this step:
• We selected the design guidelines used to imple-
ment the patterns. We followed the design prin-
ciples proposed by Google’s Material
3
theme to
build a consistent, high-quality UI.
• We mapped each pattern to the attributes of the
CSG that will display using pseudo code. For in-
stance, the pattern with ID 5 displays the expres-
sion attribute of each HGVSEXPRESSION asso-
ciated with the selected variations (see Table 3).
• We defined a set of reusable layouts to determine
how pattern data should be displayed. For in-
stance, the pattern with ID 5 should display each
HGVS expression by using a chip (i.e., a compact
rectangle with rounded borders to represent small
chunks of data) with an outlined style and a back-
ground following the primary color of the palette
defined for Sibila.
• We designed the logo, the color palette, and the
color of the links when user hovers them.
3.3.5 Implementation
Finally, we have implemented Sibila using three-tier
architecture. For the database, we used PostgreSQL,
the backend consists of a node.js server, and the fron-
3
https://material.io/design
ENASE 2023 - 18th International Conference on Evaluation of Novel Approaches to Software Engineering
22
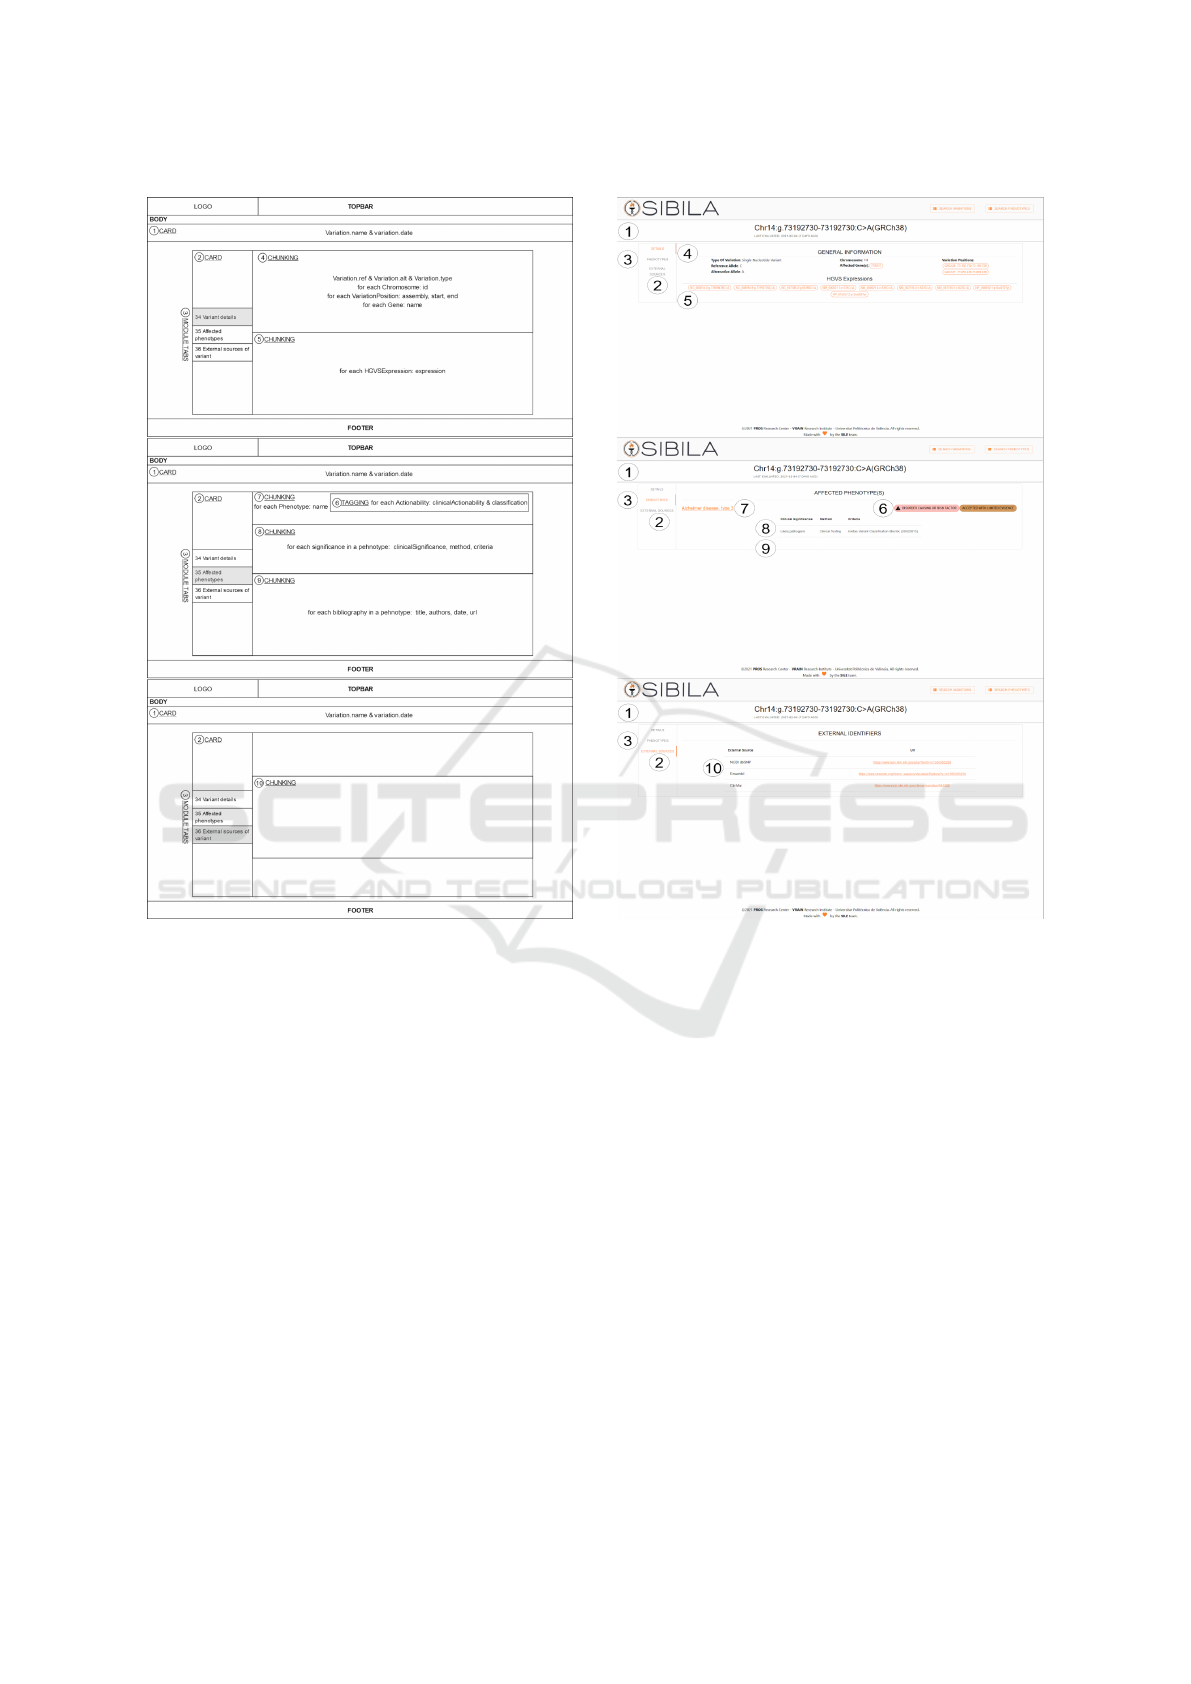
Figure 6: Conceptual design of the VP UI.
tend is implemented with JavaScript and the React
framework.
The communication between the database and the
backend uses the knx.js query builder library while
the communication between the backend and the fron-
tend uses the GraphQL query language.
To illustrate, Fig. 7 shows the final implementa-
tion of the Visualize Phenotype (VP) UI.
3.4 Evaluate Proposed Solution
3.4.1 Validation
To validate Sibila, we used the Technology Accep-
tance Model (TAM). TAM identifies two perception-
based variables, namely Perceived Ease Of Use
(PEOU) and Perceived Usefulness (PU) (Davis,
1989):
• PEOU: the degree to which users believe that us-
ing Sibila would be free from effort.
Figure 7: The final implementation of the VP UI, which is
divided into three tabs. Please note that, since this variation
has no associated bibliography, pattern 9 is not instantiated.
• PU: the degree to which a person believes that us-
ing Sibila would enhance job performance.
The validation was designed by the ten domain
experts involved in the design of Sibila. The do-
main experts prepared two experiments covering all
CTT tasks. The first focused on exploring varia-
tions, while the other focused on exploring pheno-
types. Then, the validation was conducted by a group
of ten computer scientists with genomics expertise.
They were divided into two groups of 5 members,
and each group performed one of the prepared experi-
ments. After that, they filled out a survey with twelve
items for measuring the two TAM variables (see Ta-
ble 4). The survey items were formulated using a 5-
point Likert scale, ranging from 1 (strongly disagree)
to 5 (strongly agree), using the opposing-statement
question format. Besides, the item order was random-
ized, and half of the questions were negated to avoid
Human-Centered Design for the Efficient Management of Smart Genomic Information
23
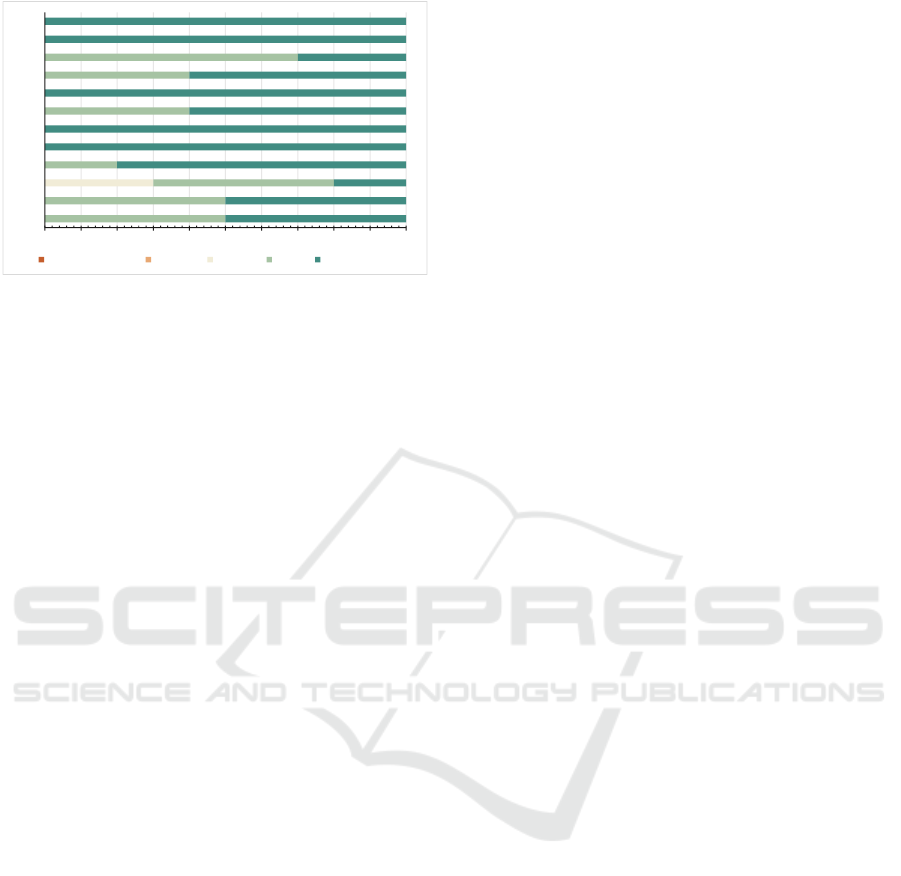
0% 10% 20% 30% 40% 50% 60% 70% 80% 90% 100%
PEOU 1
PEOU 2
PEOU 3
PEOU 4
PEOU 5
PEOU 6
PU1
PU2
PU3
PU4
PU5
PU6
STRONGLY DISAGREE DISAGREE NEUTRAL AGREE STRONGLY AGREE
Figure 8: The validation results.
monotonous responses.
PEOU and PU were calculated as the average of
the responses obtained from the survey. PEOU was
calculated with questions PEOU1 to PEOU6, while
PU was calculated with questions PU1 to PU6. The
PEOU scored 4.62 out of 5, and the PU scored 4.75
out of 5 (see Fig. 8).
4 DISCUSSION
We applied an HCD approach to design a bioinfor-
matics tool called Sibila. The aim of this tool is to
help domain users discover relevant and high-quality
variations affecting specific phenotypes or genes of
interest. This discovery process is complex and error-
prone because domain users must face a vast amount
of genomics data, some of which fail to achieve the
minimum quality standards. Consequently, the relia-
bility of the data decreases.
Following an HCD approach allowed us to focus
on domain user needs instead of on our assumptions,
which led us to gather more realistic and correct user
requirements. In addition, users’ feedback was col-
lected during the development process rather than just
at the end.
Applying HCD in genomics led to a more com-
plex design and implementation, and it required addi-
tional efforts compared to its application in other do-
mains. Multiple challenges have been faced, includ-
ing the high degree of heterogeneity of genomics data
and the lack of solid and shared domain knowledge
originated from vague and often ambiguous defini-
tions. We could overcome this challenges through the
use of CM techniques. An additional relevant chal-
lenge was data visualization. There are style guides
to visualize data, but there is little literature regarding
the best way to visualize genomics data. For instance,
there are notable differences in how genomics portals
display their data, even though they target the same
audience. However, some common visualization pat-
terns exist, and GenomIUm allowed us to identify and
integrate them into the Sibila UI.
The definition of domain-specific concepts and
workflows are required to elicit a platform’s require-
ments, but the most elemental domain concepts are
still open to discussion in genomics (Pearson, 2006).
With regard to this, we have found that the use of CM
has been extremely helpful. CM offered us several
benefits and improved the outcomes of an HCD ap-
proach:
• The use of CM forced domain users to make
their implicit knowledge explicit, which generated
fruitful discussions about the dimensions associ-
ated with core definitions that otherwise would
have remained hidden in domain experts’ minds.
These discussions are relevant because we found
that it is not uncommon for the same concept to
be interpreted differently by domain users. Hav-
ing these discussions solved allowed domain users
to communicate more effectively.
• We detected that the initial gap of knowledge
between domain users and us was reduced after
starting to work with the CSG as it provided a
common framework to discuss in order to get a
shared understanding of the domain under inves-
tigation.
• We were able to perform a more efficient mapping
between the data and the UIs, easing integration.
• We could plan the tool’s implementation better
as CM allowed us to classify each pattern and
UI complexity based on the mapping carried out.
CM has been integral to the development of our
work. Sibila is grounded in the CSG, and most
of the HCD exercises we conducted, such as fo-
cus groups or card sorting, were enriched using
the CSG. Additionally, GenomIUm is a pattern-
oriented solution designed following a CM ap-
proach also.
Another benefit of HCD was increasing teamwork
and collaboration between developers and domain
experts since they were involved in all of the pre-
implementation activities. Thus, we delivered a better
user experience and found that some of our assump-
tions regarding how domain users carry out their tasks
were incorrect. For instance, we initially considered a
different distribution of the data associated with vari-
ations (i.e., including phenotype information on the
main page of the variation). However, users preferred
a different approach (i.e., an independent section with
additional information about the phenotype).
We found that following an HCD approach in-
creased the complexity of the development because
ENASE 2023 - 18th International Conference on Evaluation of Novel Approaches to Software Engineering
24
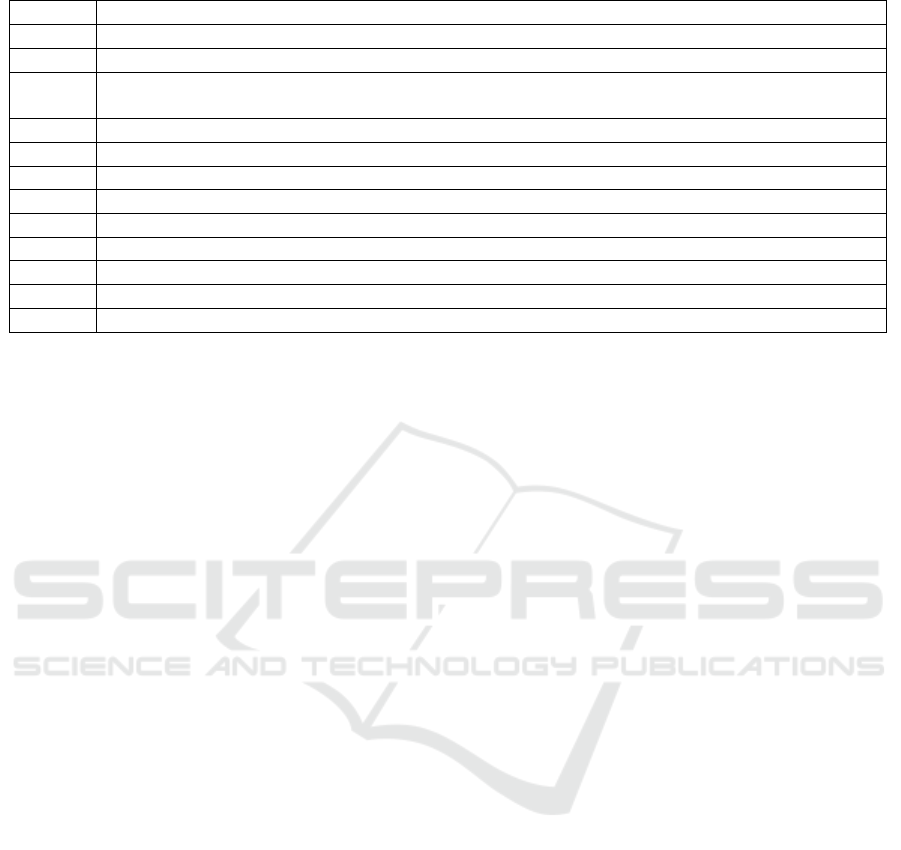
Table 4: Validation activity questions.
Item Statement
PEOU1 I believe that it is easy to explore the data and retrieve relevant information
PEOU2 I found it easy to filter variations.
PEOU3 I believe that the displayed information regarding variations and phenotypes is adequate and
sufficient
PEOU4 I think that the way the data is visualized is useful.
PEOU5 In general, I found Sibila intuitive.
PEOU6 In general, I found Sibila easy to use.
PU1 I believe that the displayed information is clear, concise, and unambiguous.
PU2 I believe that Sibila would reduce the time and effort required to perform my work.
PU3 I believe that Sibila offers an effective solution to visualize variations.
PU4 I believe that Sibila offers an effective solution to explore and exploit variations’ information.
PU5 In general, I think that Sibila would ease my work.
PU6 In general, I think that Sibila is a useful tool.
there was an initial delay that originated from eliciting
user requirements prior to implementation. Besides,
domain users were initially reluctant to discuss using
a CS as a communication tool. This situation delayed
even more user elicitation of requirements because we
had to teach domain users the basics of CM and how
to interpret a CS.
Despite all of this, an HCD approach delivered
UIs perceived by users as easy to use and use-
ful. Also, supporting our process with a conceptual
schema led to more efficient and effective communi-
cation and domain conceptualization.
5 CONCLUSIONS
The correct design of UIs is crucial to managing
data correctly and extracting knowledge efficiently.
A well-designed UI can significantly impact the per-
formance of these tasks (i.e., data management and
knowledge extraction). In general, genomic tools are
unintuitive and complex. Multiple reasons are behind
this, but the immediate consequence is that learning to
use these tools is difficult and tedious, reducing their
adoption by domain experts.
Our work towards applying HCD techniques em-
phasizes the need for a systematic approach to tackle
this problem by showing how it can help design us-
able UIs. Besides, complementing HCD techniques
with the support of a pattern-based method (i.e.,
GenomIUm) to design the UIs provides significant
benefits. On the one hand, HCD allows research users
and better specify their needs and goals. On the other
hand, composing the UIs with widely used and known
patterns eases the adoption of genomics tools and fa-
cilitates domain users’ work.
Future work will provide a broader, empirical val-
idation by comparing Sibila to other known genomic
portals like ClinVar (Stephens et al., 2015) and En-
sembl (Hunt et al., ). This validation will measure
the increase in the user’s performance when using a
pattern-based tool designed using an HCD approach.
ACKNOWLEDGEMENTS
This work was supported by the Valencian Inno-
vation Agency and Innovation through the OG-
MIOS project (INNEST/2021/57), the General-
itat Valenciana through the CoMoDiD project
(CIPROM/2021/023), and the Spanish State Re-
search Agency through the DELFOS (PDC2021-
121243-I00) and SREC (PID2021-123824OB-I00)
projects, MICIN/AEI/10.13039/501 100011033 and
co-financed with ERDF and the European Union Next
Generation EU/PRTR. This work also had the support
of the ACIF/2021/117 grant.
REFERENCES
Bolchini, D. et al. (2009). Better bioinformatics through
usability analysis. Bioinformatics, 25(3):406–412.
ISBN: 1367-4803.
Bradwell, H. L. et al. (2019). Companion robots for older
people: importance of user-centred design demon-
strated through observations and focus groups com-
paring preferences of older people and roboticists in
South West England. BMJ Open, 9(9):e032468.
Carpenter, A. E. et al. (2012). A call for bioimaging soft-
ware usability, volume 9. NIH Public Access. ISSN:
15487091 Publication Title: Nature Methods.
Chilana, P. K. et al. (2010). Understanding usability prac-
tices in complex domains. In Conference on Human
Factors in Computing Systems - Proceedings, vol-
Human-Centered Design for the Efficient Management of Smart Genomic Information
25

ume 4, pages 2337–2346, New York, New York, USA.
ACM Press.
Cutting, E. et al. (2016). User-centered design of multi-gene
sequencing panel reports for clinicians. 63:1–10.
Davis, F. D. (1989). Perceived Usefulness, Perceived Ease
of Use, and User Acceptance of Information Technol-
ogy. MIS Quarterly, 13(3):319.
de Matos, P. et al. (2013). The Enzyme Portal: A case study
in applying user-centred design methods in bioinfor-
matics. BMC Bioinformatics, 14. Publisher: BMC
Bioinformatics.
Dopp, A. R. et al. (2019). Integrating implementation and
user-centred design strategies to enhance the impact
of health services: protocol from a concept mapping
study. Health research policy and systems, 17(1):1–
11. Publisher: Springer.
dos Santos, F. A. et al. (2019). Graphic design and user-
centred design: designing learning tools for primary
school. International Journal of Technology and De-
sign Education, 29(5):999–1009.
Garc
´
ıa S., A. et al. (2021a). ISGE: A conceptual model-
based method to correctly manage genome data. In
Nurcan, S. and Korthaus, A., editors, Intelligent In-
formation Systems - CAiSE Forum 2021, Melbourne,
VIC, Australia, June 28 - July 2, 2021, Proceedings,
volume 424 of Lecture Notes in Business Information
Processing, pages 47–54. Springer.
Garc
´
ıa S., A., Palacio, A. L., Rom
´
an, J. F. R., Casamayor,
J. C., and Pastor, O. (2021b). A conceptual model-
based approach to improve the representation and
management of omics data in precision medicine.
IEEE Access, 9:154071–154085.
Hunt, S. E. et al. Ensembl variation resources. 2018.
I
˜
niguez-Jarrin, C. (2019). GenomIUm: A Pattern Based
Method for Designing User Interfaces for Genomic
Data Access. PhD Thesis, Universitat Polit
`
ecnica de
Val
`
encia.
Jaspers, M. W. (2009). A comparison of usability methods
for testing interactive health technologies: Method-
ological aspects and empirical evidence. International
Journal of Medical Informatics, 78(5):340–353. Pub-
lisher: Elsevier.
Javahery, H. et al. (2004). Beyond Power: Making
Bioinformatics Tools User-centered. Commun. ACM,
47(11):58–63. Place: New York, NY, USA Publisher:
ACM.
Ko, G. H. et al. (2018). Closha: bioinformatics workflow
system for the analysis of massive sequencing data.
BMC bioinformatics, 19:43.
Missier, P. et al. (2010). Taverna, reloaded. In Lecture
Notes in Computer Science (including subseries Lec-
ture Notes in Artificial Intelligence and Lecture Notes
in Bioinformatics), volume 6187 LNCS, pages 471–
481. Springer, Berlin, Heidelberg. ISSN: 03029743.
Patern
`
o, F. (2003). ConcurTaskTrees: An Engineered No-
tation for Task Models. The Handbook of Task Analy-
sis for Human-Computer Interaction, pages 483–503.
ISBN: 978-0805844337.
Pavelin, K. et al. (2012). Bioinformatics meets user-centred
design: A perspective. PLoS Computational Biology,
8(7):e1002554. Publisher: Public Library of Science.
Pearson, H. (2006). What is a gene? Nature,
441(7092):398–401. Number: 7092 Publisher: Na-
ture Publishing Group.
Recchia, G. et al. (2021). Creating genetic reports
that are understood by nonspecialists: a case study.
22(2):353–361.
Rimmer, J. (2004). Improving software environments
through usability and interaction design, volume 27.
J Audiov Media Med. ISSN: 17453054 Publication
Title: Journal of Visual Communication in Medicine.
Rutherford, P. et al. (2010). Usability of navigation tools
for browsing genetic sequences. In Conferences in Re-
search and Practice in Information Technology Series,
volume 106, pages 33–41. ISSN: 14451336.
Standardization, I. O. f. (2019). ISO 9241-210:2019, Sec-
ond Edition: Ergonomics of human-system interaction
- Part 210: Human-centred design for interactive sys-
tems.
Stephens, Z. D. et al. (2015). Big data: Astronomical or ge-
nomical? PLoS Biology, 13(7):e1002195. Publisher:
Public Library of Science.
Sutcliffe, A. et al. (2010). User engagement by user-centred
design in e-Health. In Philosophical Transactions of
the Royal Society A: Mathematical, Physical and En-
gineering Sciences, volume 368, pages 4209–4224.
Royal Society. ISSN: 1364503X.
Svanæs, D. et al. (2008). The contextual nature of usability
and its relevance to medical informatics. In Studies
in Health Technology and Informatics, volume 136,
pages 541–546. ISSN: 18798365.
Toxboe, A. (2007). User interface design pattern library.
Publication Title: UI Patterns.
Valentin, F. et al. (2010). Fast and efficient searching of
biological data resources-using EB-eye. Briefings in
Bioinformatics, 11(4):375–384.
ENASE 2023 - 18th International Conference on Evaluation of Novel Approaches to Software Engineering
26
