
The Green Tourist Trip Design Problem with Time Windows: A Model
Application on a Urban Scale
Annarita De Maio
1 a
, Roberto Musmanno
2 b
and Aurora Skrame
2 c
1
Department of Economy, Statistics and Finance ”G. Anania”, University of Calabria, Italy
2
Department of Mechanical, Energy and Management Engineering, University of Calabria, Italy
Keywords:
Tourist Trip Planning, Multimodality, Green Orienteering Problem, Multiobjective.
Abstract:
We model a variant of the Tourist Trip Design Problem with time windows. The novelty of the proposed
model is that we also take care of the needs of vulnerable users and of the sustainability of the tour in terms of
reduction of the level of CO
2
emissions generated by the vehicles associated with the different transportation
modes that can be selected to plan the tour. The mathematical formulation of the proposed model consists
of three objective functions, with the attempt to generate a green tour which maximizes the number of point
of interests (POIs) to visit and, at the same time, the total scores of the visited POIs. The correctness of
the proposed model has been tested on a real case, at a urban level. The preliminary results allow to better
understand the impact of the sustainability constraints on the tour and to address the direction for further
research developments.
1 INTRODUCTION
The tourism is an important economic sector which
has always been affected by a growing development,
due to its positive impact on improving and sustain-
ing the economy of different countries ((Umurzakov
et al., 2022) and (Massidda and Mattana, 2013)). The
World Travel and Tourism Council stated that in 2021
the travel and tourism’s contribution to global GDP
(Gross Domestic Producut) increased by US$1 tril-
lion (+21.7% rise), after around a 54% of decline dur-
ing the pandemic, confirming that tourism is one of
the largest industries that provides a strong impact
on the global economic development. The availabil-
ity of new technologies, like the mobile ICTs, arti-
ficial intelligence and sensitive analysis techniques,
the massive use of big data and the spread of so-
cial networks has had a significant impact on the
tourism. The paradigm of Tourism 2.0 changes the
digital tourist services from a product-driven envi-
ronment to a social and customer-driven one: e-
business development allows tourists to directly in-
teract with tourism service providers and with other
customers to exchange opinions and review visited
a
https://orcid.org/0000-0002-4650-3362
b
https://orcid.org/0000-0002-8852-6933
c
https://orcid.org/0000-0003-1728-4989
places. As a consequence, in the last years, it is pos-
sible to register the birth of different Tourist Recom-
mender Systems ((Ardito et al., 2019) and (De Maio
et al., 2020)), that simplify the life cycle of the
tourist experience, filtering relevant information for
the users and providing a decision support based on
explicit preferences (Kontogianni et al., 2018). Fi-
nally, the debate arising from the Sustainable De-
velopment Goals (SDGs) of the Agenda 2030 in-
volves also the role of tourism in the near future (see
the World Tourism Organisation website https://www.
unwto.org/tourism-in-2030-agenda). In particular,
the concept of sustainability in tourism is transver-
sal to different development goals: tourism can con-
tribute to use and sale of local products in tourist
destinations (zero hunger goal), sustainable tourism
can creates jobs (decent work and economic growth
goal), tourism can push the investments for smarter
and greener cities (sustainable cities and communi-
ties and reducing inequality goals), and so on (see
(Fakfare and Wattanacharoensil, 2022) and (Alonso-
Mu
˜
noz et al., 2022)). Under this respect, the research
interest in the numerical optimization field is devoted
to support the tourist decisions in building appeal-
ing and sustainable tours. The problem of helping
tourists in the definition of a customized tour is de-
fined Tourist Trip Design Problem (TTDP) (Gunawan
et al., 2016). In this problem a tourist usually wants
62
De Maio, A., Musmanno, R. and Skrame, A.
The Green Tourist Trip Design Problem with Time Windows: A Model Application on a Urban Scale.
DOI: 10.5220/0011669500003396
In Proceedings of the 12th International Conference on Operations Research and Enterprise Systems (ICORES 2023), pages 62-70
ISBN: 978-989-758-627-9; ISSN: 2184-4372
Copyright
c
2023 by SCITEPRESS – Science and Technology Publications, Lda. Under CC license (CC BY-NC-ND 4.0)

to visit a city, rich of attractions, in a limited amount
of time. The scope is to build a personalized tour,
according to the tourist’s preferences, selecting a se-
quence of POIs to visit. Each POI is characterized
by a score related to its attractiveness, a cost and a
time window for the visit. The tourist usually can
also impose limits about the total budget available
for the visits. Moreover, the tourist is able to move
from a POI to another using a variety of transporta-
tion modes, each of them with different costs (also
in terms of CO
2
emissions) and travel times. The
scope of this paper is to introduce a variant of the
Green Tourist Trip Design Problem (GTTDP), (Di-
vsalar et al., 2022), in which the sustainability of the
tour is considered. Under this respect, there are dif-
ferent aspects to be taken into account: the poten-
tial attractiveness of the tour, the number of POIs
to visit, the time windows of the POIs, the cost and
the time duration of the tour, and the quantity of
CO
2
released during the movements between POIs.
From another perspective, smart and inclusive cities
should take care to the needs of the so-called vulner-
able road users (VRUs). Traditionally, pedestrians,
bicyclists, and motorcyclists are considered VRUs, as
well as people with disability, elder people and chil-
dren (Methorst, 2002). Under this respect, the re-
search interest is more concentrated to reduce crashes
involving VRUs (Oxley et al., 2010), to build per-
sonalized trips for people with mobility impairments
(Darko et al., 2022) or to define information systems
and mobile services sharing real-time information and
integrating a tour design for VRUs (Scholliers et al.,
2017). As argued by (Darko et al., 2022), it is nec-
essary in the next future to propose fully accessible
and personalized tours in a broader multimodal mo-
bility context for VRUs, as well as to include useful
functionalities into the smart services for the differ-
ent users’ needs. In order to consider all these as-
pects, a multimodal multiobjective GTTDP with time
windows is presented. The rest of the paper is orga-
nized as follows: Section 2 reports the literature re-
view in the field and the main contributions of this
work. Section 3 describes the mathematical formula-
tion, whereas Section 4 introduces the case study set-
tings and the computational results. Finally, Section 5
reports the conclusions and the future developments.
2 LITERATURE REVIEW
The TTDP is a specific problem defined in the tourism
sector, but it can be led back to the more general
class of the Vehicle Routing Problems (VRP) with
profits (Archetti et al., 2014), in which two differ-
ent decisions have to be taken: 1) the best customers
to be served (not defined a-priori like it happens in
the classical VRP) and 2) the routes to be used. If
only one route is built, the problem becomes a vari-
ant of the Travelling Salesman Problem (TSP), de-
scribed in the scientific literature by using in some
cases alternative denominations. The most diffused
denomination is the Orienteering Problem (OP), in-
troduced by (Golden et al., 1987) and deriving from
the well known orienteering sport, in which each par-
ticipant has to maximize the total collected prizes as-
sociated with the visited points, returning to the start-
ing point within a certain time. Alternative definitions
and variants of the same problem are: the Maximum
Collection Problem (Butt and Cavalier, 1994), the Se-
lective Travelling Salesperson Problem (Laporte and
Martello, 1990) and the Bank Robber Problem (Awer-
buch et al., 1998). Note that, when multiple ve-
hicles are involved, the most investigated variant is
the so-called Team Orienteering Problem (TOP). An
overview of the OPs that is worth mentioning is re-
ported in the survey of (Gunawan et al., 2016), in
which several variants are classified and described:
classical OP, TOP (Pessoa et al., 2009), TOP with
time windows (Labadie et al., 2012), time dependent
TOP (Verbeeck et al., 2014), stochastic OP (Ilhan
et al., 2008) and the generalized OP (Geem et al.,
2005). The authors, in their conclusions, also iden-
tified the tourism trip design as one of the major prac-
tical applications of this problem. The TTDP is il-
lustrated in the surveys of (Gavalas et al., 2014) and
(Ruiz-Meza and Montoya-Torres, 2022). The au-
thors underlined that the TTDP can be mainly classi-
fied in single-objective and multiobjective problems.
In the single-objective case, the scope is the maxi-
mization of the benefits associated with visiting the
POIs. Under this respect, several variants are in-
vestigated: presence of time windows denoting the
opening and closing times of each POI (Abbaspour
and Samadzadegan, 2009); the score of POIs de-
riving from personal preferences or sensitive analy-
sis (Zheng and Liao, 2019); hotel selection option
(Zheng et al., 2020) and, time and budget constraints.
In the multiobjective case, different objective func-
tions are considered in the TTDP formulations: min-
imizing transportation and visiting costs, minimizing
waiting times at POIs, maximizing attractiveness of
the tour, minimizing travel time between POIs and
maximizing the diversity of the selected POIs (see
(Castillo et al., 2008), (Lim et al., 2017) and (Huang
et al., 2019)). Finally, the authors introduced some
future perspective in the tourist trip design, indicat-
ing the green variant as one of the most promising re-
search areas in the next future. Green and sustainable
The Green Tourist Trip Design Problem with Time Windows: A Model Application on a Urban Scale
63

tourism can be declined in different forms: for exam-
ple, taking into account emission during movements
between POIs, suggesting alternative mobility options
to the users, protecting natural areas or potentiating
the development of nature tourism and ecotourism.
This discussion underlines the timeliness of this work,
and a GTTDP with time windows is introduced in the
following sections. From the best of our knowledge,
the GTTDP was previously investigated only by (Di-
vsalar et al., 2022). The authors introduced a mul-
tiobjective and multimodal GTTDP where a mixed-
integer linear model is formulated, considering three
objective functions: maximizing the total score of the
trip, minimizing the total cost and the total CO
2
emis-
sion produced by the trip. Under this respect, var-
ious transportation modes are considered as possible
choice for the tourists in order to move between POIs.
Constraints related to travel time are also considered.
In this work, an extension of the model in (Divsalar
et al., 2022) is proposed, with different novelties:
• three different objective functions are considered:
minimizing the total CO
2
emissions and maximiz-
ing both the number of visited POIs and the total
scores associated with visited POIs;
• the tour is designed considering additional con-
straints: budget constraint on the total cost (mov-
ing and visiting costs) and time windows con-
straints related to the opening and closing time
of the POIs and to the preferences of the tourist
for the starting and ending times of the tour; the
average visit time at each visited POI is also con-
sidered when building the tour;
• a larger variety of transportation modes is taken
into account (car, public transport, bike, feet and
push scooter);
• additional constraints are incorporated in the
model, in order to customize the tour consider-
ing only the transportation modes chosen by the
tourists, or considering their preferences related to
the own physical possibilities (for example, fami-
lies with children would not like moving by using
bicycles or elder people would like avoiding long
walking paths);
• the model is tested on a real-setting case study in
a urban context (city of Florence).
The detailed description of the mathematical formu-
lation is introduced in the following section.
3 MATHEMATICAL
FORMULATION
In order to formalize the model under investigation
we adopt the following notation. Let N
+
be the set
of n potential POIs to visit, starting from and ending
to a fixed point denoted by node 0 and duplicated as
node n + 1. N = N
+
∪ {0, n + 1}, whereas A is the
arc set of the complete directed graph induced by N.
K is the set of possible transportation modes to real-
ize the visit (car, bus/metro, bike, on foot). For each
POI i ∈ N
+
the following parameters are assumed to
be known: a score p
i
, a cost f
i
, i.e., the price of the
entrance ticket, a time visit v
i
, e
i
and l
i
, that is, re-
spectively, the opening and closing times. Other pa-
rameters are: e
0
and l
0
, respectively, the earliest and
latest times at which the visit can be planned (the time
interval [l
0
− e
0
] corresponds to the time window at
node 0); T is the maximum travel time determined
by all movements between nodes, whereas T
k
is the
maximum travel time determined by all movements
between nodes considering the transportation mode k
(clearly, T
k
≤ T , ∀ k ∈ K); B is the cost budget avail-
able for the visit; c
i jk
, t
i jk
and s
i jk
are, respectively,
the cost, the time and the level of CO
2
emission as-
sociated with arc (i, j) ∈ A when travelled by using
transportation mode k; M is an arbitrarily large con-
stant. The decision variables are the following: z
i
,
i ∈ N
+
, are binary, each of them equal to one if the
POI i is visited, 0 otherwise; x
i jk
, (i, j) ∈ A, k ∈ K,
are binary, each of them equal to one if (i, j) is trav-
elled by using transportation mode k, 0 otherwise; u
i
,
i ∈ N, are continuous, each of them is the arrival time
at node i and, if i is a POI, corresponds to the starting
time of the visit at POI i. The three-objective problem
is formulated as follows:
Maximize
∑
i∈N
+
z
i
(1)
Maximize
∑
i∈N
+
p
i
z
i
(2)
Minimize
∑
(i, j)∈A
∑
k∈K
s
i jk
x
i jk
(3)
subject to
∑
i∈N\{0}
∑
k∈K
x
0ik
=
∑
i∈N\{n+1}
∑
k∈K
x
i,n+1,k
= 1 (4)
∑
i∈N\{ j}
∑
k∈K
x
i jk
=
∑
i∈N\{ j}
∑
k∈K
x
jik
= z
j
, ∀ j ∈ N
+
(5)
∑
k∈K
x
i jk
≤ 1, ∀ (i, j) ∈ A (6)
∑
(i, j)∈A
∑
k∈K
t
i jk
x
i jk
≤ T (7)
ICORES 2023 - 12th International Conference on Operations Research and Enterprise Systems
64

∑
(i, j)∈A
t
i jk
x
i jk
≤ T
k
∀ k ∈ K (8)
∑
(i, j)∈A
∑
k∈K
c
i jk
x
i jk
+
∑
i∈N
+
f
i
z
i
≤ B (9)
u
i
+ v
i
+
∑
k∈K
t
i jk
x
i jk
≤ u
j
+ M(1 −
∑
k∈K
x
i jk
),
∀ i ∈ N, j ∈ N \ {i} (10)
u
i
+ v
i
≤ l
i
z
i
, ∀ i ∈ N
+
(11)
e
i
z
i
≤ u
i
, ∀ i ∈ N
+
(12)
u
0
≥ e
0
(13)
u
n+1
≤ l
0
(14)
x
i jk
∈ {0, 1}, ∀ (i, j) ∈ A, k ∈ K (15)
z
i
∈ {0, 1}, ∀ i ∈ N
+
(16)
u
i
≥ 0, ∀ i ∈ N (17)
The objective function (1) is the number of POIs to
visit, whereas the objective function (2) represents the
corresponding total score of the visit. Both (1) and
(2) should be maximized. The third objective func-
tion (3), to be minimized, corresponds to the total
level of CO
2
emission associated with the visit. Con-
straint (4) states that the visit starts from node 0 and
ends to node n + 1. Constraints (5) ensure the con-
nectivity of the tour visiting the selected POIs. They
also provide the logic condition that an arc incident
in any node j can be travelled by any transportation
mode only if POI j is selected for the visit. Con-
straints (6) establishes that each arc (i, j) can be trav-
elled by using one transportation mode at most. Con-
straints (7) ensure that the total travel time of the tour
does not exceed the value of T (the constraint is as-
sumed because the visitor does not like to waste a lot
of time on travel). Constraints (8) impose a maximum
time budget to be spent for any transportation mode.
These constraints allow to limit (or completely forbid)
the use of a particular transportation mode, in accor-
dance with the specific needs of the tourist which can
be a VRU. Constraints (9) guarantees that the total
cost paid for travelling and visiting the POIs remains
under the budget limit B available. Constraints (10)
are subtour elimination constraints. They state that
if an arc (i, j) is visited (i.e., travelled by one trans-
portation mode), then the arrival time at node i plus
the duration of the visit at node i and the travel time
from node i to node j cannot be greater than the ar-
rival time at node j. Of course, if the arc (i, j) is not
visited, then, thanks to the arbitrarily large constant
M, the corresponding constraint is not active. Con-
straints (11) and (12) are time windows constraints at
each visited POI. Constraints (11) impose that if POI
i is visited, than the starting time of the visit at node
i plus the time visit should be within the closing time
of POI i and, thanks to constraints (12), the starting
time of the visit should be after the opening time of
POI i. Constraints (13) and (14) ensure that the visit
starts and ends within the time window [l
0
−e
0
] estab-
lished for the visit. Constraints (15) and (16) impose
that some decision variables are binary, whereas con-
straints (17) define the non-negative conditions on the
remaining ones. In the following section, some com-
putational experiments related to the real case study
are presented.
4 CASE STUDY SETTING AND
COMPUTATIONAL RESULTS
The mathematical model illustrated in Section 3 has
been applied to the city of Florence in Italy. A set
of 20 POIs is considered, whose features, in terms of
geographical coordinates, price, average duration of
the visit, time windows and score, are reported in Ta-
ble 1. Note that all data are extracted by using the
support of available databases: for the positions, the
travel times and distances between POIs (not reported
in details for the sake of brevity), a Python routine
linked with Google Maps has been used; the score
of each POI has been extracted from the database of
MIBACT (Italian Ministry of Cultural Heritage and
Activities and Tourism, https://storico.beniculturali.it/
mibac/export/MiBAC/index.html#&panel1-1). The
spatial distribution of the selected POIs is represented
in Figure 1.
Figure 1: Locations of some POIs chosen in the city of Flo-
rence.
Five different transportation modes are consid-
The Green Tourist Trip Design Problem with Time Windows: A Model Application on a Urban Scale
65

Table 1: Features of the 20 POIs chosen in the city of Florence.
ID POI Latitude Longitude Cost Time window Visiting time Score
i f
i
, (C) [e
i
, l
i
] v
i
, (minutes) p
i
1 Piazza Duomo 43.772904 11.257733 20 [09:30; 17:30] 150 10
2 Piazza della Signoria 43.769306 11.255592 22 [08:15; 18:30] 150 10
3 Ponte Vecchio 43.768459 11.253549 0 [00:00; 24:00] 30 10
4 Galleria degli Uffizi 43.768665 11.25568 20 [08:15; 18:50] 150 10
5 Palazzo Strozzi 43.771527 11.251981 16 [09:30; 17:30] 60 9
6 Museo Galileo 43.767776 11.256297 10 [09:30; 18:00] 60 9
7 Dante’s House 43.771016 11.257115 8 [10:00; 18:00] 60 8
8 Basilica of Holy Spirit 43.766924 11.247824 0 [08:30; 18:00] 90 9
9 Synagogue and Jewish Museum 43.773316 11.265698 10 [10:00; 17:30] 120 10
10 English Cemetery 43.77685 11.268549 3 [14:00; 18:00] 60 7
11 Marini’s Museum 43.771968 11.249687 6 [10:00; 19:00] 120 7
12 Piazza della S. Annunziata 43.776338 11.260921 4 [07:30; 19:00] 60 8
13 Horne Museum 43.767522 11.259347 6 [10:00; 18:00] 30 7
14 Clet’s Workshop 43.764474 11.260829 0 [13:30; 19:30] 60 7
15 Basilica di Santa Croce 43.768737 11.26203 9 [09:30; 17:30] 90 10
16 Parco delle Cascine 43.782497 11.219324 5 [11:00; 19:00] 150 9
17 Complesso di Palazzo Pitti 43.765343 11.249898 22 [08:10; 19:10] 150 10
18 Enzo Pazzagli Art Park 43.768647 11.324149 6 [11:00; 21:00] 150 8
19 Piazzale Michelangelo 43.762464 11.264762 0 [00:00; 00:00] 30 10
20 Gardens and Villa of Castello 43.819098 11.229186 8 [08:30; 18:30] 150 10
ered: car, walking, traditional bike (not electric ver-
sion), public transportation (tram and bus) and push
scooter. The amount of produced CO
2
per transporta-
tion mode is extracted from the CO
2
Connect website
(www.co2nnect.org): 0.183 kg/km for car, 0 kg/km
for walking and bike, 0.065 kg/km for public trans-
portation and 0.126 kg/km for push scooter. Finally,
the kilometric cost per transportation mode is equal
to C 0.25 for car, C 0.00 for walking, C 0.20 for
bike, C 0.35 for public transportation and C 0.50 for
push scooter. Note that the costs for bike and push
scooter are referred to the most common services of
bike sharing and push scooter sharing. It is assumed
that the tourist has indicated the maximum duration
of the daily itinerary (in our test case 10.5 hours,
with a feasible time window set to [9:00;19:30]), the
maximum budget (C 40), the maximum time to be
spent for travelling between POIs (60 minutes) and
the departure/arrival point of the tour, represented by
Santa Maria Novella railway station. To determine a
Pareto optimal solution of problem (1)–(17), the lexi-
cographic method is applied, see (Collette and Siarry,
2003). The objective functions (1)−(3) are ranked in
order of importance, from best to worst. Then, a se-
quence of at most three single-objective optimization
problems is solved by considering a single objective
function at a time, starting with the most important
one and proceeding according to the order of impor-
tance given to the objectives. However, the optimal
value found for each objective is added as a constraint
for subsequent optimizations. More specifically, we
always keep the objective function (1) of highest pri-
ority. In this way, at the first step, the lexicographic
optimization leads to the solution of problem (1),
(4)−(17). This guarantees that the tour always con-
tains the highest number f
∗
1
of selected POIs. At the
second step, we solve the problem (2), (4)−(17) with
the additional constraint
∑
i∈N
+
z
i
≥ f
∗
1
. Let f
∗
2
be the
optimal value of the objective function (2). At this
step, in our case, we always obtain a unique optimal
solution (otherwise, we should have to optimize this
objective). This solution, in correspondence of which
we compute the value of the objective function (3),
is taken as the desired solution of the original prob-
lem. A further Pareto optimal solution is obtained
by reversing the order of importance of the second
and third objectives. This gives the tourist a choice
between two alternatives and enables the evaluation
of the advantages of one over the other. The im-
plementation of any optimization problem has been
carried out by using GAMS 24.7.4 (GAMS Develop-
ment Corporation) as the algebraic modelling system,
with CPLEX 12.6 (IBM Corporation) as the solver.
The code has been executed on a PC Intel Core i7
(2.3 GHz) with 16 GB of RAM. In order to evaluate
the effectiveness of the described approach, in terms
of CO
2
emissions, of potential savings and of VRUs
preferences, a kind of what-if analysis has been con-
ducted, considering four cases (called in the following
as scenarios), on the basis of different settings of the
user preferences. These are described as follows:
• Scenario 1. The preferences of an eclectic tourist
are considered: all transportation modes are fully
usable. As a consequence, the budget limit for
each transportation mode is equal to the maximum
ICORES 2023 - 12th International Conference on Operations Research and Enterprise Systems
66

time budget, that is, T
k
= T = 60 minutes for each
k ∈ K.
• Scenario 2. The case of a VRU as a tourist is con-
sidered. The user is unwilling to walk or ride a
bike for more than 20 minutes. As a consequence,
the budget limit for each transportation mode is
equal to the maximum time budget, except for
walking and bike modes, that is, T
1
= T
4
= T
5
=
T = 50 minutes and T
2
= T
3
= 20 minutes.
• Scenario 3. Again the case of a VRU is consid-
ered, with more extreme requirements. The user
is unwilling to walk for more than 10 minutes and
could use only e-bikes. As a consequence, the
budget limit for each transportation mode is equal
to the maximum time budget, except for walking
mode, that is, T
1
= T
3
= T
4
= T
5
= T = 50 minutes
and T
2
= 10 minutes. Note that, the e-bike has
similar CO
2
emission level of the push scooter, so
s
i j3
= s
i j5
, ∀ (i, j) ∈ A.
• Scenario 4. A baseline for the evaluation of
possible CO
2
emission savings is built, imposing
that the tour can allow only private transportation
modes: car (fully available) and walking (avail-
able only for movements within traffic limited
zones). In this way, the greener transportation
modes cannot be activated.
Note that all the tests are solved optimally, so the cor-
responding optimality GAP is omitted. The results
obtained by applying for each scenario the lexico-
graphic method described above are reported in the
sequel. For Scenarios 1, 2 and 3, the optimal solu-
tion of problem (1), (4)−(17) is determined, with a
value of the objective function (1) equal to f
∗
1
= 9.
As a consequence,
∑
i∈N
+
z
i
≥ 9 is the new additional
constraint for the subsequent tests. For Scenario 4,
the optimal solution of problem (1), (4)−(17) leads
to f
∗
1
= 7. As previously described, two further tests
are executed for each scenario: the first one considers
(2) as the objective function (referred with label Test
X.A), whereas the second one takes (3) as the objec-
tive function (with label Test X.B). ”X” indicates the
referred scenario. The results are reported in Table
2 organized as follows: column Test reports the cor-
responding setting under investigation, column POIs
refers to f
∗
1
; CO
2
reports the CO
2
emission level of
the tour; Score represents the total score of the se-
lected POIs and Time reports the execution time (in
seconds) of the test run.
In Table 3, the details about the travel times and
the transportation modes activated for each tour are
reported. The four tours associated with Tests 1.B,
2.B, 3.B and 4.B (the settings are related to the mini-
Table 2: Results of the what-if analysis obtained consider-
ing four different scenarios.
Test POIs ( f
∗
1
) CO
2
Score CPU Time
(kg) (seconds)
Test 1.A 9 0.052 79 6193.00
Test 1.B 9 0.000 77 0.33
Test 2.A 9 0.874 79 429
Test 2.B 9 0.0699 78 525
Test 3.A 9 2.012 79 88.91
Test 3.B 9 0.993 78 89.13
Test 4.A 7 2.934 56 34
Test 4.B 7 2.934 56 95
mization of the emissions) are also depicted, see Fig-
ures 2, 3, 4 and 5.
Table 3: Results of the what-if analysis obtained consider-
ing four different scenarios for the transportation modes.
Test Transportation Minutes
mode
Test 1.A walking 22.88
bike 35.67
car 1.43
Test 1.B walking 27.20
bike 31.50
Test 2.A car 8.50
walking 8.13
bike 19.61
public transportation 20.97
push scooter 1.62
Test 2.B walking 14.70
bike 19.95
public transportation 8.88
push scooter 2.32
Test 3.A car 17.42
walking 8.13
bike 27.13
public transportation 5.52
Test 3.B car 1.43
walking 9.00
bike 11.41
public transportation 19.36
Test 4.A car 48.24
Test 4.B car 48.24
Figure 2: Green tourist tour generated for Test 1.B.
The Green Tourist Trip Design Problem with Time Windows: A Model Application on a Urban Scale
67
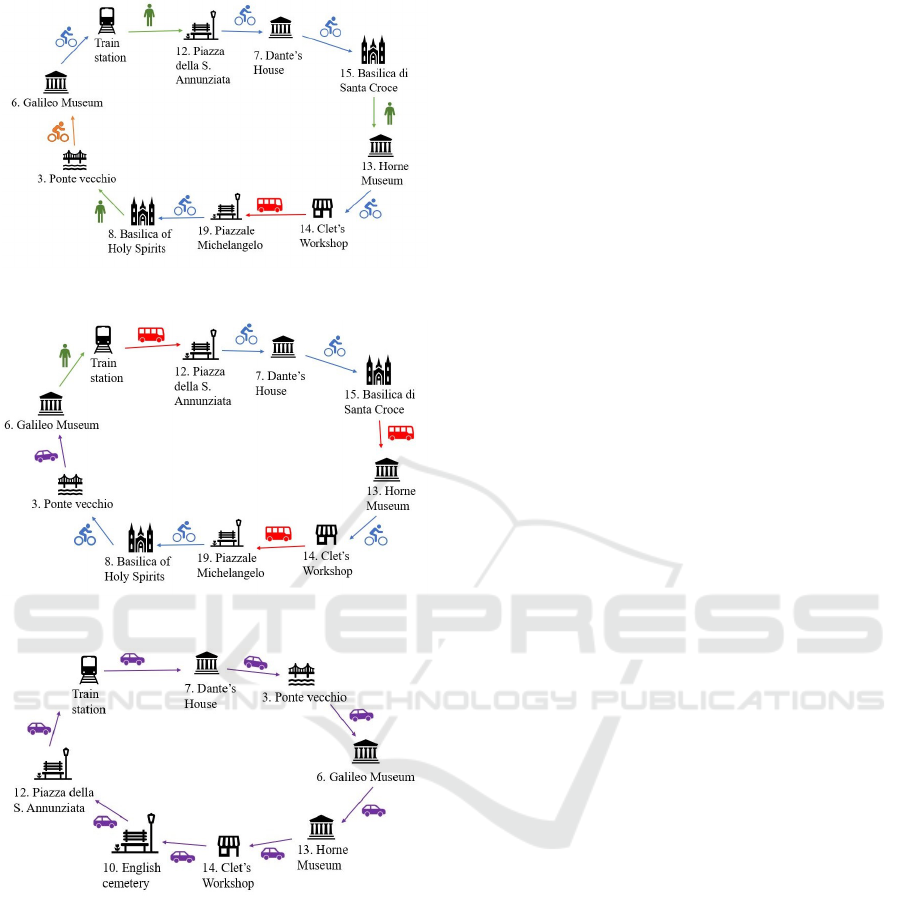
Figure 3: Green tourist tour generated for Test 2.B.
Figure 4: Green tourist tour generated for Test 3.B.
Figure 5: Green tourist tour generated for Test 4.B.
It is worth noting that the lexicographic method
can be considered as a suitable approach to generate
high quality solutions for different types of tourists.
First of all, the choice of assigning the highest pri-
ority to the objective function corresponding to the
maximization of the number of visited POIs respects
the needs of the tourist that generally likes to exploit
all the available time for the visit. Although all the
solutions obtained are Pareto optimal, some of them
seems to be more interesting for the GTTDP. Note
that, in Tests 1.B, 2.B and 3.B the reduction of the
CO
2
emissions is higher than the loss in the tour scor-
ing. Indeed, comparing Tests 1.A and 1.B, a loss
of 2.53% in the tour scoring leads to a reduction of
5.24% of the CO
2
emissions. Similarly, for Scenarios
2 and 3 the reduction of the CO
2
emissions is more
than 100%, with a tour scoring loss of 1.27%. The
comparison of Scenarios 1, 2 and 3 with the solution
obtained in Scenario 4 (the baseline in terms of CO
2
emissions), highlights additional aspects: the reduc-
tion of the CO
2
emissions is about 100% for Scenar-
ios 1 and 2 with respect to the solution based on the
use of the private car as a transportation mode, and
about 45% for Scenario 3. Under this respect, our
model empirically shows a good balance between sus-
tainability and the specific requirements of a tourist
when acts as a VRU. Finally, note that in Scenario
4 also the tour scoring decreases, compared with the
lowest value (77 for Test 1.B): there is a gap equal to
28% between the two solutions. This is due to the typ-
ical configuration of the city centre: Florence is char-
acterized by several limited traffic zones, where the
POIs are relatively close to each other. For this rea-
sons, the green transportation modes encourage the
construction of more attractive tours. This aspect is
typical of many ancient tourist cities. Moreover, con-
sidering the results reported in Table 3, zero-emission
transportation modes are activated quite often. This
issue sometimes implies quite longer travel times with
respect to other solutions. Finally, the described so-
lutions underline the flexibility of the proposed ap-
proach: for each scenario a high quality tour is gener-
ated, consuming all the time budget available for the
tourists and satisfying their needs in terms of trans-
portation modes.
5 CONCLUSIONS
In this work a multimodal and multiobjective GTTDP
is presented for generating a personalized tour com-
pliant with the preferences and the requirements of
different kind of tourists. At this stage the proposed
optimization model represents only a first step of the
development of a more sophisticated decision support
tool in a tourism management context. The paradigm
of the Tourism 2.0 has definitely introduced the digi-
talization of tourist services, and several sophisticated
ICT platforms has been designed to support several
options to smarter tourists. The goal of the described
approach is to determine a low level of CO
2
emis-
sion tour containing a large number of POIs with high
scores. Different transportation modes have been con-
sidered as choices for the tourist to move between
POIs for a daily tour. This tour can be planned to fa-
cilitate the tourist category of VRUs, which imposes
transportation restrictions. The future steps can in-
ICORES 2023 - 12th International Conference on Operations Research and Enterprise Systems
68

volve a more in-depth sensitive analysis on the param-
eters chosen in the model, and the possibility to ex-
tend the experiments to other different urban contexts
(larger size cities with more transportation modes).
In this case, the possibility of implementing heuris-
tic algorithms cannot be excluded a priori. Under the
mathematical perspective, other variants of the opti-
mization model can be investigated by considering
multitrip, time-dependent travel times and the vari-
ability of the visit duration (dependent of the crowd-
ing level of the visited POIs). Under the managerial
perspective, further studies can be devoted to evalu-
ate the scalability of the proposed model in a regional
context, in which a tourist likes moving between POIs
in different cities using long-distance transportation
modes (bus, train, private car) and where discour-
aging the use of private cars has a stronger impact
on the CO
2
emission levels. Finally, specific studies
can be addressed to the tourist trip design for VRUs
with particular disabilities (for example, people in
wheelchairs or with low vision) who need to access to
POIs, and to transportation modes with specific fea-
tures.
REFERENCES
Abbaspour, R. and Samadzadegan, F. (2009). Itinerary
planning in multimodal urban transportation network.
J Appl Sci, 9(10):1898–1906.
Alonso-Mu
˜
noz, S., Torrej
´
on-Ramos, M., Medina-Salgado,
M., and Gonz
´
alez-S
´
anchez, R. (2022). Sustainabil-
ity as a building block for tourism – future research:
tourism agenda 2030. Tourism Review.
Archetti, C., Speranza, M., and Vigo, D. (2014). Vehicle
routing problems with profits. Vehicle Routing: Prob-
lems, Methods and Applications. SIAM, pages 273–
296.
Ardito, L., Cerchione, R., Del Vecchio, P., and Raguseo, E.
(2019). Big data in smart tourism: challenges, issues
and opportunities. Curr. Issues Tour., 22.
Awerbuch, B., Azar, Y., Blum, A., and Vempala, S. (1998).
New approximation guarantees for minimum-weight
k-trees and prize-collecting salesmen. SIAM Journal
on Computing, 28:254–262.
Butt, S. and Cavalier, T. (1994). A heuristic for the multi-
ple tour maximum collection problem,. Computers &
Operations Research, 21:101–111.
Castillo, L., Armengol, E., Onaind
´
ıa, E., Sebastia, L.,
Gonzalez-Boticario, J., Rodr
´
ıguez, A., Fernandez, S.,
Arias, J., and Borrajo, D. (2008). Samap: an user-
oriented adaptive system for planning tourist visits.
Expert Syst Appl, 34(2):1318–1322.
Collette, Y. and Siarry, P. (2003). Multiobjective Optimiza-
tion. Principles and Case Studies.
Darko, J., Folsom, L., Pugh, N., Park, H., Shirzad, K.,
Owens, J., and Miller, A. (2022). Adaptive personal-
ized routing for vulnerable road users. IET Intelligent
Transport Systems, WILEY., 16.
De Maio, A., Fersini, E., Messina, E., Santoro, F., and Anto-
nio Violi, A. (2020). Exploiting social data for tourism
management: the smartcal project. Quality and Quan-
tity.
Divsalar, G., Ali Divsalar, A., Jabbarzadeh, A., and Sahebi,
H. (2022). An optimization approach for green tourist
trip design. Soft Computing, 26:303–4332.
Fakfare, P. and Wattanacharoensil, W. (2022). Low-
carbon tourism: determining domestic tourist percep-
tion from thailand: Tourism agenda 2030. Tourism
Review.
Gavalas, D., Konstantopoulos, C., Mastakas, K., and
Pantziou, G. (2014). A survey on algorithmic ap-
proaches for solving tourist trip design problems. J
Heuristics., 20(3):291–328.
Geem, Z. W., Tseng, C. L., and Park, Y. (2005). Harmony
search for generalized ori- enteering problem: best
touring in china. In L. Wang, K. Chen and Y.S.Ong
(Eds.), Advances in natural computation. Lecture
Notes in Computer Science, Springer., 3612:741–750.
Golden, B., Levy, L., and Vohra, R. (1987). The orienteer-
ing problem. Naval Research Logistics, 34:307–318.
Gunawan, A., Lau, H., and Vansteenwegen, P. (2016). Ori-
enteering problem: A survey of recent variants, solu-
tion approaches and applications. European Journal
of Operational Research, 255:315–332.
Huang, T., Gong, Y., Zhang, Y., Zhan, Z., and Zhang, J.
(2019). Automatic planning of multiple itineraries: a
niching genetic evolution approach. IEEE Trans Intell
Transp Syst, 21(10):4225–4240.
Ilhan, T., Iravani, S. M. R., and Daskin, M. (2008). The ori-
enteering problem with stochastic profits. IIE Trans-
actions, 40(4):406–421.
Kontogianni, A., Kabassi, K., Virvou, M., and Alepis, E.
(2018). Smart tourism through social network user
modeling: a literature review. 2018 9th International
Conference on Information, Intelligence, Systems and
Applications (IISA). IEEE.
Labadie, N., Mansini, R., Melechovsky, J., and
Wolfler Calvo, R. (2012). The team orienteer-
ing problem with time windows: an lp-based granular
variable neighborhood search. European Journal of
Operational Research, 220(1):15–17.
Laporte, G. and Martello, S. (1990). The selective travel-
ling salesman problem. Discrete Applied Mathemat-
ics, 26:193–207.
Lim, K., Chan, J., Leckie, C., and Karunasekera, S. (2017).
Personalized trip recommendation for tourists based
on user interests, points of interest visit durations and
visit recency. Knowl Inf Syst, 54(2):375–406.
Massidda, C. and Mattana, P. (2013). A svecm analysis
of the relationship between international tourism ar-
rivals, gdp and trade in italy. Journal of Travel Re-
search, 52(1).
Methorst, R. (2002). Vulnerable road users: new ap-
proaches needed. In: 15th ICTCT Workshop, Trans-
port Research Centre, Rotterdam.
The Green Tourist Trip Design Problem with Time Windows: A Model Application on a Urban Scale
69

Oxley, J., Langford, J., and Charlton, J. (2010). The safe
mobility of older drivers: a challenge for urban road
designers. Journal of Transport Geography. Special
issue: The mobility of older people., 18(5):642–648.
Pessoa, A., Poggi, M., and Uchoa, E. (2009). A ro-
bust branch-cut-and-price algo- rithm for the hetero-
geneous fleet vehicle routing problem. Networks,
54(4):167–177.
Ruiz-Meza, J. and Montoya-Torres, J. (2022). A systematic
literature review for the tourist trip design problem:
Extensions, solution techniques and future research
lines. Operations Research Perspectives, 9:100228.
Scholliers, J., van Sambeek, M., and Moerman, K. (2017).
Integration of vulnerable road users in cooperative its
systems. Eur. Transp. Res. Rev., 9(15).
Umurzakov, U., Tosheva, S., and Salahodjaev, R. (2022).
Tourism and sustainable economic development: Evi-
dence from belt and road countries. J Knowl Econ.
Verbeeck, C., S
¨
orensen, K., Aghezzaf, E. H., and Vansteen-
wegen, P. (2014). A fast solution method for the time-
dependent orienteering problem. European Journal of
Operational Research, 236(2):419–432.
Zheng, W., Ji, H., Lin, C., Wang, W., and Yu, B. (2020). Us-
ing a heuristic approach to design personalized urban
tourism itineraries with hotel selection. Tour Manag,
76(422):103956.
Zheng, W. and Liao, Z. (2019). Using a heuristic approach
to design personalized tour routes for heterogeneous
tourist groups. Tour Manag, 72(555):313–325.
ICORES 2023 - 12th International Conference on Operations Research and Enterprise Systems
70
