
Partner Selection Strategy in Open, Dynamic and Sociable Environments
Qin Liang
1,3
, Wen Gu
2
, Shohei Kato
3
, Fenghui Ren
1
, Guoxin Su
1
, Takayuki Ito
4
and Minjie Zhang
1
1
University of Wollongong, Wollongong, Australia
2
Japan Advanced Institute of Science and Technology, Nomi, Japan
3
Nagoya Institute of Technology, Nagoya, Japan
4
Kyoto University, Kyoto, Japan
{fren, guoxin}@uow.edu.au, ito@i.kyoto-u.ac.jp, minjie@uow.edu.au
Keywords:
Advisor, Partner Selection, Unfair Rating Attacks, Ranking.
Abstract:
In multi-agent systems, agents with limited capabilities need to find a cooperation partner to accomplish com-
plex tasks. Evaluating the trustworthiness of potential partners is vital in partner selection. Current approaches
are mainly averaged-based, aggregating advisors’ information on partners. These methods have limitations,
such as vulnerability to unfair rating attacks, and may be locally convergent that cannot always select the best
partner. Therefore, we propose a ranking-based partner selection (RPS) mechanism, which clusters advisors
into groups according to their ranking of trustees and gives recommendations based on groups. Besides, RPS
is an online-learning method that can adjust model parameters based on feedback and evaluate the stability of
advisors’ ranking behaviours. Experiments demonstrate that RPS performs better than state-of-the-art models
in dealing with unfair rating attacks, especially when dishonest advisors are the majority.
1 INTRODUCTION
In multi-agent systems (MASs), when agents with
limited capabilities confront complex tasks, they of-
ten need to cooperate to achieve their objectives. Se-
lecting a reliable partner is not trivial, especially in
open, large, and dynamic MASs where multiple risks
exist, e.g., being deceived by dishonest agents (Zhang
and Cohen, 2008; Liu et al., 2011; Fang, 2013).
Therefore, agents need to evaluate the trustworthiness
of others in partner selection. Considering the mas-
sive scale of MASs, most agents have insufficient di-
rect interactions with others (e.g. newcomers), mak-
ing it difficult for agents to evaluate the trustworthi-
ness of others based on personal experiences accu-
rately (Teacy et al., 2012). Therefore, agents need
to seek advice about candidates from third-party ad-
visors, which brings a new problem: unfair rating at-
tacks.
Unfair rating attacks are caused by malicious ad-
visors (e.g. attackers). They may deliberately pro-
vide fake or unreliable ratings to impact the decisions
of other agents seeking partners (Jiang et al., 2013;
Wang et al., 2015; Wang et al., 2019). Camouflage,
whitewashing, and Sybil are common unfair rating at-
tacks. Besides, attackers usually take various combi-
nation attacks, which increase the difficulty of attack
detection (Jiang et al., 2013). For example, in the
Sybil camouflage attacks, attackers create multiple
accounts, provide fair ratings to build up a reputation
first, and then give unfair ratings. In the Sybil white-
washing attacks, attackers create various accounts to
constantly give unfair ratings and start new accounts
after their reputation collapses.
Currently, many classical models have been pro-
posed to solve the problem of unfair rating attacks
(Regan et al., 2006; Zhang and Cohen, 2008; Liu
et al., 2011; Teacy et al., 2012; Teacy et al., 2012; Yu
et al., 2014). For example, BRS (Josang and Ismail,
2002) and TRAVOS (Teacy et al., 2006) use Beta dis-
tribution to aggregate ratings from advisors and mit-
igate the effect of deceptive advice. Based on BRS,
Zhang (Zhang and Cohen, 2008) developed a person-
alized model to address the problem of unfair ratings,
which combines private (e.g. personal experience)
and public (e.g. feedback from third parties) advice
to model the advisors’ trustworthiness. The iCLUB
(Liu et al., 2011) model handles multi-nominal ratings
by applying clustering to divide buyers into different
clubs, which filters unfair testimonies to improve the
robustness of models. The HABIT(Teacy et al., 2012)
model extends BLADE (Regan et al., 2006) by an-
Liang, Q., Gu, W., Kato, S., Ren, F., Su, G., Ito, T. and Zhang, M.
Partner Selection Strategy in Open, Dynamic and Sociable Environments.
DOI: 10.5220/0011690400003393
In Proceedings of the 15th International Conference on Agents and Artificial Intelligence (ICAART 2023) - Volume 2, pages 231-240
ISBN: 978-989-758-623-1; ISSN: 2184-433X
Copyright
c
2023 by SCITEPRESS – Science and Technology Publications, Lda. Under CC license (CC BY-NC-ND 4.0)
231

alyzing correlations of the behaviour within groups
of trustees, which is robust to cope with malicious,
noisy, or inaccurate third-party information. The
MET (Jiang et al., 2013) model resists unfair rating
attacks by using evolutionary operators to generate a
trust network over time. The ACT model (Yu et al.,
2014) uses reinforcement learning to cope with biased
testimonies by automatically adjusting critical param-
eters.
However, classical models still have many draw-
backs. For example, BRS and iCLUB are vul-
nerable to Sybil attacks; TRAVOS and HABIT are
vulnerable to Camouflage attacks; The personalized
model (Zhang and Cohen, 2008) is susceptible to
Sybil Whitewashing attacks. Therefore, we propose
a Ranking-based Partner Selection (RPS) model to
solve the challenging problem of unfair rating attacks.
RPS has two advantages: (1) Introducing the rank-
ing of trustees as a supplement for ratings, which im-
proves the accuracy of partner selection, especially in
environments with a high ratio of dishonest advisors;
(2) Introducing an online learning method, which
helps to update model parameters based on feedback
in real-time; (3) Introducing behaviour monitoring,
which helps to cope with dynamic changing attacks
like camouflage.
The rest of this paper is organized as follows. Sec-
tion 2 introduces related work. Section 3 describes
the problem and presents the formal definitions. Sec-
tion 4 describes the principle of the model and gives
the detailed design of the Partner Selection and Pa-
rameter Adjustment modules. Section 5 demonstrates
experiment settings and results. Section 6 concludes
the paper and outlines future work.
2 RELATED WORK
In recent years, some researchers use information the-
ory to cope with the problems of unfair rating at-
tacks. For example, the ITC model (Wang et al.,
2015) uses two information-theoretic to measure the
quality of recommendations, including the true obser-
vations (true interaction history) of the advisor about
the seller and the true integrity (trustworthiness) of
the seller, respectively. Besides, ITC considers two
types of worst-case unfair rating attacks performed
by advisors. Experiments show that the recommen-
dations might bring information even in the worst-
case unfair rating attacks. Therefore, ITC outper-
forms TRAVOS(Teacy et al., 2006), BLADE(Regan
et al., 2006), and MET(Jiang et al., 2013), which can-
not provide accurate trust evaluation under the worst-
case unfair rating attacks.
Wang et al (Wang et al., 2019) propose a prob-
abilistic model to solve the problem of unfair rating
attacks, which applies information theory to measure
the impact of attacks. In particular, the model identi-
fies the attack with the worst impact. The paper con-
sists of two parts. First, attacks brought by honest
and objective advisors are studied, and a probabilistic
model and an information-leakage method are used to
study the unfair rating attacks. Then, the worst-case
attack strategies are found. Second, attacks brought
by honest but subjective advisors are investigated, and
the results are compared with the earlier ones. Ex-
periments show that subjectivity makes it easier for
attackers to hide the truth completely, and the more
subjective rating makes a system less robust against
unfair rating attacks.
Besides, some researchers try to construct robust
models that are simple to implement to solve un-
fair rating problems. For example, the ITEA model
(Parhizkar et al., 2019; Parhizkar et al., 2020) aims to
cope with deceptive agents, where the learner aggre-
gates predictions made by a group of experts (advi-
sors) in a weighted average, and the weights are up-
dated based on the most recent forecasts. ITEA ne-
glects the individual losses incurred by advisors in
previous interactions because the weights reflect the
past performance of advisors cumulatively. There-
fore, ITEA is more simple, efficient, and robust than
TRAVOS, MET, and ACT. Considering the ITEA
model is simple to implement and performs better
than current models, we use it as a comparison model.
3 PROBLEM DESCRIPTION AND
DEFINITIONS
3.1 Definitions
We use a Multi-Agent System (MAS) to represent
the partner selection environments composed of three
types of agents: trustor, trustee and advisor. The
formal definitions are presented below.
Definition 1. Trustees represent agents willing to of-
fer services to perform tasks, defined as S = {s
j
| j =
1,...,m}. Each trustee s
j
has a reliability rb
j
∈ [0,1],
representing the probability of s
j
to provide qualified
services.
Definition 2. Trustors represent agents seeking ser-
vice to perform tasks, defined as B = {b
i
|i = 1, ..., x}.
Definition 3. Advisors represent agents having direct
interactions with trustees and willing to share infor-
mation with trustors, defined as A = {a
k
|k = 1,...,n}.
Each advisor has a label c ∈ {0,1,...,y}, where c = 0
ICAART 2023 - 15th International Conference on Agents and Artificial Intelligence
232

Table 1: A sample of unfair raitngs.
(a) Reliability of trustees.
s
1
s
2
s
′
3
s
′
4
rb 0.9 0.8 0.3 0.4
(b) Advisors’ ratings of trustees.
a
1
a
′
2
a
′
3
a
′
4
a
′
5
a
′
6
r
s
1
0.9 0.1 0.05 0.1 0.1 0.05 0.22
s
2
0.8 0.2 0.1 0.2 0.07 0.2 0.26
s
′
3
0.3 0.3 0.3 0.3 0.3 0.3 0.3
s
′
4
0.4 0.4 0.4 0.4 0.4 0.4 0.4
(resp. c = y) representing it is honest (resp. it is dis-
honest and takes the y-th attack strategy).
Definition 4. An Interaction represents a process
where an agent requests services from another agent
and gets an outcome, defined as I = (v,s
j
,o). v repre-
sents a trustor b
i
or an advisor a
k
, and s
j
represents a
trustee. o ∈ {0, 1} represents the interaction outcome
between v and s
j
, where 1 (resp. 0) denotes successful
(resp. unsuccessful).
3.2 Problem Description
In partner selection environments, dishonest trustees
cannot provide services as promised. Therefore, the
trustor has to seek information from third-party ad-
visors to find a reliable trustee. For example, in e-
commerce systems, some dishonest sellers provide
unqualified products to buyers, and therefore, buy-
ers will select sellers by referring to product reviews.
However, advisors’ information might also be dishon-
est, creating a new problem of unfair rating attacks.
Unfair rating attacks are caused by dishonest ad-
visors who give distorted ratings to increase dishonest
trustees’ reputations and decrease competitors’ repu-
tations. Traditional models(Josang and Ismail, 2002;
Liu et al., 2011; Teacy et al., 2006; Teacy et al.,
2012) are vulnerable to unfair rating attacks, espe-
cially when the dishonest advisors are the majority
(worst-case attacks(Wang et al., 2019)). In the worst-
case attacks, the majority-rule-based method will be
invalid. Table 1 shows an example of unfair ratings.
Five dishonest advisors (e.g. a
′
2
, a
′
3
, a
′
4
, a
′
5
and a
′
6
)
conspire with the dishonest trustee (e.g. s
′
3
and s
′
4
).
They take the ”Selective Badmouthing” attack strat-
egy (e.g. c = 8) by giving true ratings for trustees
whose reliability rb < 0.5 and giving distorted ratings
for the remaining trustees. When the dishonest advi-
sors are the majority, the average ratings (e.g. r) based
on all the advisors show that the dishonest trustee s
′
4
has the highest rating, which is unreliable.
Traditional rating-based models have two draw-
backs: 1) when a high ratio of dishonest advisors ex-
Table 2: Ranking of trustees based on ratings.
Rankings of Trustees
b
1
s
1
>s
2
>s
′
4
>s
′
3
a
1
s
1
>s
2
>s
′
4
>s
′
3
a
′
2
s
′
4
>s
′
3
>s
2
>s
1
a
′
3
s
′
4
>s
′
3
>s
2
>s
1
a
′
4
s
′
4
>s
′
3
>s
2
>s
1
a
′
5
s
′
4
>s
′
3
>s
1
>s
2
a
′
6
s
′
4
>s
′
3
>s
2
>s
1
ists, the evaluation results might become unreliable;
2) some methods are locally convergent, which can-
not always select the best partner. Therefore, we pro-
pose a Ranking-based Partner Selection (RPS) model,
which introduces the ranking of trustees as a supple-
ment to rating data. Table 1 and 2 shows an example
of the ranking of trustees based on ratings. For hon-
est advisor a
1
, it has the same ranking of trustees as
the trustor b
1
. Therefore, b
1
can refer to a
1
’s rank-
ing information directly. The dishonest advisors a
′
2
,
a
′
3
, a
′
4
, a
′
5
and a
′
6
have the same top two trustees,
which are dishonest trustees s
′
3
and s
′
4
. Therefore, the
RPS model can separate honest and dishonest advi-
sors based on their different ranking characteristics.
Besides, the RPS model can alleviate local conver-
gence problems. For example, honest trustees s
1
and
s
2
have close reliabilities, which are 0.9 and 0.8. Tra-
ditional rating-based models can only sometimes se-
lect the best partner from s
1
and s
2
because they are
locally convergent and tend to stop looking for other
trustees when finding s
2
is reliable. In comparison,
RPS select the first-order trustee of rankings, which
avoids local convergence problems.
4 PRINCIPLE AND DETAIL
DESIGN OF THE RPS MODEL
4.1 Overview of the RPS Model
The Ranking-based Partner Selection (RPS) Model
aims to help the trustor find the best partner from
trustees (e.g. honest and dishonest trustees, shown as
white and shadow nodes in Figure 1) with the help of
information shared by advisors (e.g. honest and dis-
honest advisors, shown as white and shadow nodes in
Figure 1 ).
Specifically, the RPS Model is an online-learning
method that comprises Partner Selection (PS) and Pa-
rameter Adjustment (PA) modules, as shown in Fig-
ure 1. PS module introduces trustee ranking to cluster
honest and dishonest advisors into different groups.
Then, the PS module aggregates rankings based on
Partner Selection Strategy in Open, Dynamic and Sociable Environments
233
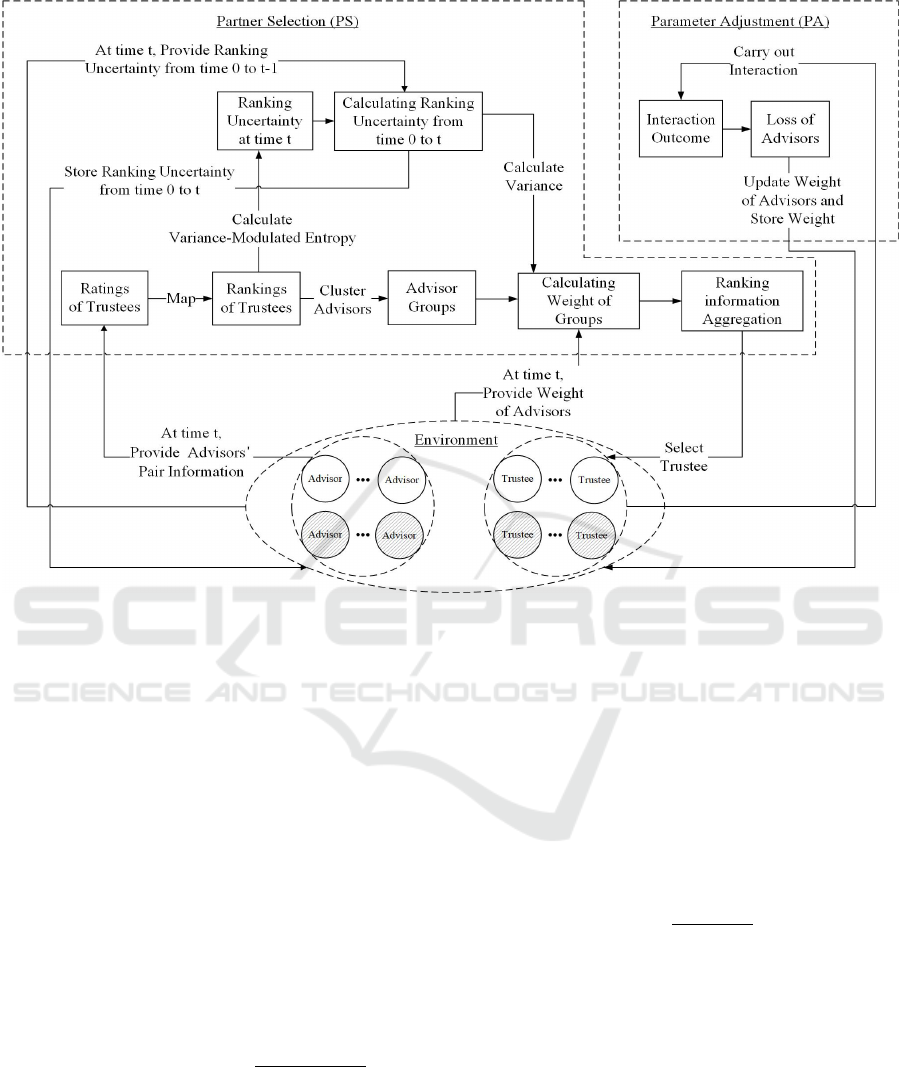
Figure 1: Snapshot of the RPS model at time t.
groups and selects a partner based on the average
ranking. PA module adjusts the weights of advisors
based on the interaction outcome between the trustor
and partner.
4.2 Partner Selection Module
At the time t, the trustor seeks advisors to share their
direct interaction experiences with trustees and then
receives pair information (p
t
k, j
,n
t
k, j
) from advisor a
k
,
where p
t
k, j
and n
t
k, j
represent the number of success
and failure interactions between a
k
and trustee s
j
.
Then, the pair information (p
t
k, j
,n
t
k, j
) is first transmit-
ted to the Partner Selection (PS) module to calculate
ratings r
t
k, j
by using the BRS method(Josang and Is-
mail, 2002), shown in Equation 1.
r
t
k, j
= BRS(p
t
k, j
,n
t
k, j
) =
p
t
k, j
+ 1
p
t
k, j
+ n
t
k, j
+ 2
(1)
Secondly, the PS module calculates advisors’
rankings of trustees based on ratings by treating the
ranking of trustees as the probabilistic tendency to se-
lect a partner from trustees. For example, the prob-
ability vector p
t
k
= [p
t
k,1
,..., p
t
k,m
] represents advisor
a
k
’s partner selection probability on m trustees at time
t. Besides, we make an assumption about the Map-
ping relations between ratings and rankings.
Assumption 1: Advisors are more likely to select
trustees with high ratings as partners. For exam-
ple, in table 1, advisor a
1
’s ratings on trustees are
[0.9,0.8,0.3,0.4]. Therefore, p
1,1
>p
1,2
>p
1,4
>p
1,3
and p
1,1
+p
1,2
+p
1,3
+p
1,4
=1.
Specifically, p
t
k, j
represents the partner selection
probability of advisor a
k
on trustee s
j
at time t, as
shown in Equation 2, where µ = 10:
p
t
k, j
=
e
µr
t
k, j
∑
m
j=1
e
µr
t
k, j
(2)
Thirdly, the PS module treats ranking vector p
t
k
as
advisors’ features on partner selection. Specifically,
we make an assumption on rankings.
Assumption 2: Honest and dishonest advisors have
different rankings of trustees. For example, in an e-
commerce environment, honest reviewers’ rankings
are close to the truth based on true ratings. In con-
trast, dishonest reviewers’ rankings differ from the
truth based on distorted ratings.
Then, the PS module uses a density-based cluster-
ing algorithm DBSCAN (Ester et al., 1996) clusters
honest and dishonest advisors into different groups.
ICAART 2023 - 15th International Conference on Agents and Artificial Intelligence
234

We assume that advisors are clustered into z groups
{G
t
1
,...,G
t
z
} at time t.
Fourthly, the PS module calculates the weights of
groups w
t
G
z
at time t, which are influenced by two fac-
tors: 1) the weights of advisors in the group; 2) the
changing of advisors’ rankings on trustees from time
0 to t.
Specifically, we calculate the ranking uncertainty
λ(p
t
k
) to measure how informative advisors’ rankings
are. The ranking uncertainty calculation refers to the
variance-modulated entropy equation proposed by the
MASA algorithm (Zeynalvand et al., 2018). We treat
the rankings of trustees p
t
k
as a discrete distribution
and use Equations 3, 4 to calculate entropy H(p
t
k
)
and variance σ
2
(p
t
k
) of rankings. Then, the ranking
uncertainty λ(p
t
k
) is calculated based on entropy and
variance, as shown in Equation 5. .
H(p
t
k
) = −
m
∑
j=1
p
t
k, j
· log
p
t
k, j
m
(3)
σ
2
(p
t
k
) =
m
∑
j=1
p
t
k, j
· ( j −
∑
m
j=1
j
m
)
2
(4)
λ(p
t
k
) = (1 − H(p
t
k
))
12σ
2
(p
t
k
)
m
2
−1
(5)
Honest and dishonest advisors have different un-
certainty based on their different rankings. In addi-
tion, we make an assumption about the stability of
advisors’ rankings.
Assumption 3: The changing of honest advisors’
rankings has higher stability than that of dishonest
advisors over time. For example, in an e-commerce
system, honest reviewers tend to give stable ratings
over time. In contrast, dishonest reviewers tend to
change their ratings a lot over time based on attack
strategies. For instance, dishonest reviewers who take
camouflage attacks will give honest ratings first to in-
crease their reputation and give distorted ratings later.
The change in ratings will cause a change in rankings
and thus cause a change in ranking uncertainty.
To test the stability of ranking uncertainty over
time, the PS module first calculates the newest rank-
ing uncertainty of advisors from time 0 to t, which is a
vector of ranking uncertainty: u
t
k
= [λ(p
0
k
),...,λ(p
t
k
)].
Then, the PS module calculates the variance of rank-
ing uncertainty σ
2
(u
t
k
) to test the ranking stability of
advisors, shown in Equation 6.
σ
2
(u
t
k
) =
∑
t
t
′
=0
(λ(p
t
′
k
) −
∑
t
t
′
=0
λ(p
t
′
k
)
t
)
2
t
(6)
Then, the PS module calculates the weights of
groups w
t
G
z
based on the weights of advisors w
t
k
in the
group and the variance of ranking uncertainty σ
2
(u
t
k
),
shown in Equation 7, where A
z
represents set of advi-
sors in the group G
z
, and |A
z
| represents the number
of advisors in A
z
.
p
|A
z
| represents that the number
of advisors influences the weights of groups. For ex-
ample, in social networks, groups with a high number
of users have more significant influence.
w
t
G
z
=
∑
a
k
∈A
z
w
t
k
|A
z
|
·
p
|A
z
| · e
−σ
2
(u
t
k
)
(7)
Fifthly, the PS module aggregates rankings and
calculates averaged ranking p
t
based on groups,
shown in Equation 8.
p
t
=
∑
z
z
′
=1
w
t
G
′
z
·
∑
a
k
∈A
z
w
t
k
·p
t
k
∑
a
k
∈A
z
w
t
k
∑
z
z
′
=1
w
t
G
′
z
(8)
Last, the PS module selects the top trustee s
j
with
the highest probability value p
t
j
of averaged ranking
p
t
as the partner (e.g. max(p
t
) = p
t
j
).
4.3 Parameter Adjustment Module
After receiving the recommended partner from the PS
module, the trustor b
i
interacts with partner s
j
and
gets an outcome o
t
i, j
. Then, the PA module calculates
the loss of advisors based on o
t
i, j
. Specifically, the PA
module calculates two losses for advisors: 1) the pre-
diction loss; 2) the recommendation loss, as shown in
Equations 9 and 10.
P{o
t
i, j
= 1} = rb
j
P{ f
t
k, j
= 1} = r
t
k, j
pl
t
k
= | f
t
k, j
− o
t
i, j
|
(9)
The prediction loss pl
t
k
is calculated based on the
difference between the advisors’ predictions about the
outcome and the trustor’s true interaction outcome.
Specifically, the trustor b
i
(resp. advisor a
k
) predicts
partner s
j
has a probability of rb
j
(resp. r
t
k, j
) to con-
duct a successful interaction, where rb
j
and r
t
k, j
are
s
j
’s reliability and a
k
’s rating on s
j
, respectively.
(
rl
t
k
= −1, i f max(p
t
k
) = p
t
k, j
∧ o
t
i, j
= 1
rl
t
k
= 1, i f max(p
t
k
) = p
t
k, j
∧ o
t
i, j
= 0
(10)
The recommendation loss rl
t
k
is calculated for ad-
visors whose top trustee of rankings equals the se-
lected partner s
j
. When outcome o
t
i, j
= 1 (resp. o
t
i, j
=
0), advisor a
k
’s recommendation is accurate (resp. in-
accurate). Correspondingly, setting rl
t
k
= −1 (resp.
rl
t
k
= 1) to increase (resp. reduce) a
k
’s weight.
Partner Selection Strategy in Open, Dynamic and Sociable Environments
235

Finally, the PA module adjusts the weights of ad-
visors based on the loss of advisors, as shown in
Equation 11, which refers to the weight updating
method proposed in ITEA (Parhizkar et al., 2019;
Parhizkar et al., 2020). Besides, η =
p
8 · ln(n)/T ,
where n is the number of advisors, and T is the total
interaction number between the trustor and partner.
w
t
k
= w
t−1
k
· e
−ηpl
t
k
· e
−ηrl
t
k
(11)
The specific procedure of the RPS model is shown
in Algorithm 1.
Algorithm 1: The RPS Model.
Data: Trustors {b
i
|i = 1, ..., x}, trustees
{s
j
| j = 1, ..., m}, advisors
{a
k
|k = 1,...,n}, and interaction
numbers T
1 Sets advisors’ weights at time
0 : w
0
k
=
1
n
,1 ≤ k ≤ n ;
2 Sets advisors’ ranking uncertainty at time
0 : u
0
k
= [] ;
3 for t = 1 to T do
4 b
i
receives advisors’ pair information of
trustees:
(p
t
k, j
,n
t
k, j
),1 ≤ k ≤ n,1 ≤ j ≤ m ;
5 Calculates advisors’ ratings of trustees:
r
t
k, j
∈ [0,1];
6 Calculates advisors’ rankings of trustees
p
t
k
= [p
t
k,1
,..., p
t
k,m
];
7 Clusters advisors into z groups:
G
t
1
,...,G
t
z
;
8 Calculates of advisors’ ranking
uncertainty: λ(p
t
k
);
9 Calculates the ranking uncertainty from
time 0 to t : u
t
k
= u
t−1
k
.append(λ(p
t
k
)) ;
10 Calculates advisors’ ranking stability:
σ
2
(u
t
k
) ;
11 Calculates weights of groups: w
t
G
z
′
,
1 ≤ z
′
≤ z;
12 Calculates an averaged ranking based on
groups p
t
= [p
t
1
,..., p
t
m
];
13 Select s
j
with the highest p
t
j
as partner ;
14 Observes interaction outcome
o
t
i, j
∈ {0,1} between b
i
and s
j
;
15 Calculates advisors’ predition loss pl
t
k
and recommendation loss rl
t
k
;
16 Updates weights of advisors w
t
k
at time t,
1 ≤ k ≤ n ;
17 end
Step 1: (Line 1-3) Initializing model parameters. At
the time 0, assigning an averaged weight to each ad-
visor: w
0
k
=
1
n
, and using an empty array to represent
advisors’ ranking uncertainty: u
0
k
= []. At the begin-
ning of time point t in time period [1, T ], the trustor b
i
receives advisors’ pair information, where (p
t
k, j
,n
t
k, j
)
represents advisor a
k
about its success and failure in-
teraction numbers with trustee s
j
. Then, b
i
transmits
pair information to the PS module to select a partner.
Step 2: (Line 3-7) Clustering advisors into groups
based on their sharing information. Firstly, the PS
module calculates the advisor’s ratings on trustees
based on Equation 1, where r
t
k, j
represents advisor
a
k
’s estimation about the reliability of trustee s
j
. Sec-
ondly, the PS module transfers ratings to advisors’
trustee rankings based on Equation 2, where p
t
k, j
rep-
resents advisor a
k
’s probability of selecting trustee s
j
as a partner. Thirdly, the PS module uses the DB-
SCAN algorithm to cluster advisors based on their
rankings into z groups: G
t
1
,...,G
t
z
. This step aims
to cluster honest and dishonest advisors into different
groups.
Step 3: (Line 8-13) Selecting a partner based on
groups’ rankings. Firstly, the PS module calculates
the stability of advisors’ ranking uncertainty from
time 0 to t to figure out dishonest advisors with fluctu-
ating rankings. Specifically, the PS module calculates
the ranking uncertainty based on Equations 3, 4 and
5, where λ(p
t
k
) represents advisor a
k
’s ranking uncer-
tainty at time t. Then, the PS module calculates the
ranking uncertainty from time 0 to t (e.g. array u
t
k
) by
appending λ(p
t
k
) to array u
t−1
k
. Later, the PS module
calculates advisors’ ranking stability σ
2
(u
t
k
) based on
Equation 6. After that, the PS module uses Equation 7
to calculate the weights of groups (e.g. w
t
G
1
,...,w
t
G
z
)
based on the weights of advisors in groups and the
ranking stability of advisors. Finally, the PS module
aggregates groups’ rankings to calculate an averaged
ranking p
t
, and select trustee s
j
with the highest prob-
ability p
t
j
as the partner.
Step 4: (Line 14-16) Parameter adjustment based
based on the trustor’s feedback. Specifically, the PA
module first records the interaction outcome o
t
i, j
be-
tween trustor b
i
and partner s
j
, where value o
t
i, j
= 1
represents success (resp. o
t
i, j
= 0 represents failure).
Secondly, the PA module uses Equation 9 to calcu-
late advisors’ prediction loss pl
t
k
by comparing advi-
sors’ estimation of the outcome and the trustor’s true
outcome. Then, the PA module uses Equation 10 to
calculate advisors’ recommendation loss rl
t
k
by giving
a reward (resp. punish) to advisors whose first order
trustee is the partner when o
t
i, j
= 1 (resp. o
t
i, j
= 0).
Finally, based on prediction loss pl
t
k
and recommen-
dation loss rl
t
k
, the PA module updates the weights of
ICAART 2023 - 15th International Conference on Agents and Artificial Intelligence
236

advisors at time t by using Equation 11.
5 EXPERIMENT
The experiments contain 1 trustor, 10 trustees (5 hon-
est and 5 dishonest), and 100 advisors. Each trustee
has a reliability value, sampled uniformly and ran-
domly from the values 0.1,0.2,...,0.9, where the reli-
abilities of honest (resp. dishonest) trustees are higher
than or equal to (resp. lower than) 0.5. In the pre-
treatment stage, we let all advisors interact directly
with the trustees to gain direct trust information about
them. We execute three million interactions between
advisors and trustees to make pretreatment more ac-
curate. Specifically, for each interaction, an advisor
is randomly selected from the pool of 100. Then, the
advisor randomly selects trustees from the pool of 10.
Each advisor records the success and failure interac-
tions with trustees as the number of positive outcomes
p and negative outcomes n. The honest advisors will
give the pair (p, n) to the trustor. In contrast, the dis-
honest advisors will give distorted pair (p
′
,n
′
) to the
trustor based on their attack strategies shown in Sec-
tion 5.1.
5.1 Advisor Settings
Before setting different types of advisors, we ran-
domly select a set DA of dishonest advisors based on
a given dishonest ratio. The advisor settings refer to
the settings of the ITEA model(Parhizkar et al., 2019;
Parhizkar et al., 2020) and ACT model (Yu et al.,
2014).
Setting 1: Partly Random (PR) Advisors. Each PR
advisor a
k
∈ DA first chooses trustees s
j
for which it
will offer distorted pair information based on a 50%
probability. Then, randomly creating a rating value
r ∈ (0,1) and computing the corresponding distorted
pair (p,n) based on Equation 1. For the remaining
trustees, a
k
will offer honest pair information.
Setting 2: BM(Badmouthing)/BS(Ballot-Stuffing)
Advisors. For each BM/BS advisor a
k
∈ DA, it
first randomly chooses trustees s
j
for which it will
offer distorted advice based on a 50% probability.
Then, it selects the distorted pair (p,n) with the low-
est(highest) BRS(p
j
,n
j
) value among s
j
’s all the in-
teraction experiences during the pretreatment process.
For the remaining trustees, a
k
will offer honest advice.
Setting 3: Additive BM/BS (ABM/ABS) Advisors.
For each ABM advisor a
k
∈ DA, it gives a distorted
pair for each trustee s
j
. a
k
first randomly creates a rat-
ing value r ∈ (0.8,1), and calculate a new rating value
r
′
=
p
k, j
+1
p
k, j
+n
k, j
+2
− r based on its own experiences with
trustee s
j
. When r
′
> 0, creating distorted pair (p,n)
with BRS(p,n) = r
′
. Otherwise, creating distorted
pair (0, p
k, j
+ n
k, j
). For each ABS advisor a
k
∈ DA,
it calculates a value r
′
=
p
k, j
+1
p
k, j
+n
k, j
+2
+ r. When r
′
<
1, creating distorted pair (p,n) with BRS(p,n) = r
′
.
Otherwise, creating distorted pair (p
k, j
+ n
k, j
,0).
Setting 4: All-Negative/All-positive (AN/AP) Advi-
sors. Each AN and AP advisor a
k
∈ DA gives pair (0,
10000) and pair (10000, 0) for each trustee s
j
, respec-
tively.
Setting 5: Fully random (FR) Advisors. Each FR
advisor a
k
∈ DA works like PR advisors in Setting 1,
but it will offer distorted information for all trustees.
Setting 6: Selective BM/BS (SBM/SBS) Advisors.
For each SBM advisor a
k
∈ DA, it gives distorted pair
(0, p
k, j
+ n
k, j
) for trustees s
j
when BRS(p
k, j
,n
k, j
) >
0.5, and gives honest advice for the remain trustees.
For each SBS advisor a
k
∈ DA, it gives distorted pair
(p
k, j
+ n
k, j
,0) for trustees s
j
when BRS(p
k, j
,n
k, j
) <
0.5, and gives honest advice for the remain trustees.
5.2 Evaluation Methods
1) Relative Frequency of Unsuccessful Interactions
(RFU). RFU is introduced by ITEA model (Parhizkar
et al., 2019; Parhizkar et al., 2020) to evaluate a trust
system based on the fraction of the number of nega-
tive interactions over the total number of interactions,
as shown in Equation 12, where n
it
and p
it
represents
the number of negative and positive interactions. Be-
sides, Yu et al (Yu et al., 2014) also uses a similar
evaluation method.
RFU =
n
it
n
it
+ p
it
(12)
2) Relative Frequency of Unsuccessful Partner Se-
lections (RFUPS). RFU is calculated based on prob-
ability and influenced by the total interaction num-
bers. For example, a trustee with a reliability of 0.9 is
treated very honest in environments, but it still has a
probability of 10% to offer unqualified service. When
there are not enough interactions, their advantages are
difficult to highlight compared with a trustee having
a reliability of 0.8. Therefore, we will evaluate the
system based on how often it selects the best partner
with the highest reliability in environments, which we
call the Relative Frequency of Unsuccessful Partner
Selections (RFUPS). RFUPS is calculated based on
Equation 13, where n
ps
and p
ps
represent the number
of unsuccessful and successful selections of the best
partner.
RFUPS =
n
ps
n
ps
+ p
ps
(13)
Partner Selection Strategy in Open, Dynamic and Sociable Environments
237

5.3 Results
Table 3: RFU/RFUPS for 50 interactions between trustor
and trustees without Whitewashing and Camouflage at-
tacks.
Ratio 90% 50% 10%
PR
RPS 0.171/0.112 0.124/0.016 0.126/0.022
ITEA 0.177/0.202 0.134/0.016 0.118/0.000
BM
RPS 0.111/0.015 0.117/0.000 0.123/0.000
ITEA 0.119/0.017 0.129/0.000 0.124/0.000
BS
RPS 0.111/0.000 0.115/0.000 0.122/0.000
ITEA 0.196/0.000 0.124/0.000 0.126/0.000
ABM
RPS 0.130/0.000 0.110/0.000 0.120/0.000
ITEA 0.109/0.000 0.112/0.000 0.126/0.000
ABS
RPS 0.110/0.000 0.122/0.000 0.130/0.000
ITEA 0.104/0.000 0.129/0.000 0.121/0.000
AN
RPS 0.123/0.000 0.124/0.000 0.139/0.000
ITEA 0.122/0.000 0.119/0.000 0.137/0.000
AP
RPS 0.135/0.000 0.129/0.000 0.137/0.000
ITEA 0.124/0.000 0.122/0.000 0.120/0.000
FR
RPS 0.150/0.069 0.132/0.000 0.115/0.000
ITEA 0.176/0.237 0.118/0.007 0.120/0.000
SBM
RPS 0.366/0.584 0.139/0.042 0.127/0.000
ITEA 0.601/0.946 0.159/0.101 0.126/0.000
SBS
RPS 0.174/0.072 0.134/0.004 0.136/0.000
ITEA 0.199/0.147 0.125/0.003 0.142/0.000
In the experiments, we select three ratios of dishon-
est advisors (e.g. 90%, 50% and 10%) to represent
the worst-case, moderate-case and light-case of unfair
rating attacks. Besides, we select ten types of dishon-
est advisors (e.g. PR, BM, BS, ABM, ABS, AN, AP,
FR, SBM, and SBS), as shown in Section 5.1. We
execute each ratio and advisor type 50 times to cal-
culate an average value. For each time, we set 50 in-
teractions between the trustor and partner and record
the outcome of interactions and partner selections to
calculate RFU and RFUPS, as shown in Section 5.2.
In addition, we compare three kinds of unfair rating
attacks in all settings: 1) attacks without Whitewash-
ing and Camouflage, as shown in Table 3; 2) attacks
with Whitewashing, as shown in Table 4, where dis-
honest advisors change a new identity at the begin-
Table 4: RFU/RFUPS for 50 interactions between trustor
and trustees with Whitewashing attacks.
Ratio 90% 50% 10%
PR
RPS 0.140/0.012 0.134/0.002 0.121/0.000
ITEA 0.170/0.171 0.130/0.006 0.120/0.000
BM
RPS 0.132/0.003 0.115/0.000 0.122/0.000
ITEA 0.141/0.014 0.132/0.000 0.116/0.000
BS
RPS 0.132/0.000 0.129/0.000 0.128/0.000
ITEA 0.128/0.000 0.126/0.000 0.142/0.000
ABM
RPS 0.115/0.000 0.122/0.000 0.111/0.000
ITEA 0.120/0.000 0.134/0.000 0.119/0.000
ABS
RPS 0.136/0.000 0.131/0.000 0.121/0.000
ITEA 0.123/0.000 0.130/0.000 0.132/0.000
AN
RPS 0.130/0.000 0.127/0.000 0.120/0.000
ITEA 0.137/0.000 0.127/0.000 0.109/0.000
AP
RPS 0.144/0.000 0.118/0.000 0.134/0.000
ITEA 0.129/0.000 0.125/0.000 0.148/0.000
FR
RPS 0.134/0.016 0.114/0.000 0.113/0.000
ITEA 0.153/0.139 0.116/0.003 0.115/0.000
SBM
RPS 0.391/0.649 0.179/0.107 0.158/0.018
ITEA 0.599/0.968 0.195/0.155 0.130/0.000
SBS
RPS 0.160/0.049 0.116/0.004 0.140/0.000
ITEA 0.197/0.160 0.128/0.003 0.125/0.000
ning of each interaction; 3) attacks with Camouflage,
as shown in Table 5, where dishonest advisors pretend
to be honest in some of the first interactions (e.g. first
25 interactions) and attack later (e.g. remaining 25
interactions).
We compare the RPS model with ITEA in all ex-
periments. For evaluation criteria RFU, if RFU
IT EA
−
RFU
RPS
≥ 0.01 (resp. RFU
RPS
− RFU
IT EA
≥ 0.01),
RPS (resp. ITEA) model is a significant winner, and
its entry shows in bold. When no winner exists, both
entries of RPS and ITEA show in bold. The winner
determination of RFUPS is similar to RFU.
In comparison, the RPS model performs better
in coping with the worst-case and moderate-case of
unfair rating attacks with/without Whitewashing and
Camouflage. Specifically, the RPS model has more
accuracy (e.g. the lower RFU and RFUPS) than ITEA
to cope with ten kinds of dishonest advisors, espe-
cially for PR, FR, SBM and SBS advisors. For ex-
ICAART 2023 - 15th International Conference on Agents and Artificial Intelligence
238

Table 5: RFU/RFUPS for 50 interactions between trustor
and trustees with Camouflage attacks.
Ratio 90% 50% 10%
PR
RPS 0.163/0.107 0.127/0.021 0.121/0.010
ITEA 0.195/0.218 0.125/0.041 0.115/0.000
BM
RPS 0.120/0.024 0.120/0.007 0.112/0.000
ITEA 0.123/0.040 0.128/0.007 0.121/0.000
BS
RPS 0.119/0.000 0.120/0.000 0.106/0.000
ITEA 0.119/0.000 0.124/0.000 0.113/0.000
ABM
RPS 0.134/0.000 0.126/0.000 0.140/0.000
ITEA 0.120/0.000 0.135/0.000 0.151/0.000
ABS
RPS 0.104/0.000 0.124/0.000 0.124/0.000
ITEA 0.096/0.000 0.109/0.000 0.113/0.000
AN
RPS 0.128/0.000 0.124/0.000 0.117/0.000
ITEA 0.143/0.000 0.124/0.000 0.120/0.000
AP
RPS 0.120/0.000 0.121/0.000 0.142/0.000
ITEA 0.132/0.000 0.126/0.000 0.138/0.000
FR
RPS 0.208/0.186 0.142/0.022 0.140/0.002
ITEA 0.206/0.295 0.148/0.034 0.126/0.000
SBM
RPS 0.275/0.366 0.155/0.082 0.129/0.010
ITEA 0.374/0.496 0.178/0.124 0.125/0.000
SBS
RPS 0.169/0.090 0.130/0.012 0.120/0.000
ITEA 0.189/0.120 0.139/0.012 0.122/0.000
ample, in Table 3, under the ratio of 90% SBM advi-
sors, the RPS model has a failure rate of 0.584 (resp.
0.366) in selecting the best partner (resp. conduct
success interactions). In contrast, the ITEA model
shows a higher failure rate of 0.946 (resp. 0.601) in
partner selection (resp. interaction). Similar com-
parison results can be found under the ratio of 50%
SBM advisors. Besides, the RPS model has simi-
lar advantages in Whitewashing and Camouflage at-
tacks, as shown in Tables 4 and 5. Under worst
cases and moderate cases, RPS outperforms ITEA in
coping with SBM advisors because of two reasons:
1) the RPS model aggregates information based on
groups, which reduces the amount of noise brought
by large numbers of dishonest advisors; 2) the RPS
model introduces recommendation loss, which pun-
ishes dishonest advisors who have no prediction loss
on recommending dishonest trustees. Those advisors
give true (resp. few) ratings to dishonest (resp. hon-
est) trustees, which makes honest trustees cannot be
recommended based on classical rating aggregation
methods (Teacy et al., 2006; Parhizkar et al., 2019).
However, the RPS model slightly underperforms
ITEA in some light-case of unfair rating attacks
with/without Whitewashing and Camouflage. For ex-
ample, For example, in Table 3, under the ratio of
10% PR advisors, the RPS model has a failure rate
of 0.022 in selecting the best partner, compared with
ITEA’s rate of 0.000. Similar results can be found in
SBM advisors with Whitewashing attacks and PR and
SBM advisors with Camouflage attacks, as shown in
Tables 4 and 5. Under the low cases, the RPS model
was beaten by ITEA in coping with SBM and PR ad-
visors for one reason: noises brought by group ag-
gregations might exceed that of advisor aggregations
when the fraction of dishonest groups is greater than
that of dishonest advisors. For example, PR advisors
randomly give distorted pair information for honest
and dishonest trustees, making them have little sim-
ilarity with each other, and might be clustered into
multiple groups even under low cases.
Although we got the promising performances of
our proposed RPS, we performed experiments on syn-
thetic datasets as previous papers do (Parhizkar et al.,
2019; Parhizkar et al., 2020; Yu et al., 2014). In the
future, we will compare the RPS model with more
classical trust models on real-world datasets.
6 CONCLUSION
This paper proposes a Ranking-Based Partner Selec-
tion (RPS) model to solve the partner selection prob-
lem in unfair rating attacks. Compared with classi-
cal rating-based methods, RPS introduces the rank-
ing of trustees as a supplement, which helps to re-
duce noise brought by dishonest advisors, especially
when attackers are the majority. Besides, RPS is an
online-learning method that can update model param-
eters based on the interaction outcome between the
trustor and partner and evaluate the dynamic changes
in advisors’ rankings.
Experiments show that the PRS model performs
stably in unfair rating attacks with/without White-
washing and Camouflage attacks. Specifically, RPS
outperforms ITEA in most of the worst and moder-
ate cases of unfair rating attacks. However, ITEA
shows better performances with tiny advantages in
some light cases.
Partner Selection Strategy in Open, Dynamic and Sociable Environments
239

ACKNOWLEDGEMENTS
This research is supported by the UPA and IPA schol-
arships from the University of Wollongong for the
Joint PhD Program with Nagoya Institute of Technol-
ogy.
REFERENCES
Ester, M., Kriegel, H.-P., Sander, J., and Xu, X. (1996).
A density-based algorithm for discovering clusters in
large spatial databases with noise. In Proceedings of
the Second International Conference on Knowledge
Discovery and Data Mining, volume 96, pages 226–
231.
Fang, H. (2013). Trust modeling for opinion evaluation by
coping with subjectivity and dishonesty. In Proceed-
ings of Twenty-Third International Joint Conference
on Artificial Intelligence.
Jiang, S., Zhang, J., and Ong, Y.-S. (2013). An evolu-
tionary model for constructing robust trust networks.
In Proceedings of International Conference on Au-
tonomous Agents and Multiagent Systems, volume 13,
pages 813–820.
Josang, A. and Ismail, R. (2002). The beta reputation sys-
tem. In Proceedings of the 15th Bled Electronic Com-
merce Conference, volume 5, pages 2502–2511.
Liu, S., Zhang, J., Miao, C., Theng, Y.-L., and Kot, A. C.
(2011). iclub: An integrated clustering-based ap-
proach to improve the robustness of reputation sys-
tems. In Proceedings of the 10th International Confer-
ence on Autonomous Agents and Multiagent Systems,
volume 3, pages 1151–1152.
Parhizkar, E., Nikravan, M. H., Holte, R. C., and Zilles,
S. (2020). Combining direct trust and indirect trust
in multi-agent systems. In Proceedings of Inter-
national Joint Conference on Artificial Intelligence,
pages 311–317.
Parhizkar, E., Nikravan, M. H., and Zilles, S. (2019). Indi-
rect trust is simple to establish. In Proceedings of In-
ternational Joint Conference on Artificial Intelligence,
pages 3216–3222.
Regan, K., Poupart, P., and Cohen, R. (2006). Bayesian
reputation modeling in e-marketplaces sensitive to
subjectivity, deception and change. In Proceedings
of AAAI Conference on Artificial Intelligence, pages
1206–1212.
Teacy, W., Luke, M., Luck, Rogers, A., and Jennings, N. R.
(2012). An efficient and versatile approach to trust
and reputation using hierarchical bayesian modelling.
Artificial Intelligence, 193:149–185.
Teacy, W. T., Patel, J., Jennings, N. R., and Luck, M.
(2006). Travos: Trust and reputation in the context
of inaccurate information sources. In Proceedings
of Autonomous Agents and Multi-Agent Systems, vol-
ume 12, pages 183–198.
Wang, D., Muller, T., Irissappane, A. A., Zhang, J., and Liu,
Y. (2015). Using information theory to improve the
robustness of trust systems. In Proceedings of Inter-
national Conference on Autonomous Agents and Mul-
tiagent Systems, pages 791–799.
Wang, D., Muller, T., Zhang, J., and Liu, Y. (2019). In-
formation theoretical analysis of unfair rating attacks
under subjectivity. IEEE Transactions on Information
Forensics and Security, 15:816–828.
Yu, H., Shen, Z., Miao, C., An, B., and Leung, C. (2014).
Filtering trust opinions through reinforcement learn-
ing. Decision Support Systems, 66:102–113.
Zeynalvand, L., Zhang, J., Luo, T., and Chen, S. (2018).
Masa: Multi-agent subjectivity alignment for trust-
worthy internet of things. In Proceedings of 2018 21st
International Conference on Information Fusion (FU-
SION), pages 2013–2020.
Zhang, J. and Cohen, R. (2008). Evaluating the trustworthi-
ness of advice about seller agents in e-marketplaces:
A personalized approach. Electronic Commerce Re-
search and Applications, 7(3):330–340.
ICAART 2023 - 15th International Conference on Agents and Artificial Intelligence
240
