
Vegetation Coverage and Urban Amenity Mapping Using Computer
Vision and Machine Learning
Nicholas Karkut
1
, Alexey Kiriluk
1
, Zihao Zhang
2a
and Zhigang Zhu
1,3 b
1
Computer Science Department, The City College of New York - CUNY, New York, NY 10031, U.S.A.
2
Graduate Landscape Architecture Program, The City College of New York - CUNY, New York, NY 10031, U.S.A.
3
PhD Program in Computer Science, The Graduate Center - CUNY, New York, NY 10016, U.S.A.
Keywords: 3D Object Detection, Computer Vision, Image Segmentation, Depth Computation, Landscape Architecture.
Abstract: This paper proposes a computer vision-based workflow that analyses Google 360-degree street views to
understand the quality of urban spaces regarding vegetation coverage and accessibility of urban amenities
such as benches. Image segmentation methods were utilized to produce an annotated image with the amount
of vegetation, sky and street coloration. Two deep learning models were used -- Monodepth2 for depth
detection and YoloV5 for object detection -- to create a 360-degree diagram of vegetation and benches at a
given location. The automated workflow allows non-expert users like planners, designers, and communities
to analyze and evaluate urban environments with Google Street Views. The workflow consists of three
components: (1) user interface for location selection; (2) vegetation analysis, bench detection and depth
estimation; and (3) visualization of vegetation coverage and amenities. The analysis and visualization could
inform better urban design outcomes.
1 INTRODUCTION
Urban vegetation in public spaces can mitigate the
heat island effect, provide shade for visitors, and
serve as habitats for urban wildlife. Analyzing and
evaluating urban vegetation coverage and
accessibility to amenities such as benches could
inform better design decisions. Such analyses are
typically done via geospatial information systems
(GIS) and publicly available datasets, such as NYC
OpenData. However, these datasets are not frequently
updated to reflect the most up-to-date conditions.
This paper explores vegetation coverage mapping and
amenity detection using Google Street View (GSV).
The goal is to use computer vision techniques to
analyze 360-degree panoramic photos to create
comprehensible visualization of vegetation coverages
and accessibility to amenities with a web-based
interface.
Google Street View imagery in urban analytics
became a promising area of research over the past few
years (Biljecki and Ito 2021). Researchers often use
the green color to proximate urban plants coverage;
a
https://orcid.org/0000-0003-3630-7955
b
https://orcid.org/0000-0002-9990-1137
thus, many works use the term "greenery" to refer to
urban vegetation coverage. We use vegetation
coverage and greenery interchangeably in this paper.
Yang, et al. (2009, 2020) use GSV to study the
correlation between the amount of or greenery in a
street and building values. Li, et al. (2015) developed
image processing algorithms to automate the
greenery index assessment. Qiu, et al. (2019)
integrated crowdsourcing, computer vision and
machine learning to create a correlation index
between urban design qualities and residents’
satisfaction of the area by analyzing GSV images.
Qiu, et al. (2021) used a Pyramid Scene Parsing
Network (PSPNet) to calculate the pixel ratios of
individual features as view indices from GSV images
and constructed a machine learning model capable of
recognizing 35 kinds of streetscape elements.
We also include real-time 3D analysis and
detection of important urban amenities (e.g., park
benches) to provide further information for urban
design analysis. Many methods have been proposed
for object detection in urban scenes. These includes
text detection and recognition (Du et al., 2012; Zhu et
Karkut, N., Kiriluk, A., Zhang, Z. and Zhu, Z.
Vegetation Coverage and Urban Amenity Mapping Using Computer Vision and Machine Learning.
DOI: 10.5220/0011705100003497
In Proceedings of the 3rd International Conference on Image Processing and Vision Engineering (IMPROVE 2023), pages 67-75
ISBN: 978-989-758-642-2; ISSN: 2795-4943
Copyright
c
2023 by SCITEPRESS – Science and Technology Publications, Lda. Under CC license (CC BY-NC-ND 4.0)
67
al., 2016), zebra crossing detection (Ahmetovic et al.,
2015), curb detection (Cheng et al., 2018; Sun and
Jacobs, 2017) and storefront accessibility detection
(Wang et al., 2022). Du et al. (2012) and Zhu et al.
(2016) focus on detecting text in a street environment.
Cheng et al. (2018) propose a framework to detect
road and sidewalk using stereo vision in the urban
regions. Sun and Jacobs (2017) aim to find missing
curb ramps at street intersections in the city by using
the pairwise existence of the curb ramps. In a recent
work, Wang et al. (2022) propose a multi-stage
context learning framework for storefront
accessibility detection, by using the specific relations
between categories.
Most of these analytical tools are developed by
and for experts with knowledge in artificial
intelligence (AI) and machine learning (M/L) and
skills programming. In this paper, we propose a web
application that allow any users, including non-
experts, to analyze a panoramic image with an
interface similar to Google Maps, without relying on
an AI/ML research team with coding skills. In
addition, the users conduct analysis at a local scale,
which is useful for site-specific designs. Our project,
with automated analytic tools and a user-friendly
interface, could open a path for more designers and
community members to take part in utilizing
computer vision and machine learning techniques to
democratize and exploit GSV images as a public
dataset in urban design and analytics.
The main contributions of this study are as
follows:
• A user-friendly interface: the web interface is
similar to Google Maps. Users can zoom in and
out, move around, and analyze vegetation and
amenities by dropping the Google Maps Pegman
onto a location of interest.
• Automated content analysis: the web interface
integrates (1) an image segmentation algorithm
detecting vegetation, sky, and street within GSV
images; (2) a YoloV5 deep neural network
machine learning model to detect amenities such
as benches; and (3) construction of a diagram of
tree coverage and benches using Monodepth2, a
depth estimation algorithm, and image
segmentation pixel-mapping.
• Adaptive content visualization with real-time map
marker SVG (scalable vector graphics) creation
and colorized GSV images indicating vegetation
and sky pixels, with various levels of image
resolutions.
The paper is organized as the following. After we
have introduced our work and discussed related work
on vegetation mapping and amenity detection in
Section 1, Section 2 will provide a brief overview of
the overall system. Section 3 lays out the user
interface for journey and navigation. Section 4
focuses on content analysis including vegetation
analysis, bench detection and depth estimation.
Section 5 discusses various aspects in visualizing the
detected contents, in terms of generating vegetation
images of very resolution levels, and bench markers.
Section 6 concludes the work with some future
research directions.
2 SYSTEM OVERVIEW
The most important characteristic of our web
application is the ease of use and accessibility of the
data gathered. For this, we constructed an application
model whose user journey is as easy as possible.
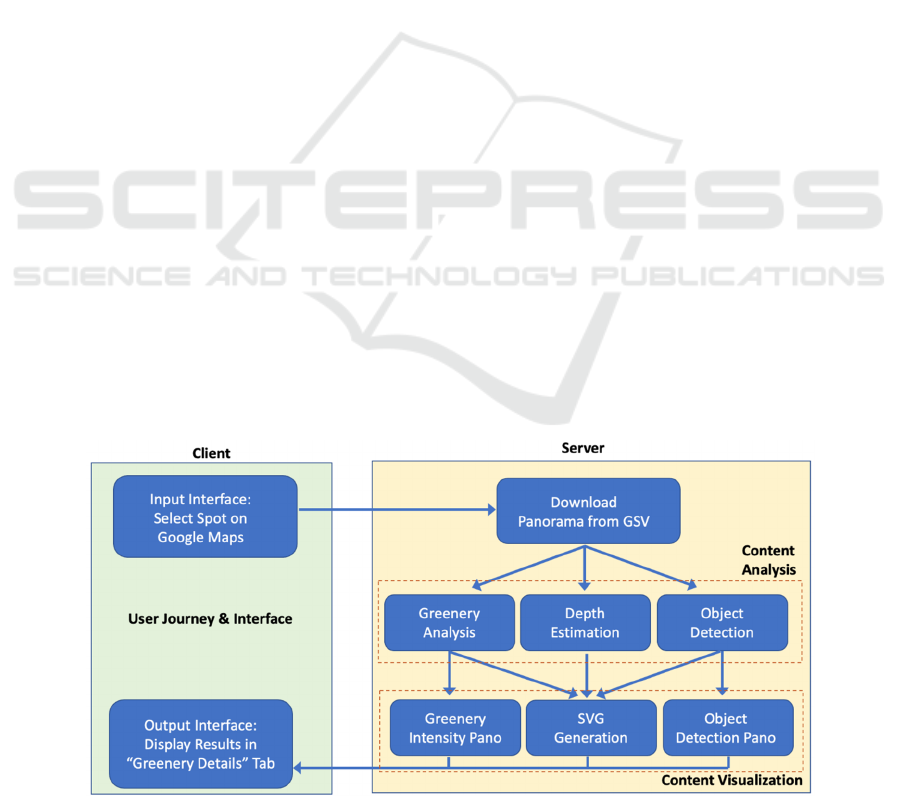
Figure 1 shows the workflow, including a user
Figure 1: System workflow: user journey & interface, content analysis, and content visualization.
IMPROVE 2023 - 3rd International Conference on Image Processing and Vision Engineering
68

journey and interface component, a content analysis
component, and a content visualization component. A
video showing the pilot web greenery app can be
accessed by following the link here
3
and the code can
be found at the project’s GitHub page
4
.
When the user selects the preferred point on
Google Maps with the user journey and interface, the
coordinates of that spot will be sent to a server. The
server will download a GSV panorama and perform
several analyses in the content analysis component.
The vegetation coverage analysis (“Greenery
Analysis”) module using color cues will generate
vegetation, sky, and street layout within the
panorama. The urban amenity detection (“Object
Detection”) module utilizing pre-trained YoloV5
models (Ultralytics, 2020) can detect various desired
objects; in this project, it detects urban amenities such
as benches in a park. Finally, the depth estimation
module using MonoDepth2 pre-trained model
(Nianticlabs, 2019) provides a meter estimation of
how far the detected objects are from the center of the
panorama, offering more accurate location
information to annotate the vegetation coverage and
amenities on the map with scalable vector graphics
(SVG).
The content visualization component contains two
other features: Greenery Intensity Pano shows the
percentage of vegetation the panorama contains and
other metrics on vegetation distribution; and Object
Detection Pano shows the detected amenities
(benches) on the panorama.
In the following three sections we will detail each
of the three components: user journey and interface,
with results of visualization, automated content
analysis, and additional discussions on adaptive
content visualization.
3 USER JOURNEY &
INTERFACE
The user journey would be as follows. Users enter the
website and see Google Maps spanning their whole
browser with an empty Google Maps (Figure 2). Just
like a regular Google Maps, users can zoom in/out,
move around, and explore the world through our
website.
If users want to retrieve vegetation information or
just see the GSV image at a certain location, they
would right-click on a location on the map or drop a
Google Pegman onto the map. The dashboard would
then direct users to the specific panorama chosen,
3
https://youtu.be/ZCyPiqWL7JI
exactly as done in Google Maps. In our user journey
interface, users see a heads-up display, or HUD, in the
lower left corner as shown in Figure 3, which allows
the user to retrieve the “greenery intensity pano” of
the current panorama, and to use two sliders to set the
“object detection font size” for user-friendly amenity
annotation viewing, and set the “greenery pano
resolution”, for selecting the GSV image resolution
used in the vegetation and object detection analyses,
respectively.
Figure 2: Opening dashboard of web application.
Figure 3: Opening panorama of web application.
Figure 4: Dashboard after retrieval of vegetation data, with
an enlarged compass.
3.1 Input and Output Interface
The user sets these two sliders before pressing the
blue button that runs the analyses on the backend
4
https://github.com/ndotkarkut/cv_vegetation_mapping
Vegetation Coverage and Urban Amenity Mapping Using Computer Vision and Machine Learning
69
server. After the user retrieves the “Greenery Details”
from the server, the HUD updates (Figure 4). In this
updated HUD, we can now see added a “Toggle
Greenery Details” button above the lower left HUD
as well as a compass on the lower right. In Figure 4,
we can also see an enlarged compass, which can be
toggled upon clicking of the compass. This compass
shows the locations of the vegetation coverage around
the user. Based on the depth mapping of the
vegetation intensity panorama and objects
(amenities) found in the GSV image, which will be
described in Section 4, we can recreate a 360-degree
map of the user’s surroundings. As the user pans
across the GSV image, the arrow in the middle of the
compass moves to match the view so the user knows
what part of the GSV image is displayed.
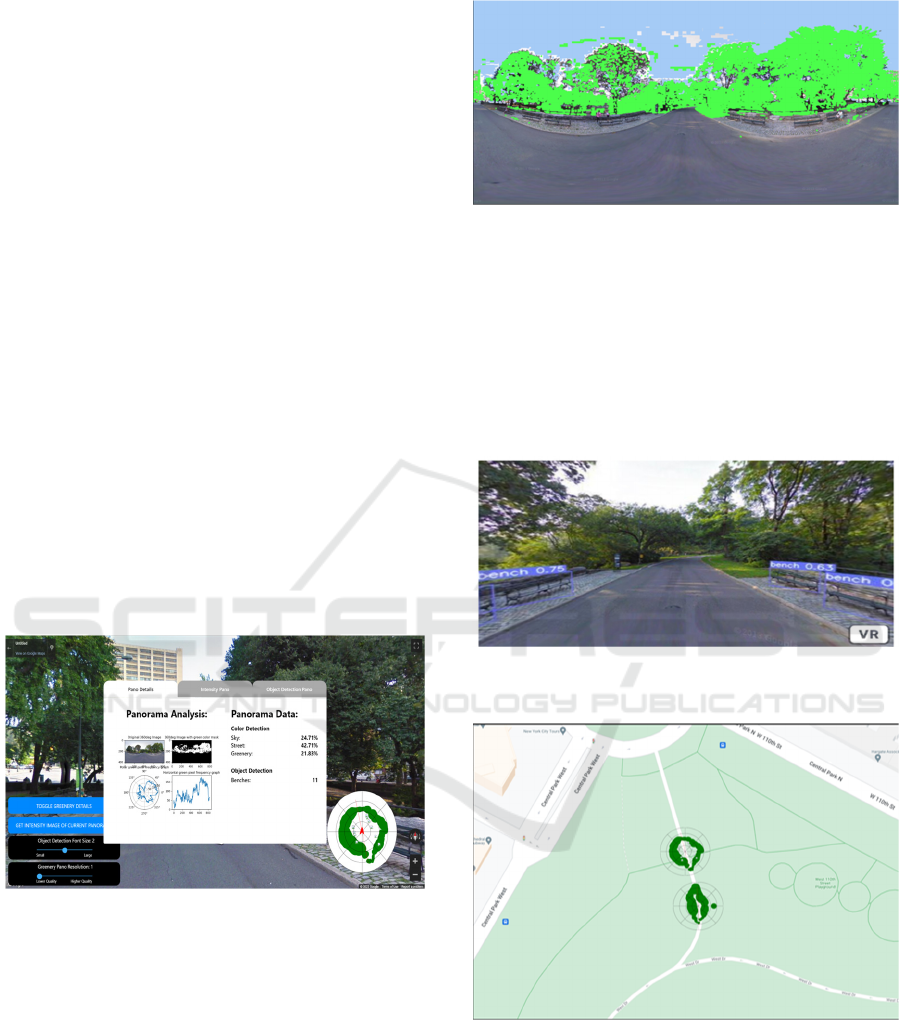
Moreover, if the user toggles Greenery Details, a
3-tabular modal appear in the center of the screen
(Figure 5). This modal has three tabs: Panorama
Details, Vegetation Intensity Pano and Object
Detection Pano. In the Panorama Details tab, we have
a panorama analysis run in Matlab using Python’s
Matplotlib as well as the panorama’s data like its
color analysis and object detection. A later section
will describe how these details are fetched. This tab
is default on opening, so that a user can retrieve all
the details as soon as possible.
Figure 5: Vegetation details modal toggled.
Figure 6 shows how the “Greenery Intensity
Pano” tab looks when active. The intensity panorama
tab shows a miniature GSV image that can be
expanded to full screen or even possibly viewed in
VR mode if a headset or motion & orientation
controls are activated on a mobile device when
pressing the VR button in the bottom right. This
greenery intensity panorama shows all detected
vegetation highlighted in green and all detected sky
coloration as blue (street coloration is also analyzed
but not highlighted in this GSV image).
Figure 6: Greenery Details - Greenery Intensity Pano.
Figure 7 shows the Object Detection Pano Tab
highlighted, and is similar to the Greenery Intensity
Pano tab in every aspect besides the panorama, being
that of the object detection program being run. In the
main map screen (Figure 8), a marker appears on each
analyzed location. The user can click on these
markers to return to the GSV image with the
vegetation details and panoramas.
Figure 7: Greenery Details - Object Detection Pano Tab
with benches detected.
Figure 8: Markers shown on the main map screen.
3.2 Implementation Details
The vegetation details were generated through three
steps: vegetation analysis, marker generation, and
vegetation intensity image generation. Our backend
server receives requests from the web application
through a Node.js server, which can process HTTP
IMPROVE 2023 - 3rd International Conference on Image Processing and Vision Engineering
70

requests and compute results before returning a
response back to the web application. The five
variables sent to the server were the latitude and
longitude of a location, the GSV image ID (the way
that Google Maps tracks the GSV image), the chosen
resolution level (from 1-5), the chosen font size (from
1-3), and the photographer’s heading when taking the
GSV image (This important parameter will be
explained later in Section 5 ). Our Python and
JavaScript code in the server uses these five variables
to perform the three functions mentioned.
4 AUTOMATED SCENE
ANALYSIS
Automated scene analysis includes vegetation
analysis, object detection and depth estimation. We
will detail these three modules in the following
subsections.
4.1 Greenery Analysis
For obtaining an analysis of the vegetation coverage
in Google Street View Images, we have a Python
script that utilizes the OpenCV library for image
processing and MatPlotLib for plotting our results
and visualizing our data using Matlab’s plot UI
elements. Both of these libraries make our
development easier and are optimized for speed so the
computation time is very reasonable.
For obtaining an analysis of the vegetation
coverage in Google Street View Images, we use a
Python script that utilizes the OpenCV library for
image processing and MatPlotLib for plotting our
results and visualizing our data using Matlab’s plot
UI elements. Both of these libraries make our
development easier and are optimized for speed,
therefore a user can select a very high resolution and
most of the time is actually spent to construct the
GSV image from the Google Maps API.
After our server fetches and pieces together the
tiles of a panoramic image retrieved from Google, the
image segmentation algorithm analyzes the GSV
image to identify vegetation. First, we convert our
RGB image to an HSV image, so we can easily work
with the color values of the GSV image pixels. HSV
stands for Hue, Saturation, and Value, which means
that we can find the color green by finding its range
in hue and getting all green values by including every
possible saturation and value. We use this “green”
range to create the green color mask and we construct
a mask image by applying this mask to the original
image where all pixels within the range become value
1 (white) and every other becomes 0 (black). Then,
we highlight the image area with value 1 by replacing
every mask pixel coordinate in our original image
with [75, 255, 75] RGB value, representing green. We
then save this image to be used by our web
application (as shown in Figure 6).
Finally, we want to find the amount of vegetation
by the horizontal axis in our image, which represents
the panning angles of the GSV panorama within 360
o
.
To find out how much vegetation is present
horizontally in the image, we make an array that will
store all of our green pixels by horizontal coordinate
and then we count how many green pixels are in each
column of our image. We then plot this array as the
vertical-axis values and 0 to number_of_columns to
be the horizontal-axis. We also make a polar plot of
this same data ranging from 0o to 360o which will
then be used to create a marker to display in our web
app (as shown in Figure 5).
4.2 Object Detection
To efficiently detect amenities such as benches in a
park in our current implementation, we decided to use
the state-of-the-art recognition software – YoloV5
(Ultralytics, 2020). YoloV5 pre-trained models
already include benches. YoloV5 offers multiple pre-
trained models, based on the amount parameters, their
speed and accuracy. If users do not need to analyze
panoramas in real-time, they can choose the slowest
model that provides the highest accuracy, which is the
YoloV5x model. If processing speed is a concern,
then the users can select a faster model.
Once the pre-trained model is selected, we will
need to modify the inference parameters. Due to the
nature of our project and how benches are usually
situated, we had to adjust a few parameters to get the
best possible result. We reduced the Confidence
Threshold from 0.25 default to 0.2. Some benches are
hard to detect due to their positions on the panorama
and many of them have people sitting on them which
further complicates the detection. At this moment, we
only want YoloV5 to detect benches, so the Classes
parameter has been set to an array containing 13,
which is the code for benches. Lastly, IoU Threshold
has been reduced from default 0.45 to 0.15. Here IoU
(Intersection over Union) is a value used to measure
the overlap of a predicted versus actual bounding box
for an object. Such low value improves the chances
that benches with various situations can be detected.
Vegetation Coverage and Urban Amenity Mapping Using Computer Vision and Machine Learning
71
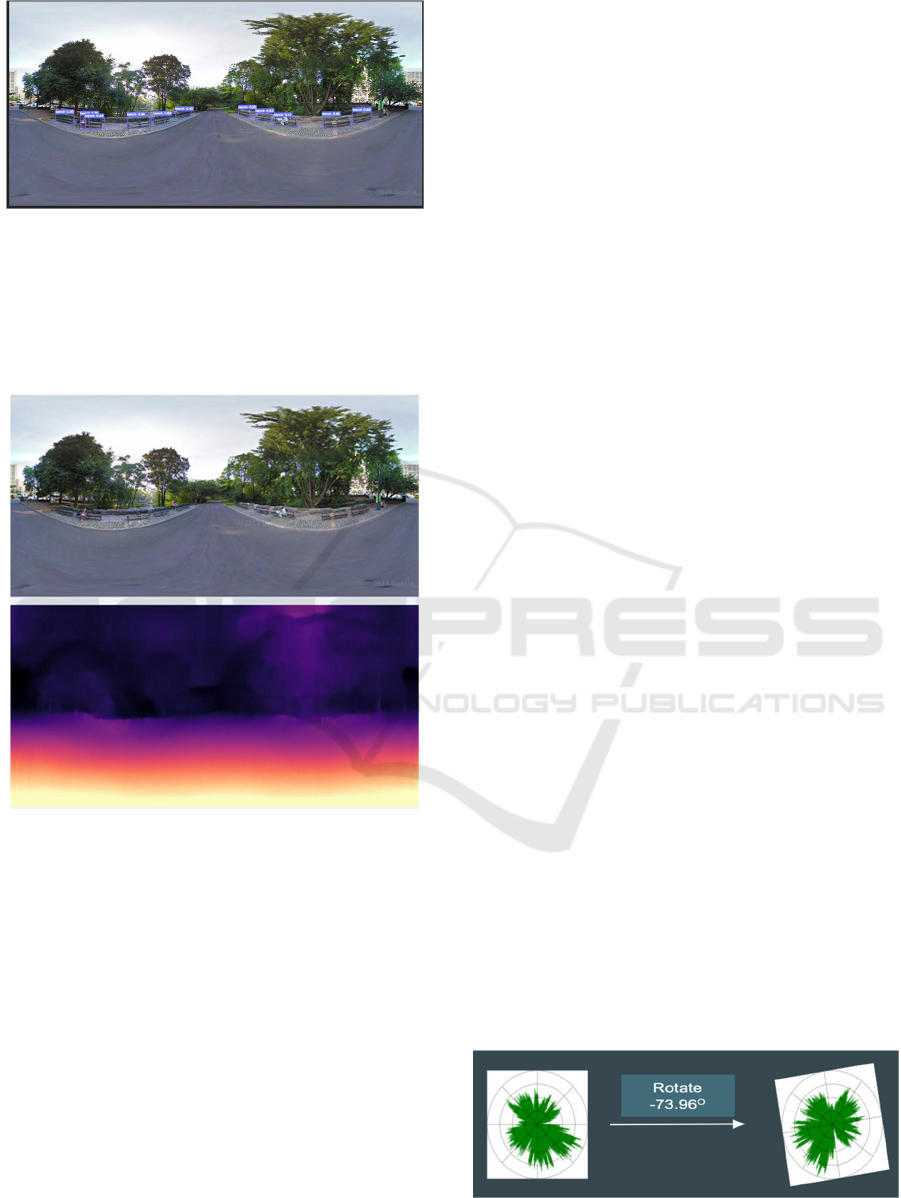
Figure 9: Results of bench detection.
Figure 9 shows the results of applying a pre-
trained YoloV5x model. All visible benches were
identified but the second bench from the left was
identified twice. We believe this model provides
adequate accuracy for the needs of our project.
Figure 10: Depth map (bottom) of a panoramic image (top),
which is the same as the one in Figure 9.
4.3 Depth Estimation
In order to properly display the bench icon on the
SVG, we will need to know how far the bench is from
the center of the projection (i.e., the viewpoint) of the
panorama. To accomplish this, we use the
Monodepth2 pre-trained models (Nianticlabs, 2019).
The difference between modes is in their trained
resolution and whether it was trained on mono or
stereo images. For the purpose of our project, we need
actual depth data, which requires a stereo model. We
also chose the best resolution available, as running
time may not be of high importance to us. Our model
was stereo_1024x320, which was run with a special
parameter -pred_metric_depth.
Monodepth2 also generates a file with estimated
meter depth for each pixel. Now, we know the
bounding box of a bench from YoloV5 detection. We
can retrieve depth information of each pixel of the
bench, and the average will be our final estimated
depth of the bench.
To put the bench in the proper spot on SVG we
also need to know the direction of the bench with
respect to the true north. We already know the
panorama's original heading, which is exactly in the
middle. For example, in Figure 10, the middle of the
panorama is the road which is 160° heading. Then we
find the middle of the bench’s bounding box to
calculate how far it is from the viewpoint of the
panorama.
5 ADAPTIVE CONTENT
VISUALIZATION
Content visualization of vegetation and amenity
object detection includes two considerations:
generation of vegetation and object (bench) markers
on the main map screen, and greenery image
generation with different resolution levels.
5.1 Marker Generation
To create our markers, we use the same concept of
our polar plot described in Section 3 but create an
SVG, an icon that can be interpreted by Google maps
to be a marker in our web app. Furthermore, since
every GSV image is taken at different perspectives
and we want all of our markers to display on our
Google Maps, we would want our polar graph to have
the vegetation coverage shown at true north of our
image when placed on our map. To do this, we will
need to rotate the SVG to take in consideration the
direction the photographer faced when taking the
GSV image. Luckily, Google Maps allows us to get
the photographer’s point of view (POV) when taking
the GSV image, meaning we can send this POV, or
heading as we shall call it from now on, to the server
where it can help us rotate our SVGs (Figure 11).
Figure 11: Example of SVG rotation.
IMPROVE 2023 - 3rd International Conference on Image Processing and Vision Engineering
72
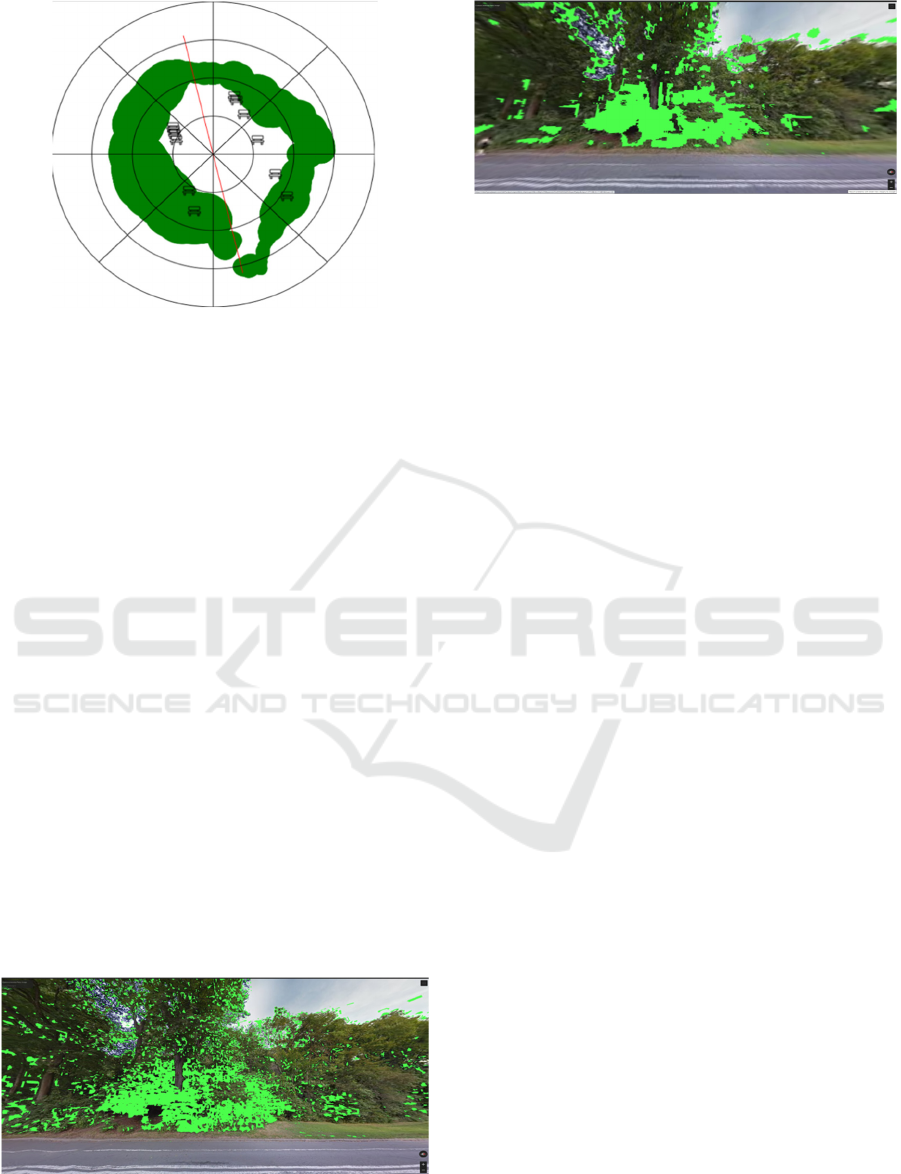
Figure 12: Example of polar graph output from vegetation
analysis.
To place the marker on the map, not just oriented
properly, we also add depth detection to our analysis.
This depth detection allows us to know the distance
from the photographer to every point in the GSV
image and with this information, we can judge how
far away our vegetation and objects are. All these
nodes on the marker give us a heat map of the
vegetation within the image, its proper thickness and
distance away (Figure 12). Lastly, we map our
detected benches onto the image using the same
method, together with the vegetation plot to be
displayed on the main map (as shown in Figure 8).
5.2 Greenery Intensity Image at
Different Resolution Levels
Section 4.1 has described how to generate vegetation
distribution and greenery intensity panorama (Figure
6). We can also take a look at the difference in the
output the greenery intensity image based on
resolution levels. A resolution level of 1 takes the
least amount of time in computation but is very low
in resolution, while a resolution level of 5 takes
significantly longer time in computation but is much
higher in resolution and shows finer details.
Figure 13: Example of part of output GSV image with a
resolution of 3.
Figure 14: Example of part of output GSV image with a
resolution of 1.
Figure 13 (level 3) was able to differentiate more
details than Figure 14 (level 1). Depending on users’
time constraint, objective, or internet connection,
they will can choose between higher resolution and
shorter processing time.
6 CONCLUSION AND FUTURE
WORK
Overall, our real-time analysis web application
proved to be effective in both vegetation and amenity
detection. The website can detect vegetation in any
GSV images and then effectively display our data and
results to the users. A large proponent of our project
was to allow non-expert communities without
knowledge and skills in programming and machine
learning to access the application and analyze any
area where google street view is available. Advancing
the accessibility of computer vision products can
increase social awareness of urban issues. Our web
application could become a powerful community
engagement tool and merits further research.
Many improvements can be made to the
application, such as improving the dashboard user
interface/experience, adding more features like newly
planted tree vs. established tree detection, and
improving the vegetation detection algorithm. Our
project went through many phases before its current
stage of implementation. The first challenge was to
download the GSV images automatically. This was
solved by connecting Google Maps API using a
python script, which allowed us to automate the
process: fetching the GSV images, analyzing the
GSV images and returning them to the browser .
Future work may include the batching of GSV image
analyses to ease the process for users who want to
analyze a larger area with many GSV images.
For a better user experience, the speed of the
application should be improved. For larger resolution
panoramas, the time of analysis increases
exponentially. Shortening the run-time or stream the
Vegetation Coverage and Urban Amenity Mapping Using Computer Vision and Machine Learning
73

data to the client as the analysis goes on would
increase the odds of repeated use by the same user.
Another possibility for future work is scenic route
selection. Based on the vegetation levels detected in
multiple consecutive GSV images, users could ask for
directions from one location to another, but instead of
choosing the fastest or shortest route, they can choose
the most scenic route. This can be especially useful
for tourists of landscape attractions or hiking trails.
Finally, in the current implementation, we use
green colors to index vegetation coverage. This
method will not work if a Google Street View image
is collected in winter when deciduous trees shed their
leaves. Also, this method does not account for urban
plants that are not green. However, using green colors
as a proxy for vegetation coverage can result in an
estimate representative enough in urban design
analytics. In the future, a deep learning model like
Mask R-CNN (Abdulla, 2017) for semantic
segmentation can be applied to improve vegetation
segmentation accuracy. In addition, we use benches
as one example of urban amenities. Future works can
include other types of urban amenities in public
spaces.
ACKNOWLEDGMENTS
The research is supported by the 2022 CCNY
College-wide Research Vision (CRV) Award and a
2022 CUNY Interdisciplinary Research Grant (IRG).
The work is also supported in part by the US Air
Force Office of Scientific Research (AFOSR) via
Award #FA9550-21-1-0082, the US National Science
Foundation (NSF) through Awards #2131186 (CISE-
MSI) and #1827505 (PFI), and the ODNI Intelligence
Community Center for Academic Excellence (IC
CAE) at Rutgers University, USA (#HHM402-19-1-
0003 and #HHM402-18-1-0007).
REFERENCES
Abdulla, W. (2017). Mask R-CNN for object detection and
instance segmentation on Keras and TensorFlow,
Github, [https://github.com/matterport/Mask RCNN]
Ahmetovic, D., Manduchi, R., Coughlan, J. M., & Mascetti,
S. (2015). Zebra crossing spotter: Automatic population
of spatial databases for increased safety of blind
travelers. In Proc. of Int. ACM SIGACCESS Conf. on
Computers and Accessibility, pages 251–258.
Biljecki, F., & Ito, K. (2021). Street view imagery in urban
analytics and GIS: A review. Landscape and Urban
Planning, 215, 104217.
Cheng, M., Zhang, Y., Su, Y., A ́lvarez, J. M., & Kong, H.
(2018). Curb detection for road and sidewalk detection.
IEEE Trans. Vehicular Technology, 67:10330–10342.
Du, Y., Duan, G., & Ai, H. (2012). Context-based text
detection in natural scenes. In Proc. of the IEEE Int.
Conf. on Image Processing, 1857–1860. IEEE.
Li, X., & Ratti, C. (2018). Mapping the spatial distribution
of shade provision of street trees in Boston using google
street view panoramas. Urban Forestry & Urban
Greening, vol. 31, 109–119.
Li, X., Zhang, C., Li, W., Ricard, R., Meng, Q., & Zhang,
W. (2015). Assessing street-level urban greenery using
google street view and a modified Green View index.
Urban Forestry & Urban Greening, 14(3), 675–685.
Liu, Y., Zhang, M., Li, Q., Zhang, T., Yang, L., &. Liu, J.
(2021). Investigation on the distribution patterns and
predictive model of solar radiation in urban street
canyons with panorama images. Sustainable Cities and
Society, vol. 75, p. 103275.
Nianticlabs. (2019). Monodepth2 [Source Code].
https://github.com/nianticlabs/monodepth2
Qiu, S., Psyllidis, A., Bozzon, A., & Houben, G.-J. (2019).
Crowd-mapping urban objects from street-level
imagery. The World Wide Web Conf. on - WWW '19.
Qiu, W., Li, W., Liu, X., & Huang, X. (2021). Subjectively
measured streetscape qualities for Shanghai with large-
scale application of computer vision and machine
learning. Proc. of the 2021 DigitalFUTURES, 242–251.
Sun, J. and Jacobs, D. W. (2017). Seeing what is not there:
Learning context to determine where objects are
missing. In CVPR, 5716–5724.
Stubbings, P., Peskett, J., Rowe, F., & Arribas-Bel, D.
(2019). A hierarchical urban forest index using street-
level imagery and deep learning. Remote Sensing,
11(12), p. 1395.
Tang, Z., Ye, Y., Jiang, Z., Fu, C., Huang, R., & Yao, D.
(2020). A data-informed analytical approach to human-
scale greenway planning: Integrating multi-sourced
urban data with machine learning algorithms. Urban
Forestry & Urban Greening, vol. 56, p. 126871.
Ultralytics. (2020). YoloV5 [Source Code]. https://
github.com/ultralytics/yolov5
Velasquez-Camacho, L., Cardil, A., Mohan, M., Etxegarai,
M., Anzaldi, G., deMiguel S. (2021). Remotely sensed
tree characterization in urban areas: A Review. Remote
Sensing, 13(23), p. 4889.
Wang, R., Liu, Y., Lu, Y., Zhang, J., Liu, P., Yao, Y., &
Grekousis, G. (2019). Perceptions of built environment
and health outcomes for older Chinese in Beijing: A big
data approach with street view images and deep
learning technique. Computers, Environment and
Urban Systems
, vol. 78, p. 101386.
Wang, X., Chen, J., Tang, H., & Zhu, Z. (2022). MultiCLU:
Multi-stage context learning and utilization for store-
front accessibility detection and evaluation. In Proc. of
ACM Int. Conf. on Multimedia Retrieval, 304–312.
Xu, G., Zhu, X., Tapper N., & Bechtel B. (2019). Urban
climate zone classification using convolutional neural
network and ground-level images. Progress in Physical
Geography: Earth and Environment, 43(3), 410-424.
IMPROVE 2023 - 3rd International Conference on Image Processing and Vision Engineering
74

Yang, J., Zhao, L., Mcbride, J. & Gong, P. (2009). Can you
see green? assessing the visibility of urban forests in
cities. Landscape and Urban Planning, vol 91, 97-104.
Yang, J., Rong, H., Kang, Y., Zhang, F., & Chegut, A.
(2020). The financial impact of street-level greenery on
New York Commercial Buildings. SSRN Electronic
Journal.
Zhang, Y., Li, S., Fu, X., & Dong, R. (2021). Quantification
of urban greenery using hemisphere-view panoramas
with a green cover index. Ecosystem Health and
Sustainability, 7(1).
Zhou, H., He, S., Cai, Y., Wang, M., & Su, S. (2019). Social
Inequalities in neighborhood visual walkability: Using
Street view imagery and deep learning technologies to
facilitate healthy city planning. Sustainable Cities and
Society, vol. 50, p. 101605.
Zhu, A., Gao, R., & Uchida, S. (2016). Could scene con-
text be beneficial for scene text detection? Pattern
Recognition, 58:204–215.
Vegetation Coverage and Urban Amenity Mapping Using Computer Vision and Machine Learning
75
