
Integrated Optimization of Vehicle Trajectories and Traffic Signal
Timings
Hao Chen
a
and Hesham A. Rakha
b
Charles E. Via, Jr. Department of Civil and Environmental Engineering, Virginia Tech Transportation Institute,
Virginia Polytechnic Institute and State University, 3500 Transportation Research Plaza, Blacksburg, VA 24061, U.S.A.
Keywords: Integrated Controller, Signal Time Optimization, Vehicle Speed Control, Signalized Intersections,
Energy-Optimized Solution, Connected and Automated Vehicles, Microscopic Traffic Simulation.
Abstract: This research develops a bi-level optimizer that provides energy-optimal control for vehicles and traffic
signals. The first level optimizes the traffic signal timings to minimize the total energy consumption of
approaching vehicles. The traffic signal optimization can be easily implemented in real-time traffic signal
controllers and overcomes the shortcomings of the traditional Webster method, which overestimates the cycle
length when the traffic volume-to-capacity ratio exceeds 50 percent. The lower-level optimizer is the vehicle
speed controller, which calculates the optimal vehicle brake and throttle levels to minimize the energy
consumption of individual vehicles. The proposed integrated controller is first tested on an isolated signalized
intersection, and then on an arterial network with multiple signalized intersections to investigate the
performance of the proposed controller under various traffic demand levels. The test results demonstrate that
the proposed integrated controller can greatly improve energy efficiency producing fuel savings of up to
17.7%. It can also enhance traffic mobility by reducing traffic delays by up to a 47.2% and reducing vehicle
stops by up to 24.8%.
1 INTRODUCTION
The United States is one of the world’s prime
petroleum consumers, burning more than 20% of the
planet’s total refined petroleum. The surface
transportation sector alone accounts for around 69%
of the United States’ total petroleum usage and 33%
of the nation’s CO
2
emissions (Administration,
2018). This presents the transportation sector with
three important challenges: availability of fuel to
drive vehicles, emissions of greenhouse gases, and
vehicular crashes. It is, therefore, important to reduce
petroleum consumption and greenhouse gas
emissions to make surface transportation safer, more
efficient, and more sustainable (Kamalanathsharma,
2014).
Studies have shown that stop-and-go traffic near
signalized intersections can greatly increase traffic
delays, energy consumption, and emission levels on
arterial roads since vehicles are forced to stop ahead
of traffic signals when encountering red indications,
a
https://orcid.org/0000-0001-8272-734X
b
https://orcid.org/0000-0002-5845-2929
producing shock waves within the traffic stream
(Barth & Boriboonsomsin, 2008). Starting from the
1980s, many studies have focused on optimizing
traffic signal timings using measured traffic data to
improve the operation of arterial roads (Gartner,
Assman, Lasaga, & Hou, 1991; Park, Messer, &
Urbanik, 1999). In the past decade, the advanced
communication power in CVs ensures rapid
information sharing, which enables researchers to
develop eco-driving strategies to optimize vehicle
trajectories in real-time using signal phase and timing
(SPaT) data. This has the potential to greatly improve
traffic mobility and reduce energy consumption and
emissions (Almannaa, Chen, Rakha, Loulizi, & El-
Shawarby, 2019; Chen & Rakha, 2020; Chen, Rakha,
Loulizi, El-Shawarby, & Almannaa, 2016). Recently,
a few studies have attempted to simultaneously
optimize vehicle trajectories and traffic signal timings
to further improve transportation efficiency and fuel
economy on arterial roads. For instance, an integrated
optimization method was developed to optimize
Chen, H. and Rakha, H.
Integrated Optimization of Vehicle Trajectories and Traffic Signal Timings.
DOI: 10.5220/0011709900003479
In Proceedings of the 9th International Conference on Vehicle Technology and Intelligent Transpor t Systems (VEHITS 2023), pages 27-34
ISBN: 978-989-758-652-1; ISSN: 2184-495X
Copyright
c
2023 by SCITEPRESS – Science and Technology Publications, Lda. Under CC license (CC BY-NC-ND 4.0)
27

vehicle platoons and traffic signal timings using a
mixed integer linear programming model (C. Yu,
Feng, Liu, Ma, & Yang, 2018). However, this method
uses some unrealistic assumptions, such as assuming
all vehicles are homogeneous and lane changes are
instantaneous, which limit the method’s applicability.
A simplified simulation with one intersection was
designed to validate the performance of the proposed
method. In addition, another study developed a
cooperative method of traffic signal and vehicle speed
optimization at isolated intersections (Xu et al.,
2018). This method entails a two-level controller –
the first level calculates the optimal signal timings
and vehicle arrival times to minimize the total travel
time; the second level optimizes the engine power and
brake force to minimize the fuel consumption of
individual vehicles. However, the proposed method
assumes a 100% market penetration of CAVs, so it
cannot be used for CVs that are controlled by human
drivers. In addition, the optimization problem is
solved using an enumeration method, which results in
a heavy computational cost. Thereafter, a dynamic
programming and shooting heuristic approach is
proposed to optimize CAV trajectories and the traffic
signal controller at the same time (Guo et al., 2019).
A shooting heuristic algorithm was used to compute
near-optimal vehicle trajectories to save
computational costs. Numerical tests were conducted
that demonstrated that the proposed method
outperforms adaptive signal control. Although the
algorithm can be used with a mixture of CAVs and
CVs, the developed controller only optimizes CAVs
which can fully follow the speed control but does not
provide optimized speed for CVs.
According to the aforementioned studies,
optimizing both vehicle trajectories and signal
timings is a promising method to improve
transportation system efficiency and fuel economy on
arterial roads. However, there are several issues in
these studies. First, the developed methods are
generally very complicated with high computational
costs, and thus there is a need to develop a simpler
approach with low computational cost so that it can
be easily implemented in real-time applications.
Second, existing studies only validated the developed
methods either in numerical tests or simplified
simulation tests with only one intersection. This is
also because these methods are very complicated to
implement into simulation software or field tests. So,
there is a need to test the approach using microscopic
traffic simulation software and validate the
performances under various conditions, such as
different traffic demand levels on the arterial network
with multiple signalized intersections.
This study considers these issues in the previous
literature to develop an integrated vehicle speed and
traffic signal controller. In the proposed system, we
develop a two-layer optimization approach that is
computationally fast to provide energy-optimal
control for vehicles and traffic signal controllers.
These two optimizers will work in tandem by sharing
information. The optimizer in the first layer computes
the traffic signal timings to minimize the total energy
consumption levels of approaching vehicles from
upstream traffic. The traffic signal optimization can
be easily implemented into the real-time signal
controller, and it overcomes the issues in the
traditional Webster’s method of overestimating the
cycle length when the traffic volume-to-capacity ratio
exceeds 50 percent. The second layer optimizer is the
vehicle speed controller which calculates the optimal
vehicle brake and throttle levels to minimize the
energy consumption of individual vehicles. The
proposed integrated controller is first tested in an
isolated signalized intersection. An arterial network
with multiple intersections is then used to investigate
the performance of the proposed controller under
various traffic demands. The test results demonstrate
that the proposed integrated controller outperforms
other methods and produces the most savings in fuel
consumption, traffic delay, and vehicle stop under
various traffic demands.
The remainder of this paper is presented as
follows. The integrated controller is described in the
next section, including the traffic signal optimization,
and the vehicle speed controller. The proposed bi-
level controller is then tested in an isolated signalized
intersection. This is followed by implementing the
proposed controller on a simulated arterial network in
the town of Blacksburg, VA to test the network-level
performance under different traffic demands. The last
section provides the study conclusions.
2 PROPOSED INTEGRATED
CONTROLLER
The proposed integrated controller includes two
levels of optimization: one for traffic signals and the
other for vehicle trajectories. The traffic signal
controller optimizes the signal cycle length and
timing according to the incoming traffic flow rate
from the upstream links of the signalized intersection.
The individual vehicle speed controller optimizes the
vehicle trajectories using the data from traffic signals
and surrounding vehicles through V2I and V2V
communications. The integrated controller computes
VEHITS 2023 - 9th International Conference on Vehicle Technology and Intelligent Transport Systems
28

the optimized signal timing and vehicle trajectory to
minimize the energy consumption of the entire traffic
network. The details of the two-layer control
strategies are provided below.
2.1 Traffic Signal Optimization
The traditional goal of optimizing traffic signal cycle
length usually focuses on minimizing vehicle delay
and increasing throughput at the intersection. The
classic method is designed by British researcher F.V
Webster, who developed an optimal cycle length
formulation that approximates the signal timings
necessary to minimize vehicle delay (Webster, 1958),
as seen in Equation (1). This formulation has been
used in traffic analysis for years and is still one of the
prevailing methodologies used to determine the
optimal cycle length for traffic signals.
𝐶
=
1.5𝐿+ 5
1−𝑌
(1)
where,
C
opt
= cycle length to minimize delay in seconds.
L = total lost time for cycle in seconds.
Y = sum of flow ratios for critical lane groups.
However, several studies have found that the
optimal signal timing for minimizing delays is not
necessarily identical to the timing plans that minimize
energy consumption and emissions. For instance, a
generalized formulation was developed in (Akcelik,
1981) to compute optimal cycle time for signalized
intersections by different performance measures
including fuel consumption, cost and delay. An
additional parameter was introduced into the
equation, and different values were calibrated to
optimize cycle length for fuel consumption and delay.
The study in (Ma, Jin, & Lei, 2014) proposed and
compared various traffic signal optimization methods
using VISSIM and SUMO. The test results indicated
that there are apparent trade-offs between the goal of
mobility and sustainability. Moreover, researchers
studied the emissions at isolated intersections and
found that the goal of decreasing delays at
intersections and reducing emissions is not simply
equivalent (Li, Wu, & Zou, 2011). Delays at
intersections will increase if the number of vehicle
stops decrease, which will help reduce the pollution
at intersections. In addition, the study in (Liao, 2013)
considers a fuel-based signal optimization model,
which describes the stochastic effects of vehicle
movements that consume excess fuel. The proposed
model was compared with the results from Webster’s
model, TRANSYT 7F, and Synchro, demonstrating
the greatest efficiency among all the methods with
fuel consumption reductions of up to 40%.
Recent studies in (Calle-Laguna, Du, & Rakha,
2019; Calle Laguna, 2017) improved the traditional
equation recommended by Webster by using the data
obtained from microscopic traffic simulation
software. The improved model, represented in
Equation (2), has also outperformed Webster’s
equation to further reduce traffic delay, especially
during higher traffic demand volumes. Since
optimizing traffic signal to minimize traffic delay
doesn’t mean the fuel consumption is also minimized,
another new formulation in Equation (3) is computed
by optimizing the signal cycle length to minimize
vehicle fuel consumption levels. A case study has
shown that the improved equations overcome the
issues in the traditional Webster’s method of
overestimating the cycle length when the traffic
volume-to-capacity ratio exceeds 50 percent, the
detailed test results can be found in (Calle-Laguna et
al., 2019; Calle Laguna, 2017). First, the optimal
cycle length is obtained, thereafter the signal timings
are computed by considering the green times using
the critical lane traffic ratio (Urbanik et al., 2015).
Eventually, the optimal signal timings can be
computed according to the traffic flow rates from
upstream links of the signalized intersections at each
interval, e.g., five minutes.
𝐶
,
=
0.33𝐿+ 8.56
1−𝑌
+3.8
(2
)
𝐶
,
=
0.82𝐿
1−𝑌
+ 40
(3
)
2.2 Vehicle Trajectory Optimization
In this study, the vehicle trajectory is optimized by the
connected eco-driving controller, named eco-
cooperative adaptive cruise control at intersections
(Eco-CACC-I), previously developed in (Almannaa
et al., 2019; Chen & Rakha, 2020; Chen et al., 2016)
to compute real-time fuel/energy-optimized vehicle
trajectories in the vicinity of signalized intersections.
The control region was defined from a distance
upstream of the signalized intersection (d
up
) to a
distance downstream of the intersection (d
down
) in
which the Eco-CACC-I controller optimizes the
vehicle trajectories approaching and leaving
signalized intersections. Upon approaching a
signalized intersection, the vehicle may accelerate,
decelerate, or cruise (maintain a constant speed)
based on several factors, such as vehicle speed, signal
timing, phase, distance to the intersection, road grade,
headway distance, etc. We assumed no leading
Integrated Optimization of Vehicle Trajectories and Traffic Signal Timings
29

vehicle ahead of the subject vehicle so that we could
compute the energy-optimized vehicle trajectory for
the subject without considering the impacts of other
surrounding vehicles. The computed optimal speed
was used as a variable speed limit, denoted by v
e
(t),
which is one of the constraints on the subject
vehicle’s longitudinal motion. When a vehicle travels
on the roadway, there are other constraints to be
considered, including the allowed speed constrained
by the vehicle dynamics model, steady-state car
following model, collision avoidance constraints, and
roadway speed limit. All these constraints work
together to control the vehicle speed. In this way, the
proposed controller can also be used in the situation
that the subject vehicle follows a leading vehicle, and
the vehicle speed can be computed by v(t) = min(v
1
(t),
v
2
(t), v
3
(t), v
4
(t), v
e
(t)) using the following constraints:
• The maximum speed v
1
(t) allowed by the vehicle
acceleration model for a given vehicle throttle
position.
• The maximum speed v
2
(t) constrained by the
steady-state vehicle spacing in the simulation
software.
• The speed v
3
(t) to avoid a rear-end vehicle
collision.
• The road speed limit v
4
(t).
Within the control region, the vehicle’s behavior
can be categorized into one of two cases: (1) the
vehicle can proceed through the signalized
intersection without decelerating or (2) the vehicle
must decelerate to proceed through the intersection.
Given that vehicles drive in different manners for
cases 1 and 2, the Eco-CACC-I control strategies
were developed separately for the two cases.
Case 1 does not require the vehicle to decelerate to
traverse the signalized intersection. In this case, the
cruise speed for the vehicle to approach the
intersection during the red indication can be
calculated using Equation (4) to maximize the
average vehicle speed within the control region.
When the vehicle enters the control region, it should
adjust its speed to u
c
by following the vehicle
dynamics model developed in (K. Yu, Yang, &
Yamaguchi, 2015). After the traffic signal indication
turns from red to green, the vehicle accelerates from
the speed u
c
to the maximum allowed speed (speed
limit u
f
) by following the vehicle dynamics model
until it leaves the control region.
𝑢
=𝑚𝑖𝑛
𝑑
𝑡
,𝑢
(4)
Figure 1: Vehicle optimum speed profile.
In case 2, the vehicle’s energy-optimized speed
profile is illustrated in Figure 1. After entering the
control region, the vehicle with the initial speed of
u(t
0
) needs to brake at the deceleration level denoted
by a, then cruise at a constant speed of u
c
to approach
the signalized intersection. After passing the stop bar,
the vehicle should increase speed to u
f
per the vehicle
dynamics model and then cruise at u
f
until the vehicle
leaves the control region. In this case, the only
unknown variables are the upstream deceleration rate
a and the downstream throttle f
p
. The following
optimization problem is formulated to compute the
optimum vehicle speed profile associated with the
least energy consumption.
Assuming a vehicle enters the Eco-CACC-I
control region at time t
0
and leaves the control region
at time t
0
+T, the objective function entails
minimizing the total energy consumption as
𝑚𝑖𝑛 𝐸𝐶𝑢
(
𝑡
)
·𝑑𝑡
(5)
where EC denotes the energy consumption at instant
t. The energy models for internal combustion engine
vehicles (ICEVs) are presented in Equations (8) ~ (9).
The constraints to solve the optimization problem can
be built according to the relationships between
vehicle speed, location, and acceleration/deceleration
as presented below:
𝑢
(
𝑡
)
:
⎩
⎪
⎨
⎪
⎧
𝑢
(
𝑡
)
=𝑢
(
𝑡
)
−𝑎𝑡
𝑢
(
𝑡
)
=𝑢
𝑡
≤𝑡≤𝑡
𝑡
<𝑡≤𝑡
𝑢
(
𝑡+∆𝑡
)
=𝑢
(
𝑡
)
+
(
)
∆𝑡
𝑢
(
𝑡
)
=𝑢
𝑡
<𝑡≤𝑡
𝑡
<𝑡≤𝑡
+𝑇
(6)
𝑢
𝑢
(
𝑡
)
·𝑡−
1
2
𝑎𝑡
+𝑢
(
𝑡
−𝑡
)
=𝑑
𝑢
=𝑢
(
𝑡
)
−𝑎
(
𝑡
−𝑡
)
𝑢
(
𝑡
)
𝑑𝑡 +𝑢
(
𝑡
+𝑇−𝑡
)
=𝑑
𝑢
(
𝑡
)
=𝑢
𝑎
<𝑎≤𝑎
𝑓
≤
𝑓
≤
𝑓
𝑢
>0
(7)
VEHITS 2023 - 9th International Conference on Vehicle Technology and Intelligent Transport Systems
30

where u(t) is the velocity at instant t; m is the vehicle
mass; 𝑎
(
𝑡
)
=𝑑𝑣(𝑡)𝑑𝑡
⁄
is the acceleration of the
vehicle in [m/s
2
] (𝑎
(
𝑡
)
takes negative values when the
vehicle decelerates); function F denotes vehicle
tractive force, and function R represents all the
resistance forces (aerodynamic, rolling, and grade
resistance forces). Note that the maximum
deceleration is limited by the comfortable threshold
felt by average drivers (Kamalanathsharma, 2014).
The throttle value f
p
ranges between f
min
and f
max
. An
A-star dynamic programming approach is used to
solve the problem by constructing a graph of the
solution space by discretizing the combinations of
deceleration and throttle values and calculating the
corresponding energy consumption levels; the
minimum path through the graph computes the
energy-efficient trajectory and optimum parameters
(Guan & Frey, 2013; Kamalanathsharma, 2014).
𝐹𝐶
(𝑡)
=
𝑎
+𝑎
𝑃
(
𝑡
)
+𝑎
𝑃(𝑡)
∀ 𝑃(𝑡)≥0
𝑎
∀ 𝑃(𝑡)<0
(8)
𝑃
(
𝑡
)
=(𝑚𝑎
(
𝑡
)
+ 𝑚𝑔 ∙
𝐶
1000
(
𝑐
𝑢
(
𝑡
)
+𝑐
)
+𝜌
𝐴
𝐶
𝑢
(
𝑡
)
2
⁄
+𝑚𝑔 𝜃)𝑢(𝑡)
(9)
where FC
ICEV
(t) is the fuel consumption rate for
ICEV; α
, α
and α
are the model parameters that
can be calibrated for a particular vehicle using public
available vehicle specification information from the
manufacturer, and the details of calibration steps can
be found in (Rakha, Ahn, Moran, Saerens, & Van den
Bulck, 2011); P(t) is the instantaneous total power
(kW); 𝑔 [m/s
2
] is the gravitational acceleration; 𝜃 is
the road grade; 𝐶
,𝑐
and 𝑐
are the rolling resistance
parameters that vary as a function of the road surface
type, road condition, and vehicle tire type; 𝜌
[kg/m
3
] is the air mass density; 𝐴
[m
2
] is the frontal
area of the vehicle, and 𝐶
is the aerodynamic drag
coefficient of the vehicle.
3 CASE STUDY
In order to test the performance of the proposed
control strategies, we implement the controllers in the
microscopic traffic simulation software and conduct
two tests using an isolated signalized intersection and
an arterial traffic network with multiple signalized
intersections, respectively.
INTEGRATION is used as the simulation tool to
simulate the traffic network in the case study.
INTEGRATION is an integrated simulation and
traffic assignment model that creates individual
vehicle trip departures based on an aggregated time-
varying O-D matrix. In consideration of traffic
control devices and gap acceptance, INTEGRATION
moves vehicles along the network in accordance with
embedded preset traffic assignment models and the
Rakha-Pasumarthy-Adjerid (RPA) car-following
model. A more detailed description of
INTEGRATION is provided in the literature (M. V.
Aerde & Rakha, 2007a, 2007b).
3.1 Isolated Intersection Test Case
This test considers the simplest case of a single-lane
signalized intersection to validate the performance of
using the proposed controller. The traffic stream
parameters on the major road are free flow speed of
40 mph, a speed at capacity of 30 mph, a saturation
flow rate of 1600 veh/h/lane, and a jam density of 160
veh/km/lane. The total simulation time is 60 minutes,
and the traffic signal timing is optimized every 5
minutes. The vehicle speed is optimized within the
control region: 200 meters upstream and 200 meters
downstream of the intersection. Three levels of traffic
demand volumes are considered in the test using the
volume over capacity values of 0.1, 0.5, and 1,
respectively. Five test scenarios described below are
compared in the test.
• Scenario 1 (S1): Base
This is the base scenario without signal
optimization and vehicle speed control. The fixed-
time signals (cycle length and green times) were
obtained by using the final optimized signal timings
in scenario 2 after running for 60 minutes.
• Scenario 2 (S2): Signal Optimization – Webster
The traffic signal is optimized using Webster’s
method as shown in Equation (1).
• Scenario 3 (S3): Signal Optimization – Delay
The traffic signal is optimized using the modified
method to minimize traffic delay as shown in
Equation (2).
• Scenario 4 (S4): Signal Optimization – Fuel
The traffic signal is optimized using the modified
method to minimize fuel consumption as shown in
Equation (3).
• Scenario 5 (S5): Integrated Controller (Signal
Optimization – Fuel + Eco-CACC-I)
The traffic signal is optimized using the modified
method to minimize fuel consumption as shown in
Equation (3), and vehicle speed is optimized using the
Eco-CACC-I controller within the control region.
Integrated Optimization of Vehicle Trajectories and Traffic Signal Timings
31
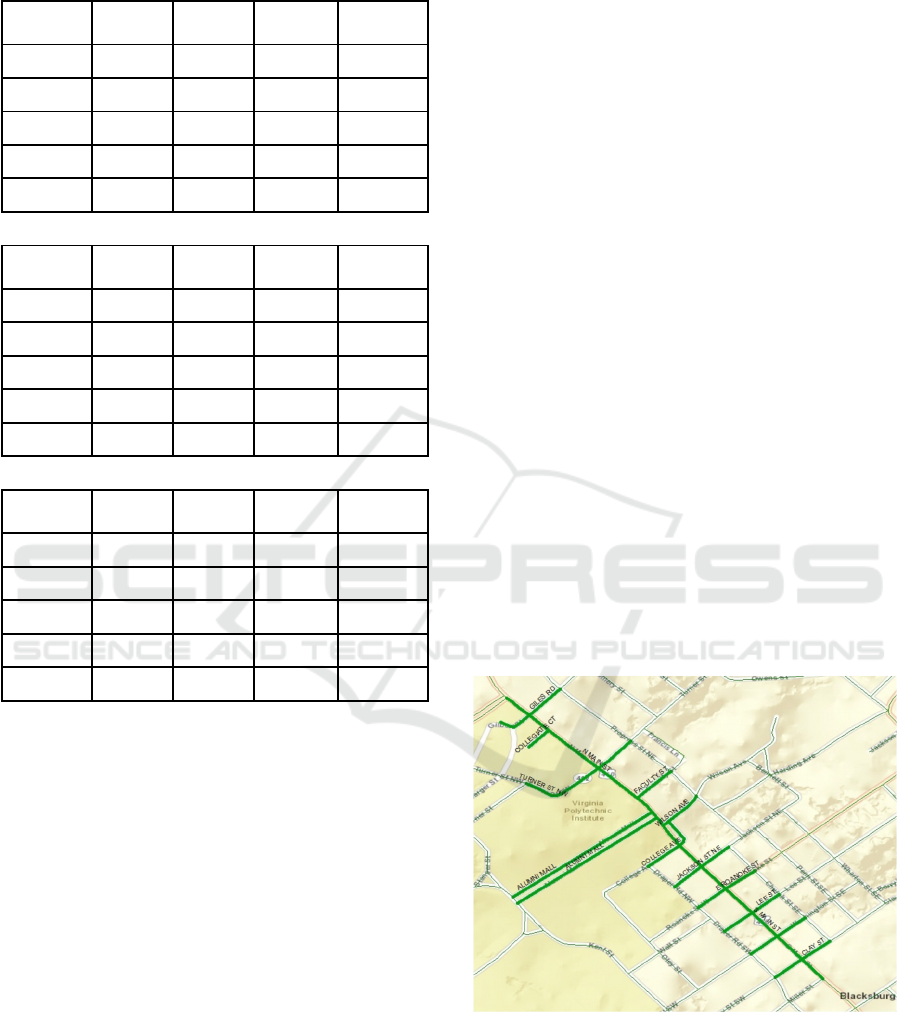
Table 1: Test results on isolated signalized intersection.
Uncon
g
ested
(
v/c=0.1
)
Scenario
s
FC
(liter)
FC
saving
Delay
(sec)
Delay
saving
S1 0.1012 11.4
S2 0.0979 -3.3% 10.9 -4.8%
S3 0.0972 -3.9% 10.8 -5.4%
S4 0.0955 -5.6% 11.5 1.1%
S5 0.0932 -7.9% 11.8 3.6%
Medium (v/c=0.5)
Scenario
s
FC
(
liter
)
FC
savin
g
Delay
(
sec
)
Delay
savin
g
S1 0.1054 12.8
S2 0.1021 -3.1% 12.4 -3.4%
S3 0.1019 -3.3% 12.2 -4.7%
S4 0.0998 -5.3% 12.3 -3.9%
S5 0.0979 -7.1% 13.0 1.0%
Con
g
ested
(
v/c=1
)
Scenario
s
FC
(
liter
)
FC
savin
g
Delay
(
sec
)
Delay
savin
g
S1 0.1089 32.7
S2 0.1056 -3.0% 32.5 -0.7%
S3 0.1052 -3.4% 31.9 -2.3%
S4 0.1032 -5.2% 32.3 -1.3%
S5 0.1018 -6.5% 36.0 10.0%
The test results of the five scenarios for various
traffic demand levels are summarized in Table 1. For
uncongested traffic conditions, both the modified
signal optimization methods in S3 and S4 outperform
Webster’s method (S2) by producing more fuel
savings. But the total delay in S4 is higher than
S1~S3, which matches with findings in previous
studies stating that the optimal signal timing for
minimizing delays is not necessarily identical to the
timing plans that aim at minimizing energy
consumption and emissions. The proposed integrated
controller in S5 produces the most fuel savings of
7.9% compared to the base scenario without any
controller. However, it also produces an increased
total delay of 3.6% compared to S1. Similar trends
can be found in the medium and congested traffic
conditions. For the medium traffic demand, the fuel
consumption continues to decrease from S1 to S5.
The integrated controller produces the most fuel
savings of 7.1%, but the corresponding total delay is
increased by 1.0% compared to S1. For congested
traffic conditions, the integrated controller in S5
reduces fuel consumption by 6.5%, but it also greatly
increases the traffic delay by 10.0% compared to S1.
Overall, the test results demonstrate the proposed
integrated controller can effectively reduce fuel
consumption at isolated signalized intersections.
3.2 Arterial Traffic Network Test Case
The proposed integrated controller is further tested on
an arterial network located in the heart of downtown
Blacksburg, as shown in Figure 2. The O-D demand
matrices were generated using QueesOD software
(M. Aerde & Rakha, 2010) and were based on traffic
counts collected during the afternoon peak period (4
~ 6 pm) at 15 minutes intervals for the year 2012
(Abdelghaffar, Yang, & Rakha, 2017). The
simulations were conducted using the following
parameter values: free-flow speed of 40 km/h based
on the roadway speed limit, speed-at-capacity of 29
km/h, jam density of 160 veh/km/lane, and saturation
flow rate of 1800 veh/h/lane. In the simulation,
vehicles were allowed to enter the links in the first 2
hours, and the simulation ran for an extra 15 minutes
to guarantee that all vehicles exited the network.
Three different traffic demand volumes are
investigated during this test. 100% demand represents
the O-D demand matrices calibrated by the field data
during afternoon peak hours. Then we also consider
25% and 50% demand to investigate the
performances of the different controllers.
Figure 2: The arterial roadways in the city of Blacksburg,
VA.
In this test, the same five different scenarios as
described in the isolated intersection test are also
considered. The test results of five scenarios for three
traffic demand levels are summarized in Table 2. For
VEHITS 2023 - 9th International Conference on Vehicle Technology and Intelligent Transport Systems
32
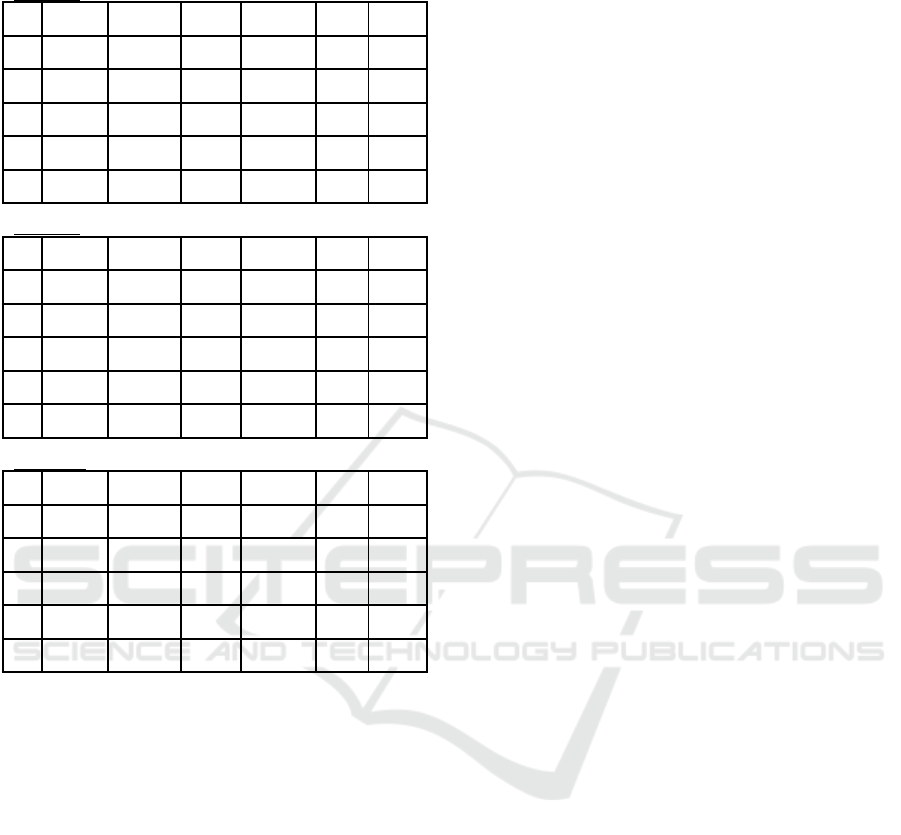
Table 2: Test results on arterial network.
25% Demond
Sc.
FC
(liter)
FC saving
Delay
(sec)
Delay
saving
Stops
Stops
saving
S1 0.0751 33.4 1.49
S2 0.0688 -8.4% 22.7 -32.0% 2.08 39.6%
S3 0.0692 -7.9% 21.3 -36.2% 2.01 34.9%
S4 0.0675 -10.1% 23.2 -30.5% 2 34.2%
S5 0.0646 -14.0% 22.9 -31.4% 1.13 -24.2%
50% Demond
Sc.
FC
(liter)
FC saving
Delay
(sec)
Delay
saving
Stops
Stops
saving
S1 0.0757 34.6 1.53
S2 0.0675 -10.8% 20.9 -39.6% 1.97 28.8%
S3 0.0681 -10.0% 20.1 -41.9% 1.94 26.8%
S4 0.0664 -12.3% 21.6 -37.6% 1.92 25.5%
S5 0.0643 -15.0% 20.9 -39.6% 1.15 -24.8%
100% Demond
Sc.
FC
(liter)
FC saving
Delay
(sec)
Delay
saving
Stops
Stops
saving
S1 0.0791 39 1.61
S2 0.0671 -15.2% 19.4 -50.3% 1.86 15.5%
S3 0.0679 -14.2% 18.5 -52.6% 1.84 14.3%
S4 0.0668 -15.6% 20.9 -46.4% 1.82 13.0%
S5 0.0651 -17.7% 20.6 -47.2% 1.24 -23.0%
25% traffic demand, the delay-optimized method in
S3 outperforms Webster’s method in S2 and the fuel-
optimized method in S4 by producing the greatest
reduction in delay at 36.2%. The fuel-optimized
method in S4 outperforms Webster’s method in S2
and the delay optimized method in S3 by producing
the most fuel savings at 10.1%. These findings are
consistent with the test results in (Calle-Laguna et al.,
2019; Calle Laguna, 2017) and prove that Webster’s
method represented in Equation (1) is indeed
improved by the modified methods in Equations (2)
and (3). However, the scenarios of S2, S3 and S4
result in more than a 34% increase in vehicle stops on
the arterial network. Among all five scenarios, the
integrated controller in S5 produces the greatest
reduction in vehicle stops compared to S1, at 24.2%.
S5 also produces the most fuel savings (14.0%) of all
five scenarios. The test results under 25% demand
indicate that the integrated controller can greatly
enhance traffic mobility with a 31.4% reduction in
total delay and a 24.2% reduction in vehicle stops, at
the same time improving the energy efficiency with a
14.0% reduction in fuel consumption. Similar trends
can be observed for the 50% and 100% demand
levels. In both cases, the integrated controller
produces the most savings in fuel consumption and
vehicle stops while significantly reducing traffic
delay. Overall, the test results on the arterial network
indicate that the proposed controller can greatly
improve energy efficiency with 17.7% fuel savings
and enhance traffic mobility with up to a 47.2%
reduction in total delay and 24.8% reduction in
vehicle stops.
4 CONCLUSIONS
This paper develops a bi-level controller that provides
energy-optimal traffic signal and vehicle trajectory
control. At the upper level, the controller computes
the traffic signal timings to minimize the total energy
consumption levels of approaching vehicles. The
traffic signal optimization can be easily implemented
in real-time signal controllers and overcomes the
problems with the traditional Webster’s method of
overestimating the cycle length when the traffic
volume-to-capacity ratio exceeds 50 percent. At the
lower level, the controller optimizes the vehicle brake
and throttle levels to minimize the energy
consumption of individual vehicles. The proposed
integrated controller is first tested in an isolated
signalized intersection, and then on an arterial
network with multiple signalized intersections to test
the controller under various traffic demand levels.
The test results demonstrate that the proposed
integrated controller can greatly improve energy
efficiency with up to 17.7% fuel savings, at the same
time enhancing the traffic mobility by reducing total
delay by 47.2% and vehicle stops by 24.8%. More
tests on city-level traffic networks will be considered
in future work. We will also consider expanding the
integrated control strategies to different vehicle types
such as battery electric and hybrid electric vehicles.
ACKNOWLEDGEMENTS
This work was funded by the Urban Mobility &
Equity Center at Morgan State University under the
University Transportation Center(s) Program of the
U.S. Department of Transportation.
Integrated Optimization of Vehicle Trajectories and Traffic Signal Timings
33

REFERENCES
Abdelghaffar, H. M., Yang, H., & Rakha, H. A. (2017).
Developing a de-centralized cycle-free nash bargaining
arterial traffic signal controller. Paper presented at the
2017 5th IEEE International Conference on Models and
Technologies for Intelligent Transportation Systems
(MT-ITS).
Administration, U. S. E. I. (2018). Oil: crude and petroleum
products explained. Retrieved from https://www.eia.
gov/energyexplained/oil-and-petroleum-products/use-
of-oil.php
Aerde, M., & Rakha, H. A. (2010). QUEENSOD Rel.
2.10—User’s Guide: Estimating Origin—Destination
Traffic Demands from Link Flow Counts. Tech. Rep.
Aerde, M. V., & Rakha, H. (2007a). INTEGRATION ©
Release 2.30 for Windows: User's Guide – Volume I:
Fundamental Model Features. M. Van Aerde & Assoc.,
Ltd., Blacksburg.
Aerde, M. V., & Rakha, H. (2007b). INTEGRATION ©
Release 2.30 for Windows: User's Guide – Volume II:
Advanced Model Features. M. Van Aerde & Assoc.,
Ltd., Blacksburg.
Akcelik, R. (1981). Traffic signals: capacity and timing
analysis: Australian Road Research Board.
Almannaa, M. H., Chen, H., Rakha, H. A., Loulizi, A., &
El-Shawarby, I. (2019). Field implementation and
testing of an automated eco-cooperative adaptive cruise
control system in the vicinity of signalized
intersections. Transportation Research Part D:
Transport and Environment, 67, 244-262.
Barth, M., & Boriboonsomsin, K. (2008). Real-world
carbon dioxide impacts of traffic congestion.
Transportation Research Record: Journal of the
Transportation Research Board(2058), 163-171.
Calle-Laguna, A. J., Du, J., & Rakha, H. A. (2019).
Computing optimum traffic signal cycle length
considering vehicle delay and fuel consumption.
Transportation Research Interdisciplinary
Perspectives, 3, 100021.
Calle Laguna, A. J. (2017). Isolated Traffic Signal
Optimization Considering Delay, Energy, and
Environmental Impacts. (Unpublished thesis), Virginia
Tech.
Chen, H., & Rakha, H. A. (2020). Battery Electric Vehicle
Eco-Cooperative Adaptive Cruise Control in the
Vicinity of Signalized Intersections. Energies, 13(10),
2433.
Chen, H., Rakha, H. A., Loulizi, A., El-Shawarby, I., &
Almannaa, M. H. (2016). Development and
Preliminary Field Testing of an In-Vehicle Eco-Speed
Control System in the Vicinity of Signalized
Intersections. IFAC-PapersOnLine, 49(3), 249-254.
Gartner, N. H., Assman, S. F., Lasaga, F., & Hou, D. L.
(1991). A multi-band approach to arterial traffic signal
optimization. Transportation Research Part B:
Methodological, 25(1), 55-74.
Guan, T., & Frey, C. W. (2013). Predictive fuel efficiency
optimization using traffic light timings and fuel
consumption model. Paper presented at the Intelligent
Transportation Systems-(ITSC), 2013 16th
International IEEE Conference on.
Guo, Y., Ma, J., Xiong, C., Li, X., Zhou, F., & Hao, W.
(2019). Joint optimization of vehicle trajectories and
intersection controllers with connected automated
vehicles: Combined dynamic programming and
shooting heuristic approach. Transportation Research
Part C: Emerging Technologies, 98
, 54-72.
Kamalanathsharma, R. K. (2014). Eco-Driving in the
Vicinity of Roadway Intersections - Algorithmic
Development, Modeling, and Testing. (Doctor of
Philosophy), Virginia Polytechnic Institute and State
University.
Li, J.-Q., Wu, G., & Zou, N. (2011). Investigation of the
impacts of signal timing on vehicle emissions at an
isolated intersection. Transportation Research Part D:
Transport and Environment, 16(5), 409-414.
doi:http://dx.doi.org/10.1016/j.trd.2011.03.004
Liao, T.-Y. (2013). A fuel-based signal optimization model.
Transportation Research Part D: Transport and
Environment, 23(1), 1-8.
Ma, X., Jin, J., & Lei, W. (2014). Multi-criteria analysis of
optimal signal plans using microscopic traffic models.
Transportation Research Part D: Transport and
Environment, 32(0), 1-14.
doi:http://dx.doi.org/10.1016/j.trd.2014.06.013
Park, B., Messer, C. J., & Urbanik, T. (1999). Traffic signal
optimization program for oversaturated conditions:
genetic algorithm approach. Transportation Research
Record, 1683(1), 133-142.
Rakha, H. A., Ahn, K., Moran, K., Saerens, B., & Van den
Bulck, E. (2011). Virginia tech comprehensive power-
based fuel consumption model: model development and
testing. Transportation Research Part D: Transport
and Environment, 16(7), 492-503.
Urbanik, T., Tanaka, A., Lozner, B., Lindstrom, E., Lee, K.,
Quayle, S., . . . Gettman, D. (2015). Signal timing
manual (Vol. 1): Washington, DC: Transportation
Research Board.
Webster, F. V. (1958). Traffic Signal Settings. Road
Research Technical Paper No. 39.
Xu, B., Ban, X. J., Bian, Y., Li, W., Wang, J., Li, S. E., &
Li, K. (2018). Cooperative method of traffic signal
optimization and speed control of connected vehicles at
isolated intersections. IEEE Transactions on Intelligent
Transportation Systems, 20(4), 1390-1403.
Yu, C., Feng, Y., Liu, H. X., Ma, W., & Yang, X. (2018).
Integrated optimization of traffic signals and vehicle
trajectories at isolated urban intersections.
Transportation Research Part B: Methodological, 112,
89-112.
Yu, K., Yang, J., & Yamaguchi, D. (2015). Model
predictive control for hybrid vehicle ecological driving
using traffic signal and road slope information. Control
theory and technology, 13(1), 17-28.
VEHITS 2023 - 9th International Conference on Vehicle Technology and Intelligent Transport Systems
34
